Abstract
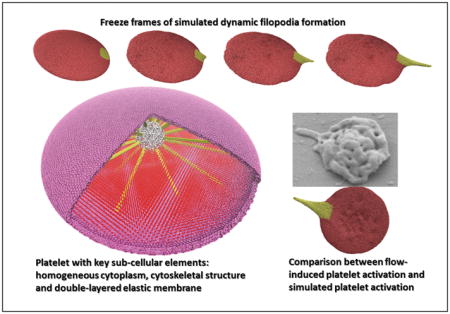
We developed a phenomenological three-dimensional (3D) platelet model to characterize the filopodia formation observed during early stage platelet activation. Departing from continuum mechanics based approaches; this coarse-grained molecular dynamics (CGMD) particle-based model can deform to emulate the complex shape change and filopodia formation that platelets undergo during activation. The platelet peripheral zone is modeled with a two-layer homogeneous elastic structure represented by spring-connected particles. The structural zone is represented by a cytoskeletal assembly comprising of a filamentous core and filament bundles supporting the platelet’s discoid shape, also modeled by spring-connected particles. The interior organelle zone is modeled by homogeneous cytoplasm particles that facilitate the platelet deformation. Non-bonded interactions among the discrete particles of the membrane, cytoskeletal assembly, and the cytoplasm are described using the Lennard-Jones potential with empirical constants. By exploring the parameter space of this CGMD model, we have successfully simulated the dynamics of varied filopodia formations. Comparative analyses of length and thickness of filopodia show that our numerical simulations are in agreement with experimental measurements of flow-induced activated platelets.
Key Terms: coarse grained molecular dynamics, platelet structure, parallel computing, platelet activation, shear stress
Graphical Abstract
1. Introduction
Thrombosis in cardiovascular disease and implanted devices is one of the leading reasons for stroke, myocardial infarction and cardiac death [1]. Rheological factors arising from pathological flow patterns occurring in blood recirculating devices [2, 3] and stenosis [4] – exposure to elevated shear stress, flow separation and long residence times – enhance the platelets propensity to activate, initiate the coagulation cascade, and form thrombi [5]. Flow and stresses induced by pathological blood flow on platelets can be represented to a limited extent by a continuum mechanics model (to the micrometer length scale). However, the molecular effects of adhesion/aggregation bonds occur at the nanometer scale. Thus, there is a need for a cellular-level platelet model to describe the phenomena at these length scales.
Numerical modeling of the platelet activation processes caused by mechanical stimuli is a major challenge. The non-spherical discoid shape characterizing platelets’ initial morphology and the ensuing rapid shape change during activation by extrusion of filopodia requires a platelet model that is capable of depicting such dynamic deformable behavior. Describing the rheological blood flow at the macroscale level, some investigators considered platelets as particles and showed the strong effect of fluid stresses [6, 7] and fluid flows [8] on platelet aggregation. At the cellular level, several studies incorporating platelets’ role in response to biomechanical processes have been conducted. In order to understand their hydrodynamics and aggregate dynamics, platelets were first treated as smooth solid spheres [9, 10]. Later, numerical studies were conducted to analyze the sedimentation behavior as a function of distance from the wall, where the platelets were treated as hexagonal flakes [11]. In other studies, platelets were treated analytically as thin 2D elliptical planar surfaces to understand the mechanics of the tethering process as they flip on a surface [12] and lateral motion near wall induced by red blood cells [13]. Platelets were further modeled as 3D oblate spheroid [14] of aspect ratio 0.25 to study flipping of an adhesive platelet over a substrate. Similar 3D oblate spheroids [15, 16] were used to characterize the adhesion of colliding platelet surfaces near wall. In 2011, a 3D coarse-grained rigid oblate spheroid flow-cell interaction model [17] was developed using sub-cellular elements to simulate cell motion, with the cell coupled to the plasma flow by the Langevin equation. These modeling approaches advanced the simulations of biomechanical processes such as platelet flipping and adhering, but excluded more complicated morphological changes such as filopodia formation which play an essential role in platelet aggregation and adhesion. Platelet pseudopodia, particularly filopodia - the long, finger-like projections, have been observed to play a role in both aggregation and adhesion. Aggregation efficiency improves due to both filopod number and length [18], possibly due to localization of the GPIIb-IIIa receptors on them, which allow the platelets to stick to each other[19]. Furthermore, filopods on platelets have been shown to support rolling on a thrombogenic surface under high shear flow [20]. Recently, pseudopodia growth on platelets under static adhesion has been examined using imaging techniques [21–23], but their dynamic growth on platelets due to shear-induced activation has not been observed.
An atomic scale-based model can describe such formation, but requires trillions of atoms for modeling a single platelet and complicated molecular force field formulations that exceeds current computing capability [24]. A CGMD approach is computationally feasible and more efficient for analyzing the complex dynamics observed during platelet activation. In the CGMD method, a collection of atoms or molecules is considered as one representative particle, allowing the simulation of larger systems with longer simulation time [25]. CGMD is especially useful for phenomena occurring at different scales, for e.g., the mechanical processes governing the cell and its internal structures occurring at the order of nano, micro, milli, to even few seconds. Recently, CGMD has been used to study and simulate the mechanical behavior of actin cytoskeleton which aides in cell morphology and movement and spans the spatial-temporal scales [26]. Advancing from the traditional continuum approaches, a phenomenological CGMD model comprising of discrete particles interacting with coarse-grained molecular dynamics force fields is developed in this study. By considering the principal intra-platelet constituents, this computationally affordable 3D model is capable of emulating a platelet in its quiescent state. Our model, while not directly representing the platelet physiology, can simulate the dynamic process of filopodia formation. This filopodia formation is a key observation during early stage platelet activation [27] when platelets are exposed to varying levels of fluid shear stresses. The cell geometry, filopodia length and thickness can be modeled by directly correlating nanoscopic model parameters to experimental measurements. Our modeling results, length and thickness of filopodia, are compared with Scanning Electron Microscopy (SEM) images of platelets that were exposed to varying shear stress-exposure time combinations.
2. Methods
2.1. Particle-based Platelet Model
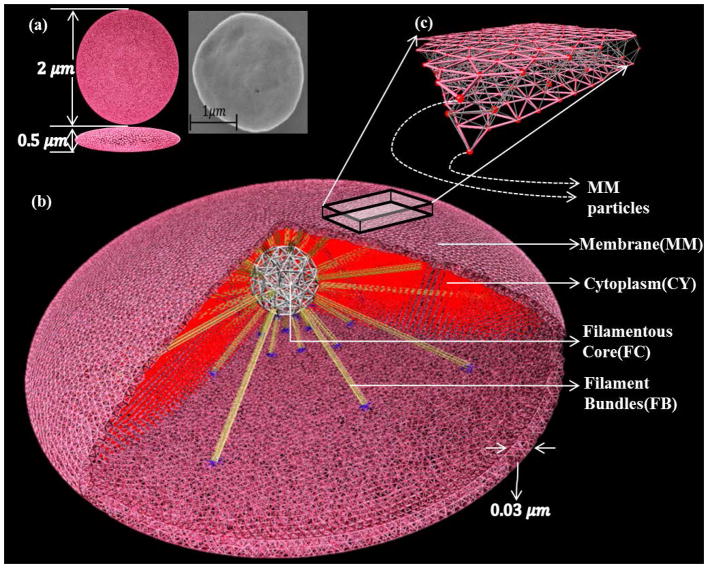
In its quiescent state, the discoid platelet (Fig. 1a) is composed of three zones: the peripheral, structural and organelle. The peripheral zone consists of a phospholipid bilayer membrane (thickness of 100 A), an exterior coat (thickness of 150 A-200 A) and an open canalicular system (OCS) [28]. This zone can stretch and deform during filopodia formation. The structural zone has a cytoskeletal assembly with two key components, (a) an actin-based space-filling spoke-like arrangement with the 3D actin cortex at the center and the actin filaments as the spokes [29, 30] and (b) a spectrin-based membrane skeleton. It also contains a peripheral microtubule coil that confers the discoid shape of the platelet. During the initial stages of activation, actin-based filament network reassembles and polymerizes, deforming the membrane to form filopodia. The organelle zone is an inhomogeneous gel-like cytoplasm with few dense bodies, granules, mitochondria, dense tubular system and lysosomes. This zone is responsible for metabolic events of the platelet but its mechanical role in growth of filopodia is negligible.
Figure 1.
3D model geometry of the simulated platelet. (a) The orthographic view of the platelet model in comparison to the experimental SEM image of the quiescent platelet. (b) Model components representing the various zones of the phenomenological platelet: membrane, cytoskeletal assembly (filamentous core and filament bundles) and cytoplasm. (c) Membrane piece shown with particles connected with spring bonds. The membrane and cytoplasm particles constitute 80% of the total number of particles and play a major role in maintaining the discoid shape during quiescent state and deformation during formation of filopodia. The cytoskeletal assembly particles constitute rest of the 20% and their structural mechanics promote filopod formation.
In order to simulate the shape change of the platelet before and during the formation of filopodia, we characterize the phenomenological functions of each zone. Accordingly, the platelet model consists of three main components: the membrane, cytoskeletal assembly and cytoplasm (Fig. 1b). The membrane (thickness of 300A) is designed as a cortical shell for representing the stretchable peripheral zone that includes the phospholipid bilayer and the exterior coat. Following the works in [32–37], the membrane is, characterized by spring-connected particles (Fig. 1c) residing at the nodes of a network of triangles constructed by the 3D Delaunay triangulation method [38]. The surface invaginations caused by the OCS that account for the extra membrane, are represented to a certain degree by this stretchable membrane allowing it to be intact during filopodia formation.
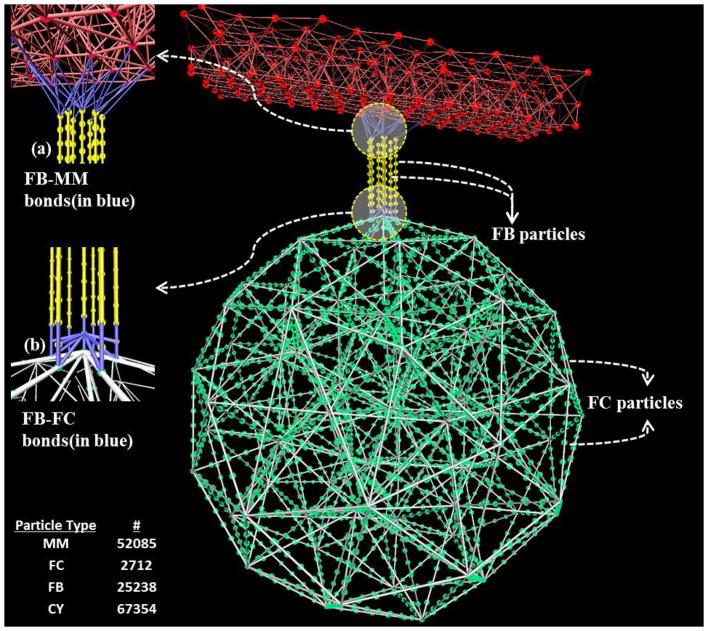
The cytoskeletal assembly is designed for representing the actin-based structural zone. We have not included the spectrin-based membrane skeleton and the microtubule coil that disassemble after activation. Also, microtubule dynamics is not involved prior to sphering of the platelet, a later stage in activation [31]. The actin cortex and radiating actin filaments functions of the structural zone are modeled by the rigid filamentous core and protrusible filament bundles respectively (Fig. 1b) to resemble the spoke-like assembly. The filamentous core (Fig. 2) is constructed by uniformly distributing spring-connected particles along the edges and vertices of a 3D triangulation of a sphere with diameter 0.3 μm. The rigidity of the core is ensured by both the global polyhedral stability and the local stiffness of the spring-connected particles. Due to the experimental limitations in isolating and measuring the cytoskeletal assembly from platelets that are still relatively discoid (i.e. not highly activated or spread), an approximated diameter for the core is used. The filament bundles originating from the exterior of the filamentous core extend radially outward using spring-connected particles, and deform the platelet membrane to form filopodia. The filament bundles are treated as straight spring bundles before activation, and generate an extension-dependent force. Each filament bundle is connected to the membrane via a few spring bonds (Fig. 2a) that mimic spectrin and adducin activity [29] on the actin filament ends. Actin-based filopodia formation, in reality, entails a hierarchical structure on multiple length (and time) scales and it is a combination of chemical interactions and mechanical feedbacks [39]. Polymerization of actin filaments occur near the cell’s membrane pushing the membrane outward, forming the protrusion and driving the filopodia growth. In addition, many cross-linking proteins bundle the parallel actin filaments together, increasing their mechanical stability [40]. Stochastic simulations based on the atomistic mechano-chemical nature of actin polymerization dynamics were extensively studied [41–44]. Also, several researchers have studied the role of cross-linking proteins on material properties of actin filament [45, 46]. To consider all the atomistic details of the polymerization process leading to filopodia formation along with the complete platelet structure although desirable, will impose restrictions on the computational domain size and simulation time scales [43]. Hence in our model, the filament bundles are coarse-grained as straight spring bundles before activation, and the spring bundles generate the classic spring force during filopodia formation. This numerical approximation of the filaments, while emulating the morphology at coarser scales than the atomistic scale, reflects the mechanical growth of filament bundles for forming filopodia.
Figure 2.
Schematic of the filamentous core connected to the membrane via filament bundles which are all represented by spring-connected particles. (a) Spring bond between filament bundle (FB) particles and membrane (MM). (b) Spring bond between filamentous core (FC) and filament bundle (FB) particles. The number of particles for individual model components is listed.
The cytoplasm [47] represents the inhomogeneous organelle zone and is characterized by a swarm of homogeneous particles that interact with each other through basic force laws. The cytoplasm particles are used to represent the gel-like behavior of the organelle zone and thus, help in preserving the shape of the platelet in quiescent state and during filopodia formation.
2.2. The Force Field
A representative reduced molecular-scale force field[48] is used to describe the interaction between the particles of platelet model components. It includes the bonded (bonds and angles) and the non-bonded (Lennard-Jones (L-J) potential) interactions and is given by:
| (1) |
where, VB(r) = kb(r−r0)2, Vθ(θ) = kθ(θ−θ0)2, . V is the total energy of a particle. VB(r) and Vθ(θ) are the bond and angle potentials, kb and kθ are the spring and angle force constants, r0 and θ0 are the equilibrium distance and angle. ULJ(r) is the nonbonded L-J potential, ε is the depth of the potential well and σ is the finite distance at which the inter-particle potential vanishes. r is the position of the particle in 3D and θ is the angle between three connected particles.
2.2.1. Filamentous Core
The bond energy between two adjacent filamentous core particles is given by , where kfc = 105 kcal mol−1A−2 and rfc = 107.5 A. rfc is the equilibrium distance between two adjacent filamentous core particles and its value is chosen to provide considerable computational speedup while retaining suitable fine discretization of the filamentous core network. kfc value is chosen in order to achieve the increased rigidity in the filamentous core. As a result, filament bundles that rest on the filamentous core grow radially outward during filopodia formation, instead of pushing down on it. The angle energy of a triplet of filamentous core particles is given by , where kfcθ =109 kcal mol−1rad−2 and θfc = 180°. This high angle energy ensures the filamentous core rigidity and provides resistance to bending when the forces from the filament bundle’s extension push down on it. εfc = 1 kcal mol−1 is chosen to be similar to the cytoplasm εcy to keep the non-bonded interactions as uniform as possible. The σfc =190 A value is chosen to limit the non-bonded interaction between filamentous core particles.
2.2.2. Filament Bundles
The bond energy between two adjacent filament bundle particles is given by , where kfb = 50 kcal mol−1A−2 and rts,fb is a variable that is used to control the length of the filopod. The stiffness of actin filaments is in the range of 5.61 – 10.27 kcal mol−1A−2 as reported in [49, 50]. kfb =50 kcal mol−1A−2 ensures a stiffer filament bundle that is able to push the membrane during formation of filopodia. At timestep ts=0, r0,fb =50 A. The angle energy of a triplet of filament bundle particles is given by , where kfbθ =106 kcal mol−1rad−2 and θfb =180°. This angle energy ensures that the filament bundles have strong resistance to bending or buckling. The non-bonded interaction between the filament bundle and the membrane must have stronger repulsive forces so that the membrane can move and encompass the protruding filament bundle effectively. Hence, εfb =1000 kcal mol−1 is used to address this requirement [51]. σts,fb is a variable that is used to control the thickness of the filopod, where σ0,fb=90 A. In addition, following the previous works in [52–54], the excluded volume interaction between filament bundles is represented by the repulsive term in the non-bonded Lennard-Jones potential
2.2.3. Membrane and Cytoplasm
The bond energy between two adjacent membrane particles is given by , where kmm = 0.00005 kcal mol−1A−2 and rmm = 215A. rmm is the equilibrium distance between two membrane particles and is chosen to be 215A to describe a two-layer structure. It enables us to adapt the mechanobiological elasticity by adjusting the spring force constant kmm between membrane particles. We use the area-stretching method to estimate the Young’s modulus of the platelet membrane. The schematics of the experiment and the elastic response are illustrated in Fig. 3. The Young’s modulus of human platelets is (1.7±0.6)×103 dyne/cm2 as reported in Table 1 of [55]. For the kmm =0.00005 kcal mol−1A−2, the Young’s modulus of the particle-based CGMD platelet model is (1.46±0.02)× 103 dyne/cm2.
Figure 3.
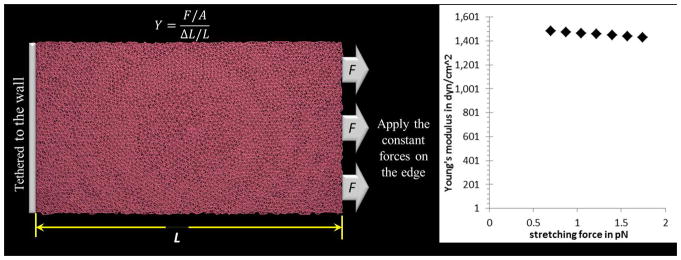
Schematic area-stretching experiment and the elastic response of the membrane (a) one edge of the membrane is tethered to a fixed wall and the other edge is pulled by a constant force. The Young’s modulus is estimated by Y=(F/A)/(ΔL/L) in which F is the force exerted on the membrane, A is the crosssection area through which the force is applied, ΔL is the amount by which the length of the membrane changes and L is the original length. (b) Using different stretching forces for assessing the Young’s modulus of the deformable membrane model with k_mm=0.00005 kcal mol^(−1) A^(−2).
The cytoplasm particles interact with only non-bonded interactions. The non-bonded L-J potential is given by . The L-J potential parameters of the membrane (εmm = 1 kcal mol−1, σmm = 400.0 A) and cytoplasm (εcy =1kcal mol−1, σcy = 400.0 A) are again chosen to be similar in order to keep the non-bonded interactions as uniform as possible. All of these values are tested in the results. The mass of each particle is uniformly chosen so as to achieve a total mass density of 1.07 g cm−3 which is an averaged desired density of a platelet [56].
2.3. Simulation Method
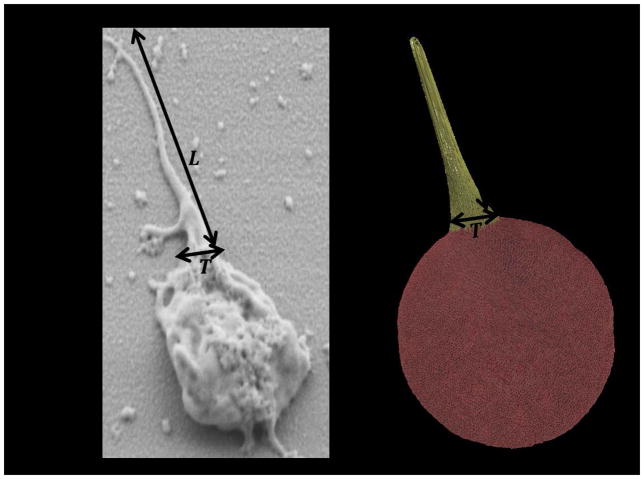
The dynamic simulation of the filopodia formation is achieved by incrementing two important model parameters: rts,fb and σts,fb. rts,fb and σts,fb are used to control the length(L) and the thickness(T) of filopod (Fig. 4), respectively. At simulation timestep ts = 0; represents a quiescent platelet. We vary rts,fb and σts,fb, such that for all tsi < tsj, rtsi,fb ≤ rtsj,fb and σtsi,fb ≤ σtsj,fb. At the end of simulation ts=tsmax; represents the filopod formation on the platelet. We vary rts,fb and σts,fb, such that at, max(rts,fb) = rtsmax,fb and max(σts,fb) = σtsmax,fb are attained at ts = tsmax. In this way, by gradually increasing rts,fb and σts,fb we can dynamically simulate longer and thicker filopod. These model parameters cannot be indefinitely extended, which may otherwise result in membrane tearing and leaking of the cytoplasm particles, thus disrupting the structural integrity of the platelet model. This specific limitation of the model can be rectified by reducing the degree of model coarsening by using a larger number of particles. The rest of the parameters remain constant during the simulation to preserve the structural integrity of the platelet during the formation of filopodia. The simulations are performed using a nanoscale molecular dynamics (NAMD) code designed for high performance simulations of large biomolecular systems [57]. The simulations for this particle-based system are conducted using the NVT ensemble at a steady temperature of 310K. The number of particles (N), volume (V) and temperature (T) is conserved and must be constant for the system. The number of particles is conserved by considering a periodic box around the platelet and the volume is kept constant throughout the simulation run. The temperature stabilization which is a difficult task in simulations is achieved by using Langevin Dynamics, which adjusts the integration of force fields, for temperature control [58]. Energy minimization is performed using the conjugate gradient method to stabilize the platelet model before simulating the platelet shape change. The integration timestep size used for the simulation is 200 fs.
Figure 4.
Definition of length (L) and thickness (T) of filopod in experiments and computer simulations.
The simulations are conducted to describe the impact of the model parameters (r ≜ r ts,fb , σ ≜ σ ts,fb) on the geometric measurements of the filopod (L, T- see In Vitro Experiments below), resulting in the numeric mapping correspondence between the parameters and the measurements. Accordingly, we construct an inverse mapping scheme in which the observed geometric measurements can be converted to the space of model parameters. After carefully studying several alternatives, we introduce the linear function fr between r and L and quadratic function fσ between σ and T:
| (2) |
| (3) |
α and β are two constants that can be determined for each filopod. r0 =50 A and σ0 =90 A. Lmax and Tmax are the maximum length and thickness achievable by each filopod. fσ is continuous at T=Tt. Depending on the coarsening level, σmax =160 A is the maximum value for σ beyond which the filament bundles are unstable. The change in the filopod length L is proportional to the increase in the distance between two filament bundle particles (r), thereby contributing to the linear relationship between the filopod length L and the model parameter r. Similarly, the change in the filopod cross-sectional area is proportional to the increase in the L-J potential parameter (σ) between two filament bundle particles, thereby contributing to the quadratic relationship between the filopod thickness T and the model parameter σ.
2.4. In Vitro Experiments
SEM images of platelets activated by exposure to flow-induced shear stresses were obtained and analyzed according to the following procedure: whole blood, 30 ml, was obtained via antecubital venipuncture from consenting healthy adult donors of both sexes as per Stony Brook University IRB-approved protocol and anticoagulated with 10% ACD-A. Gel-filtered platelets were prepared as previously described[59, 60] and diluted to a final count of 20,000/μl in HEPES-buffered modified Tyrodes solution (“platelet buffer”), with 3 mM Ca2+ added 10 min prior to experiments. The platelets were exposed to constant shear stresses of 1 dyne cm−2 or 70 dyne cm−2 for 4 min in the Hemodynamic Shearing Device (HSD), a programmable cone-plate-Couette dynamic viscometer that generates uniform shear stress conditions.[61] Platelet samples were withdrawn after 1 min and 4 min, and immediately fixed with 1% paraformaldehyde in platelet buffer. In addition, the buffer in which the platelets were suspended contains 0.1% bovine serum albumin to block adhesion to exposed surfaces. We conducted platelet counts before and after all experiments to ensure no platelet loss due to adhesion or lysis. Samples were placed on standard microscope slides pre-coated with poly-L-lysine (Sigma Aldrich, St. Louis, MO) for 2 hours at room temperature. Slides were gently washed twice with double-distilled H2O and subjected to an ethanol dehydration series (0%, 25%, 50%, 75%, and 100% EtOH, with 5 min per step). The slides were then sputter-coated with islanded gold particles (6 nm thick film) in an argon-filled vacuum chamber and imaged in an SEM microscope (LEO 1550) at a 30° angle and 30,000X magnification. The resulting images were analyzed using the MATLAB image processing toolbox. Geometrical measurements of major and minor axis lengths by curve fitting of an ellipse on the platelet boundaries. Filopod boundary coordinates were manually recorded. The distance between the coordinates of this boundary which intersected those of the platelet boundary define the filopod thickness, while a morphological erosion of the area defines the filopod central axis, and ultimately its length.
3. Results
3.1. Filopodia Formation
We have modeled the platelet to enable the dynamics of filopodia formation. We quantify this behavior by measuring the geometric features such as the length (L) and thickness (T) (Fig. 4) of the simulated filopodia. During the activation process, the actin filaments rearrange and grow radially outward pushing the membrane to form the filopod. This phenomenon is achieved in the model by dynamically increasing the model parameter rts,fb between the filament bundle particles, such that the protruding filament bundle that rests on the rigid filamentous core extends radially outward and deforms the membrane (Fig. 5a, top row). Simultaneously, the elastic model membrane moves to effectively encompass the protruding filament bundle. By tuning the L-J potential parameter εfb =1000 kcal mol−1, strong repulsion localized near the membrane and filament bundle connections is achieved, preventing the tearing of the membrane. The resultant membrane evolution at various timestep (ts) is depicted (Fig. 5a, bottom row). The top row in Fig. 5a shows the filamentous core, filament bundle and cytoplasm inside the platelet model at the various timestep (ts). As observed, the strong bonded forces between any two adjacent particles of the filamentous core preserved the rigid shape. Furthermore, the high angle force constant between filamentous core particles kfcθ ensured strong resistance to bending. Hence, during simulation of filopod formation the protruding filament bundle that rests on the filamentous core grew radially outward and did not push down on it. The repulsive L-J potential between the cytoplasm and membrane guaranteed that no cytoplasm particles escape outside the membrane. Also, the L-J potential between cytoplasm particles ensured the gel-like behavior of the cytoplasm inside the platelet model is preserved.
Figure 5.
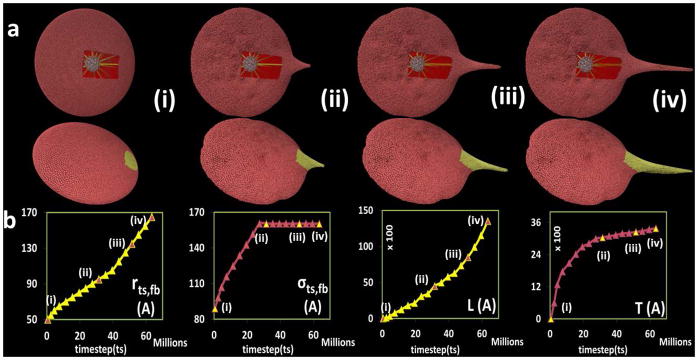
Evolving filopod formation of the platelet model. (a) The first row shows the filamentous core (white), filament bundles (yellow) and cytoplasm (red) components inside the platelet; second row is the complete platelet membrane. (b) Plot for model parameters r_(ts,fb),σ_(ts,fb) and output measurements of filopod L,T with respect to timestep ts in the simulation. The Y-axis units are Angstroms, X-axis units are number of simulation steps.
By dynamically changing rts,fb over the course of the simulation (Fig. 5b, first plot), we were able to control the length (L) of the filopod (Fig. 5b, third plot). Additionally, by dynamically changing the L-J potential parameter between two adjacent particles of the protruding filament bundle σts,fb (Fig. 5b, second plot) the thickness (T) of the filopod was controlled (Fig. 5b, fourth plot). The sequence in Fig. 5a(i)–(iv) demonstrates the effects on the shape of the platelet during filopod formation which was achieved by incrementing the model parameters rts,fb and σts,fb, illustrating the time-dependent effects of altering these parameters.
With the discretized filamentous core, we have constructed 59 filament bundles. By choosing one or more out of the 59 possible filament bundles, a physiological-like multiple filopodia formation can be realized. The versatility of the model is demonstrated by simulating filopodia formation of varying lengths and thicknesses, as depicted in Fig. 6a. By equally varying the model parameters rts,fb and σts,fb in three adjacent filament bundles, a filopod of different geometric features, L and T was realized. As observed, the filopod formed in Fig. 6 is shorter in comparison with the filopod formed in Fig. 5b. This was achieved by reducing the value of the model parameter rts,fb (Fig. 6c, first plot) and the composition of particles representing the three filament bundles, resulting in an overall shorter filopod (Fig. 6c, third plot). Similarly, by equally changing the model parameter σts,fb (Fig. 6c, second plot) for these three filament bundles, a wider filopod (Fig. 6c, fourth plot) was produced. Collectively, the two representative cases in Fig. 5 and Fig. 6 show the variation and flexibility in simulating filopod characteristics - obtained by changing the model parameters rts,fb and σts,fb Supporting Movies S2 and S3 (supporting materials section) depict examples of two simulations of filopodia formation containing the dynamically changing model parameters rts,fb, σts,fb and L,T of the filopod, along with snapshots of the platelet model at different timesteps (ts).
Figure 6.
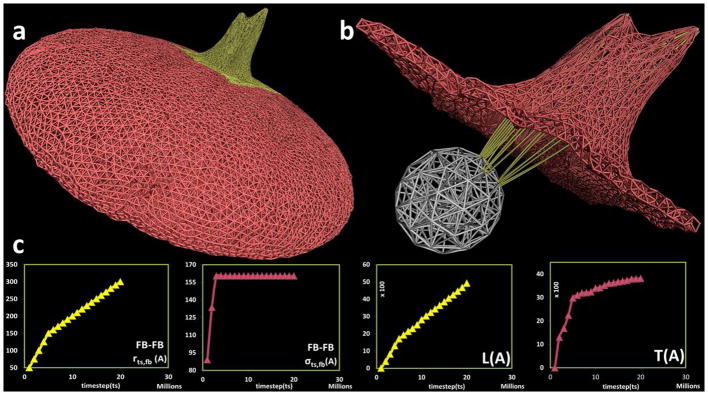
Filopod formation on the platelet model using three filament bundles in close proximity. (a) Complete platelet membrane after filopod formation with (b) filamentous core (white) and filament bundles (yellow) components inside the platelet. (c) Plot for model parameters r_(ts,fb),σ_(ts,fb) and output measurements of filopod L,T with respect to timestep ts in the simulation. The Y-axis units are Angstroms, X-axis units are number of simulation steps.
3.2. Model Parameterization
The inverse mapping scheme defined in Section 2.3. hypothesizes a linear relationship between the model parameter r and the filopod length L and a quadratic relationship between the model parameter σ and the filopod thickness T. Intuitively, the length of the filopod (L) is controlled by the distance between a pair of particles on the straight filament bundle (r) and hence a linear relationship is postulated. The cross-sectional area of filopod (proportional to T2) is controlled by the L-J potential parameter (σ) between two filament bundle particles. The coefficient of determination (R2) is proposed to measure the relationships between the thickness and model parameter. Fig. 7 shows the instantaneous lengths and thicknesses (shown in black) of the two representative cases describing the formation of a long filopod (Fig. 5) and a short filopod (Fig. 6), respectively. The plot of the linear function fr (Equation. 2) between the geometric measurement L and the model parameter r is derived (R2 >96%). Similarly, the plot of the quadratic function fσ (Equation. 3) between the geometric measurement T and the model parameter σ is derived (R2 >98%). Similarly, the plot of the quadratic function fσ (Equation. 3) between the geometric measurement T and the model parameter σ is derived (R2 >98%). The constants α and β are dependent on the coarse-graining level of filament bundles used to simulate the filopod formation. Thus, the constant α for both of the filopodia is determined by fitting a linear function fr as shown in Fig. 7a. Similarly, the constant β for both of the filopodia is determined by fitting a quadratic function fσ as shown in Fig. 7b. In this framework, depending on the model structure and the coarsening level, the constants α ∈ [0.95 * 10−2,5.26 * 10−2] and β ∈ [0.8 * 10−5,3.0 * 10−5]. This represents the physiologically possible range of filopodia formation patterns that can be simulated by this model, within the current limits of the membrane stability and structural integrity of the model. In Fig. 8, simulation snapshots of a medium sized filopod are shown. The linear function fr and fσ for this filopod are plotted in Fig. 7a and Fig. 7b (shown in red). The corresponding α and β values fall in the range shown above.
Figure 7.
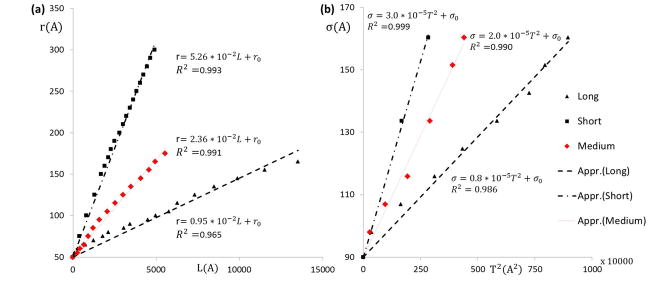
Correlation between model parameter space and experimental measurements. Plots for the (a) linear function f_r between the model parameter r and the observed geometric measurement L of the filopod. (b) Quadratic function f_σ between the model parameter σ and the observed geometric measurement T^2 of the filopod for the two representative cases in Fig. 5 and Fig. 6 (shown in black). Also the results for the filopod of medium length (shown in red) are plotted. The units of r,σ,L,T are in Angstroms.
Figure 8.

Complete platelet membrane after filopod formation using an intermediate filament bundle.
An extensive experimental database of platelet activation consisting of geometrical measurements of filopodia for different shear stress-exposure time combinations will expand this parameter space. With such data, one can use the framework established above that gives independent inverse mapping functions fr and fσ. Given a desired experimental measurement L for a filopod, the linear function fr will generate corresponding model parameter r. The maximum length of the filopod that can be simulated by the model is limited by the coarsening level and elasticity of the model membrane. Similarly, given a desired experimental measurement T, the quadratic function fσ will generate corresponding model parameter σ. With such a framework, we can simulate the dynamic growth of filopodia of desired lengths and thicknesses observed in platelets that are exposed to varying levels of shear stress-exposure time combinations.
3.3. Model Verification
In Fig. 9, three examples of the dynamic simulation results achieved by the end of the simulation time (corresponding to the experimental exposure time of the platelets to a prescribed level of shear stress), are compared to the geometric features of the measurements of filopodia formation (length and thickness) processed from SEM images of the exposed platelets. These images were obtained from the flow-induced shear stress experiments conducted using the HSD. While the simulations depict the dynamic formation of the filopodia, the comparisons are of snapshots from the dynamic simulations corresponding to the experimental endpoints.
Figure 9.
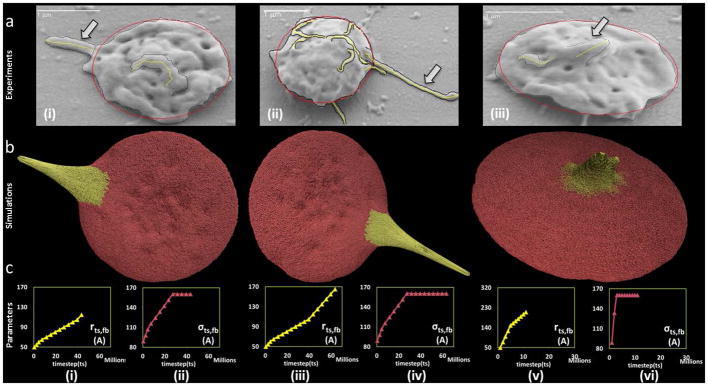
Visual comparisons of experimental and simulated filopod formation. (a) SEM images at (i) 1 dyne cm^-2 - 4 min (ii) 70 dyne cm^-2 - 4 min (iii) 70 dyne cm^-2 - 1 min. Tracings of the images in panel (a) illustrate the retained ellipsoidal shape of the platelet and filopod formation. The length (L) and thickness (T) are observed to be (i) 0.68 and 0.29 μm (ii) 1.39 and 0.35 μm and (iii) 0.29 and 0.32 μm, respectively. (b) Simulated filopod formation on model platelet (c-i to c-vi) The model parameters for the three simulations. The Y-axis units are Angstroms, X-axis units are number of simulation steps.
As shown in Supporting Data S1, when the platelets undergo shear stress (1 dyne cm−2 and 70 dyne cm−2) for exposure times (1 min and 4 min), they maintain the discoid shape and have filopodia extending from the membrane. Following the shear experiments the platelets were immediately fixed in 1% paraformaldehyde for at least 30 minutes prior to placing on poly-L-lysine coated slides for SEM studies, and it is not expected that the focal adhesions triggered any additional platelet shape change. Under the given pathological shear stress levels for extended periods of time, the filopodia length range from 0.24–2.74μm and thickness range from 0.06–0.73μm were observed. The SEM images of platelets exposed to (i) 1 dyne cm−2 - 4 min (ii) 70 dyne cm−2 - 4 min (iii) 70 dyne cm−2 - 1 min are shown in Fig. 9a. The snapshots of the platelet model during the simulation of the filopodia formation are shown in Fig. 9b. The images were compared visually with the SEM images from Fig. 9a. The model is able to simulate various filopodia formations and appear to be in complete agreement with the combination of experimental conditions of shear stress levels and exposure times in which the experiments were conducted. The evolution of the corresponding model parameters rts,fb, σts,fb is shown up to the corresponding timestep tsmax in Fig. 9c(i)–(vi). The comparison shows that while the model was not formulated to include the physiological growth mechanism of filopodia formation by actin polymerization, rather mimic the process, it successfully generated the dynamics of filopodial activity such as its initiation and extension.
3.4. Simulation Performance
Recent progress in modeling and utilization of computing methods on high-performance computing (HPC) resources [62] has put within reach the major challenges involved in large scale simulations. Our simulations used a cluster of 650 nodes in which each node contains two 3.06GHz Intel Xeon 6-core CPU and 36GB of memory and networked by Infiniband QDR. We measure the wall clock time (in seconds) for three representative simulation cases (long, medium and short filopod). We calculate the speed and speedups for varied numbers of processor cores. Speed of a simulation case using N processor cores S(N) is defined as the number of simulation timesteps per second. Speedup of the simulation on N processor cores is then given by S(1)/S(N). Fig. 10a and Fig. 10b show the speeds and speedups of the three simulations for different numbers of processor cores. The performance results showed that the maximum speedup can be up to 52 for the present problem size and then the speedup curve greatly reduces along with the increase of processors cores. This drop reaffirmed that the performance of a communication system is an important factor for a more efficient parallel computer [63] that can offer better scalability to applications[64].
Figure 10.
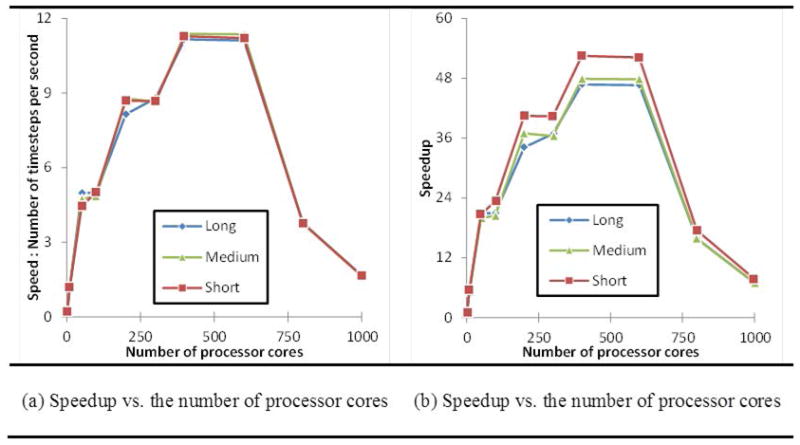
The scalability of the simulation of three representative cases (long, medium and short filopodia) measured by (a) Speed vs. Number of cores and (b) Speedup vs. Number of Cores.
4. Discussion and Conclusions
As suggested by experimental observations, filopodia formation plays an important role in early stages of platelet activation [27]. Limitations in establishing a quantifiable link from experimental data alone, has motivated us to design a simulation model that can represent the dynamics of filopodia formation and can be validated experimentally. However, there is a lack of a platelet model that can be used in simulations to study the effects of shear-flow and also can depict the induced dramatic platelet shape change. As a first step, this work presents a computationally feasible and deformable 3D CGMD particle-based model. The model characterizes the phenomenological functions of each platelet zone. The inter-particle interactions are formulated by a reduced force field. This model can simulate a platelet in its quiescent state and enable the dynamic filopodia formation observed during early stages of platelet activation.
Some significant platelet activation features were achieved by our model, after overcoming several modeling and computational challenges. A major challenge that was overcome by our model was to maintain the integrity of the various components representing the platelet while it undergoes dramatic shape changes during the dynamic filopodia formation process. By presenting the intra-platelet structures with particles interacting with effective potentials, the number of degrees of freedom was reduced, allowing us to run and complete CGMD simulations on large parallelized simulation mainframes within days. By developing a comprehensive parameter system conditions, we were able to carry out these coarse-grained simulations with considerable computational speedup.
This model also provides a framework for regulating filopodia dynamics utilizing a minimal set of adjustable model parameters (rts,fb and σts,fb). By choosing one or more out of 59 possible filament bundles, dramatically different realizations of platelet shape change can be accomplished by the model. Furthermore, with the inverse mapping function between the model parameters and the desired geometrical measurements of a filopodia, various platelet shape changes can be investigated within the parameter space. Under such parametric space, the model successfully simulated the dynamics of filopodia growth, as shown in Fig. 9, and is compared with experimental measurements of the shear-induced filopodia formation and growth. Filopodia formation in platelets during activation has been previously studied in response to biochemical triggering in non-flowing suspensions [65], when flowing over immobilized Von Willebrand Factor under high shear conditions [66, 67], or directly exposing platelets to high shear stress only [27]. However, to the best of our knowledge their formation has never been dynamically monitored during the actual extrusion process. Similarly, the comparisons between our dynamic formation simulations and the experimental measurements presented herein were conducted by the end of the experiment- when platelet samples were removed from the HSD and examined with SEM.
In summary, this work presents a 3D CGMD particle-based model of a quiescent platelet designed to simulate the dynamic filopodia formation upon its activation. The model provides a compact parameter set that can be flexibly adjusted to illustrate the filopodia formation dynamics. The model’s capability of characterizing diverse platelet shape changes is achieved by introducing variability in choosing one or more combinations of the filament bundles used to simulate the formation of filopodia of different lengths and thicknesses. The function that maps the model parameters to observed geometric measurements in platelets was established by analyzing the numerical trends, enabling the use of formulae for simulating filopodia of varied lengths and thicknesses within the parameter space of our model. The visual realizations of the simulated filopodia formations were further compared with experimentally measured geometric features of flow-induced activated platelets. The model, along with experimental investigation, establishes a novel dynamic framework for exploring the underlying mechanism of filopodia formation and their quantitative contribution to platelet shape change. By incorporating additional key features of the molecular processes and the extra-cellular environment (blood flow, wall interaction, etc.), our model may be extended to gain a complete mechanistic description of filopodia formation and platelet shape change during activation.
Supplementary Material
Acknowledgments
This publication was made possible by Grants from the National Institutes of Health NHLBI R21 HL096930 (DB) and NIBIB Quantum Award Implementation Phase II-1U01EB012487-0, (DB). The simulations of this study used New York/Blue L at New York Center for Computational Sciences in Brookhaven National Laboratory and Sunway BlueLight MPP system at National Supercomputing Center in Jinan, China.
References
- 1.Becker RC. Anticoagulation and the heart. Journal of thrombosis and thrombolysis. 2001;12(1):41–52. doi: 10.1023/a:1012786410881. [DOI] [PubMed] [Google Scholar]
- 2.Bluestein D, et al. Flow-induced platelet activation in mechanical heart valves. The Journal of heart valve disease. 2004;13(3):501–8. [PubMed] [Google Scholar]
- 3.Goldstein DJ. Worldwide experience with the MicroMed DeBakey ventricular assist device (R) as a bridge to transplantation. Circulation. 2003;108(10):272–277. doi: 10.1161/01.cir.0000087387.02218.7e. [DOI] [PubMed] [Google Scholar]
- 4.Feng R, et al. Viscous flow simulation in a stenosis model using discrete particle dynamics: a comparison between DPD and CFD. Biomechanics and modeling in mechanobiology. 2012;11(1–2):119–29. doi: 10.1007/s10237-011-0297-z. [DOI] [PubMed] [Google Scholar]
- 5.Baumgartner HR. The role of blood flow in platelet adhesion, fibrin deposition, and formation of mural thrombi. Microvascular Research. 1973;5(2):167–79. doi: 10.1016/0026-2862(73)90069-1. [DOI] [PubMed] [Google Scholar]
- 6.Fogelson AL. A Mathematical-Model and Numerical-Method for Studying Platelet-Adhesion and Aggregation during Blood-Clotting. Journal of Computational Physics. 1984;56(1):111–134. [Google Scholar]
- 7.Wang NT, Fogelson AL. Computational methods for continuum models of platelet aggregation. Journal of Computational Physics. 1999;151(2):649–675. [Google Scholar]
- 8.Kamada H, et al. A three-dimensional particle simulation of the formation and collapse of a primary thrombus. International Journal for Numerical Methods in Biomedical Engineering. 2010;26(3–4):488–500. [Google Scholar]
- 9.Huang PY, Hellums JD. Aggregation and Disaggregation Kinetics of Human Blood-Platelets .1. Development and Validation of a Population Balance Method. Biophysical Journal. 1993;65(1):334–343. doi: 10.1016/S0006-3495(93)81078-6. [DOI] [PMC free article] [PubMed] [Google Scholar]
- 10.Tandon P, Diamond SL. Hydrodynamic effects and receptor interactions of platelets and their aggregates in linear shear flow. Biophysical Journal. 1997;73(5):2819–2835. doi: 10.1016/S0006-3495(97)78311-5. [DOI] [PMC free article] [PubMed] [Google Scholar]
- 11.Maul C, et al. Sedimentation of Hexagonal Flakes in a Half-Space - Numerical Predictions and Experiments in Stokes-Flow. Journal of Imaging Science and Technology. 1994;38(3):241–248. [Google Scholar]
- 12.Mody NA, et al. Mechanics of transient platelet adhesion to von Willebrand factor under flow. Biophysical Journal. 2005;88(2):1432–1443. doi: 10.1529/biophysj.104.047001. [DOI] [PMC free article] [PubMed] [Google Scholar]
- 13.Crowl LM, Fogelson AL. Computational model of whole blood exhibiting lateral platelet motion induced by red blood cells. International Journal for Numerical Methods in Biomedical Engineering. 2010;26(3–4):471–487. doi: 10.1002/cnm.1274. [DOI] [PMC free article] [PubMed] [Google Scholar]
- 14.Pozrikidis C. Flipping of an adherent blood platelet over a substrate. Journal of Fluid Mechanics. 2006;568:161–172. [Google Scholar]
- 15.Mody NA, King MR. Platelet adhesive dynamics. Part I: Characterization of platelet hydrodynamic collisions and wall effects. Biophysical Journal. 2008;95(5):2539–2555. doi: 10.1529/biophysj.107.127670. [DOI] [PMC free article] [PubMed] [Google Scholar]
- 16.Wang WW, Mody NA, King MR. Multiscale model of platelet translocation and collision. Journal of Computational Physics. 2013;244:223–235. doi: 10.1016/j.jcp.2012.08.014. [DOI] [PMC free article] [PubMed] [Google Scholar]
- 17.Sweet CR, et al. Modelling platelet-blood flow interaction using the subcellular element Langevin method. Journal of Royal Society Interface. 2011;8(65):1760–71. doi: 10.1098/rsif.2011.0180. [DOI] [PMC free article] [PubMed] [Google Scholar]
- 18.Frojmovic M, Longmire K, Vandeven TGM. Long-Range Interactions in Mammalian Platelet-Aggregation .2. The Role of Platelet Pseudopod Number and Length. Biophysical Journal. 1990;58(2):309–318. doi: 10.1016/S0006-3495(90)82378-X. [DOI] [PMC free article] [PubMed] [Google Scholar]
- 19.Hensler ME, et al. Platelet Morphological-Changes and Fibrinogen Receptor Localization - Initial Responses in Adp-Activated Human Platelets. American Journal of Pathology. 1992;141(3):707–719. [PMC free article] [PubMed] [Google Scholar]
- 20.Kuwahara M, et al. Platelet shape changes and adhesion under high shear flow. Arteriosclerosis Thrombosis and Vascular Biology. 2002;22(2):329–334. doi: 10.1161/hq0202.104122. [DOI] [PubMed] [Google Scholar]
- 21.Lee D, et al. Differential Dynamics of Platelet Contact and Spreading. Biophysical Journal. 2012;102(3):472–482. doi: 10.1016/j.bpj.2011.10.056. [DOI] [PMC free article] [PubMed] [Google Scholar]
- 22.Posch S, et al. Activation induced morphological changes and integrin alpha IIb beta 3 activity of living platelets. Methods. 2013;60(2):179–185. doi: 10.1016/j.ymeth.2013.03.034. [DOI] [PMC free article] [PubMed] [Google Scholar]
- 23.Kraus MJ, Strasser EF, Eckstein R. A New Method for Measuring the Dynamic Shape Change of Platelets. Transfusion Medicine and Hemotherapy. 2010;37(5):306–310. doi: 10.1159/000320723. [DOI] [PMC free article] [PubMed] [Google Scholar]
- 24.Dror RO, et al. Biomolecular Simulation: A Computational Microscope for Molecular Biology. Annual Review of Biophysics. 2012;41:429–452. doi: 10.1146/annurev-biophys-042910-155245. [DOI] [PubMed] [Google Scholar]
- 25.Riniker S, Allison JR, van Gunsteren WF. On developing coarse-grained models for biomolecular simulation: a review. Physical Chemistry Chemical Physics. 2012;14(36):12423–12430. doi: 10.1039/c2cp40934h. [DOI] [PubMed] [Google Scholar]
- 26.Yamaoka H, et al. Multiscale modeling and mechanics of filamentous actin cytoskeleton. Biomechanics and Modeling in Mechanobiology. 2012;11(3–4):291–302. doi: 10.1007/s10237-011-0317-z. [DOI] [PubMed] [Google Scholar]
- 27.Ajzenberg N, et al. Platelet shape change and subsequent glycoprotein redistribution in human stenosed arteries. Platelets. 2005;16(1):13–8. doi: 10.1080/0953710042000267716. [DOI] [PubMed] [Google Scholar]
- 28.White JG. Platelet structure. Platelets. 2007:2. [Google Scholar]
- 29.Hartwig JH, Desisto M. The Cytoskeleton of the Resting Human Blood-Platelet - Structure of the Membrane Skeleton and Its Attachment to Actin-Filaments. Journal of Cell Biology. 1991;112(3):407–425. doi: 10.1083/jcb.112.3.407. [DOI] [PMC free article] [PubMed] [Google Scholar]
- 30.Hartwig JH. Mechanisms of Actin Rearrangements Mediating Platelet Activation. Journal of Cell Biology. 1992;118(6):1421–1442. doi: 10.1083/jcb.118.6.1421. [DOI] [PMC free article] [PubMed] [Google Scholar]
- 31.Hartwig JH. The platelet: Form and function. Seminars in Hematology. 2006;43(1):S94–S100. doi: 10.1053/j.seminhematol.2005.11.004. [DOI] [PubMed] [Google Scholar]
- 32.Ujihara Y, et al. Proposed Spring Network Cell Model Based on a Minimum Energy Concept. Annals of Biomedical Engineering. 2010;38(4):1530–1538. doi: 10.1007/s10439-010-9930-8. [DOI] [PubMed] [Google Scholar]
- 33.Dzwinel W, Boryczko K, Yuen DA. A discrete-particle model of blood dynamics in capillary vessels. Journal of Colloid and Interface Science. 2003;258(1):163–173. doi: 10.1016/s0021-9797(02)00075-9. [DOI] [PubMed] [Google Scholar]
- 34.Fedosov DA, Caswell B, Karniadakis GE. A Multiscale Red Blood Cell Model with Accurate Mechanics, Rheology, and Dynamics. Biophysical Journal. 2010;98(10):2215–2225. doi: 10.1016/j.bpj.2010.02.002. [DOI] [PMC free article] [PubMed] [Google Scholar]
- 35.Noguchi H, Gompper G. Shape transitions of fluid vesicles and red blood cells in capillary flows. Proceedings of the National Academy of Sciences of the United States of America. 2005;102(40):14159–14164. doi: 10.1073/pnas.0504243102. [DOI] [PMC free article] [PubMed] [Google Scholar]
- 36.Pivkin IV, Karniadakis GE. Accurate coarse-grained modeling of red blood cells. Physical Review Letters. 2008;101(11) doi: 10.1103/PhysRevLett.101.118105. [DOI] [PubMed] [Google Scholar]
- 37.Discher DE, Boal DH, Boey SK. Simulations of the erythrocyte cytoskeleton at large deformation. II. Micropipette aspiration. Biophysical Journal. 1998;75(3):1584–1597. doi: 10.1016/S0006-3495(98)74076-7. [DOI] [PMC free article] [PubMed] [Google Scholar]
- 38.Persson PO, Strang G. A simple mesh generator in MATLAB. Siam Review. 2004;46(2):329–345. [Google Scholar]
- 39.Mogilner A, Rubinstein B. The physics of filopodial protrusion. Biophysical Journal. 2005;89(2):782–795. doi: 10.1529/biophysj.104.056515. [DOI] [PMC free article] [PubMed] [Google Scholar]
- 40.Schirenbeck A, et al. The bundling activity of vasodilator-stimulated phosphoprotein is required for filopodium formation. Proceedings of the National Academy of Sciences of the United States of America. 2006;103(20):7694–7699. doi: 10.1073/pnas.0511243103. [DOI] [PMC free article] [PubMed] [Google Scholar]
- 41.Lan YH, Papoian GA. The stochastic dynamics of filopodial growth. Biophysical Journal. 2008;94(10):3839–3852. doi: 10.1529/biophysj.107.123778. [DOI] [PMC free article] [PubMed] [Google Scholar]
- 42.Zhuravlev PI, Papoian GA. Molecular noise of capping protein binding induces macroscopic instability in filopodial dynamics. Proceedings of the National Academy of Sciences of the United States of America. 2009;106(28):11570–11575. doi: 10.1073/pnas.0812746106. [DOI] [PMC free article] [PubMed] [Google Scholar]
- 43.Kim T, Hwang W, Kamm RD. Computational Analysis of a Cross-linked Actin-like Network. Experimental Mechanics. 2009;49(1):91–104. [Google Scholar]
- 44.Gardel ML, et al. Elastic Behavior of cross-linked and bundled actin networks. Science. 2004;304(5675):1301–1305. doi: 10.1126/science.1095087. [DOI] [PubMed] [Google Scholar]
- 45.Takatsuki H, Bengtsson E, Mansson A. Persistence length of fascin-cross-linked actin filament bundles in solution and the in vitro motility assay. Biochimica Et Biophysica Acta-General Subjects. 2014;1840(6):1933–1942. doi: 10.1016/j.bbagen.2014.01.012. [DOI] [PubMed] [Google Scholar]
- 46.Claessens MM, et al. Actin-binding proteins sensitively mediate F-actin bundle stiffness. Nat Mater. 2006;5(9):748–53. doi: 10.1038/nmat1718. [DOI] [PubMed] [Google Scholar]
- 47.Hosseini SM, Feng JJ. A particle-based model for the transport of erythrocytes in capillaries. Chemical Engineering Science. 2009;64(22):4488–4497. [Google Scholar]
- 48.Allen MP, Tildesley DJ. Computer simulation of liquids. Clarendon Press; 1989. p. 385. [Google Scholar]
- 49.Kojima H, Ishijima A, Yanagida T. Direct Measurement of Stiffness of Single Actin-Filaments with and without Tropomyosin by in-Vitro Nanomanipulation. Proceedings of the National Academy of Sciences of the United States of America. 1994;91(26):12962–12966. doi: 10.1073/pnas.91.26.12962. [DOI] [PMC free article] [PubMed] [Google Scholar]
- 50.Higuchi H, Yanagida T, Goldman YE. Compliance of Thin-Filaments in Skinned Fibers of Rabbit Skeletal-Muscle. Biophysical Journal. 1995;69(3):1000–1010. doi: 10.1016/S0006-3495(95)79975-1. [DOI] [PMC free article] [PubMed] [Google Scholar]
- 51.Bertaud J, Qin Z, Buehler MJ. Intermediate filament-deficient cells are mechanically softer at large deformation: a multi-scale simulation study. Acta biomaterialia. 2010;6(7):2457–66. doi: 10.1016/j.actbio.2010.01.028. [DOI] [PubMed] [Google Scholar]
- 52.Nikunen P, Karttunen M, Vattulainen I. How would you integrate the equations of motion in dissipative particle dynamics simulations? Computer Physics Communications. 2003;153(3):407–423. [Google Scholar]
- 53.Ciesla M, Pawlowicz J, Longa L. Molecular dynamics simulation of the lennard-jones polymers in a good solvent. Acta Physica Polonica B. 2007;38(5):1727–1736. [Google Scholar]
- 54.Schmidt RR, Cifre JGH, de la Torre JG. Comparison of Brownian dynamics algorithms with hydrodynamic interaction. Journal of Chemical Physics. 2011;135(8) doi: 10.1063/1.3626868. [DOI] [PubMed] [Google Scholar]
- 55.Haga JH, et al. Quantification of the passive mechanical properties of the resting platelet. Annals of biomedical engineering. 1998;26(2):268–77. doi: 10.1114/1.118. [DOI] [PubMed] [Google Scholar]
- 56.Bolin RB, et al. Buoyant Density of Platelets Stored at Room-Temperature as Platelet Concentrates. Journal of Laboratory and Clinical Medicine. 1981;98(3):342–351. [PubMed] [Google Scholar]
- 57.Phillips JC, et al. Scalable molecular dynamics with NAMD. Journal of Computational Chemistry. 2005;26(16):1781–1802. doi: 10.1002/jcc.20289. [DOI] [PMC free article] [PubMed] [Google Scholar]
- 58.Plimpton S, Thompson A, Crozier P. LAMMPS Molecular Dynamics Simulator. 2012 Available from: http://lammps.sandia.gov.
- 59.Jesty J, Bluestein D. Acetylated prothrombin as a substrate in the measurement of the procoagulant activity of platelets: elimination of the feedback activation of platelets by thrombin. Analytical Biochemistry. 1999;272(1):64–70. doi: 10.1006/abio.1999.4148. [DOI] [PubMed] [Google Scholar]
- 60.Schulz-Heik K, et al. The extent of platelet activation under shear depends on platelet count: Differential expression of anionic phospholipid and factor Va. Pathophysiology of Haemostasis and Thrombosis. 2005;34(6):255–262. doi: 10.1159/000093104. [DOI] [PubMed] [Google Scholar]
- 61.Sheriff J, et al. High-Shear Stress Sensitizes Platelets to Subsequent Low-Shear Conditions. Annals of biomedical engineering. 2010;38(4):1442–1450. doi: 10.1007/s10439-010-9936-2. [DOI] [PMC free article] [PubMed] [Google Scholar]
- 62.Deng Y, et al. Analysis of Linpack and power efficiencies of the world’s TOP500 supercomputers. Parallel Computing. 2013;39(6–7):271–279. [Google Scholar]
- 63.Zhang P, Powell R, Deng YF. Interlacing Bypass Rings to Torus Networks for More Efficient Networks. IEEE Transactions on Parallel and Distributed Systems. 2011;22(2):287–295. [Google Scholar]
- 64.Zhang P, et al. Evaluation of Various Networks Configurated by Adding Bypass or Torus Links. IEEE Transactions on Parallel and Distributed Systems. 2014;(99):1–1. [Google Scholar]
- 65.Frojmovic MM, Milton JG. Human-Platelet Size, Shape, and Related Functions in Health and Disease. Physiological Reviews. 1982;62(1):185–261. doi: 10.1152/physrev.1982.62.1.185. [DOI] [PubMed] [Google Scholar]
- 66.Kuwahara M, et al. Platelet shape changes and adhesion under high shear flow. Arterioscler Thromb Vasc Biol. 2002;22(2):329–334. doi: 10.1161/hq0202.104122. [DOI] [PubMed] [Google Scholar]
- 67.Andre P, et al. Platelets adhere to and translocate on von Willebrand factor presented by endothelium in simulated veins. Blood. 2000;96(10):3322–3328. [PubMed] [Google Scholar]
Associated Data
This section collects any data citations, data availability statements, or supplementary materials included in this article.


