

Abstract
The neuropeptide vasoactive intestinal peptide is expressed at high levels in a subset of neurons in ventral region of the suprachiasmatic nucleus (SCN). While VIP is known to be important for the synchronization of the SCN network, the role of VIP in photic regulation of the circadian system has received less attention. In the present study, we found that the light-evoked increase in electrical activity in vivo was unaltered by the loss of VIP. In the absence of VIP, the ventral SCN still exhibited NMDA-evoked responses in a brain slice preparation although the absolute levels of neural activity before and after treatment were significantly reduced. Next, we used calcium imaging techniques to determine if the loss of VIP altered the calcium influx due to retinohypothalamic tract stimulation. The magnitude of the evoked calcium influx was not reduced in the ventral SCN but did decline in the dorsal SCN regions. We examined the time course of the photic induction of Period1 in the SCN using in situ hybridization in VIP-mutant mice. We found that the initial induction of Period1 was not reduced by the loss of this signaling peptide. However, the sustained increase in Period1 expression (after 30 min) was significantly reduced. Similar results were found by measuring the light-induction of cFOS in the SCN. These findings suggest that VIP is critical for longer term changes within the SCN circuit but does not play a role in the acute light response.
Keywords: calcium, cFOS, circadian, mouse, NMDA, Period1, suprachiasmatic nucleus, SCN, VIP
Introduction
Daily biological rhythms are intrinsically generated, synchronized, and regulated by networks of circadian oscillators. These oscillations are generated by robust negative feedback mechanisms that occur at the molecular, cytoplasmic, and membrane levels within single cells (Mohawk et al., 2012; O’Neill et al., 2013). In mammals, the suprachiasmatic nucleus (SCN) of the hypothalamus contains the master oscillatory neurons necessary for coordinating these rhythms throughout the body (Dibner et al. 2010; Welsh et al. 2010). These SCN pacemaker neurons receive and integrate timing cues such as daylight and food availability to adjust their rhythmic output (Challet et al., 2003). The SCN is divided into core and shell regions (Abrahamson and Moore 2001): the dorsally-situated shell region contains the majority of the endogenously oscillating neurons in the nucleus, and the ventral core region receives afferent sensory signals (Yan et al., 2007).
Light is the most powerful environmental cue to which circadian rhythms synchronize (Czeisler et al., 1981; Khalsa et al., 2003). Photic cues are detected by specialized intrinsically photosensitive retinal ganglion cells (ipRGCs) containing the photopigment melanopsin (Lucus et al., 2012). The axons of ipRGCs form the retinohypothalamic tract (RHT) which terminates on the ventral aspect of the SCN (Morin and Allen, 2006). RHT terminals release glutamate and, under certain conditions, the neuropeptide PACAP (Hannibal et al., 2008) with the result of photic stimulation being the increase in firing rate of SCN neurons (Meijer et al., 1998; Shibata et al., 1984). In SCN neurons, N-methyl-D-aspartic acid (NMDA) receptor activation and increases in intracellular calcium (Ca2+; Irwin and Allen, 2007; Colwell, 2011) play a special role in mediating the effects of RHT activity. The influx of Ca2+ in retinally-innervated SCN neurons triggers a number of signal transduction pathways that promote the transcription of a set of genes through cyclic AMP-responsive element (CRE)-binding protein (CREB) phosphorylation including the clock gene Per1 (Travnickova-Bendova et al., 2002; Yan and Silver, 2004) and the immediate early gene cFOS (Kornhauser et al., 2006). These molecular light-evoked changes in gene expression are thought to be necessary to cause light-induced phase shifts in physiology and behavior (Albrecht, 2012).
Although the detailed mechanisms by which the SCN circuit operates remains unknown, a major role for vasoactive intestinal peptide (VIP) in photic resetting is indicated. Behaviorally, VIP-deficient mice show clear deficits in their circadian light response (Colwell et al., 2003) and our hypothesis was that the light-evoked changes in SCN physiology would also be compromised. Therefore, in the present study, we first examined the SCN response to light in vivo using MUA recordings of freely-moving VIP KO mice and littermate wild-type (WT) controls. We then measured NMDA-evoked responses in ventral SCN neurons in a brain slice preparation of both genotypes. Next, Fura2 calcium imaging techniques were used to measure the calcium transients evoked by electrical stimulation of the RHT in vitro. Digoxigenin in situ hybridization (ISH) was used to follow the light-induction of Per1 message in the SCN of both genotypes. Light induction of cFOS in the SCN was examined with immunohistochemical (IHC) techniques.
Materials and Methods
Animals
Experimental protocols used in this study were approved by the University of California, Los Angeles or Leiden University Animal Research Committee. Recommendations for animal use and welfare, as dictated by the UCLA Division of Laboratory Animals and the guidelines from the National Institutes of Health, were followed. Adult male (1.5–5 months) WT C57Bl/6 mice and mice lacking the gene encoding for the neuropeptides VIP (VIP KO) (Colwell et al., 2003) were obtained from a breeding facility at the University of California, Los Angeles or from the breeding facility at Leiden University. Mice were group housed until they were used for experiments. Total of 102 C57 mice were used with half being the VIP KO.
In vivo SCN recordings
Mice were implanted with a tripolar stainless steel micro electrode (Plastics One, Roanoke, VA USA) using a stereotaxic instrument (Stoelting, Wood Dale, IL, USA) as previously described (Lucassen et al., 2012; van Diepen et al., 2013). Two polyimide-insulated and twisted electrodes were aimed at the SCN and a third uncoated electrode was placed in the cortex as a reference. Mice were anaesthetized using a mix of ketamine (100mg/kg), xylaxine (20mg/kg) and atropine (1mg/kg). The electrodes were implanted under a 5° angle at the same rostrocaudal level as bregma, 0.61 mm lateral to midline and 5.38 mm ventral to the dura mater. The electrode was fixed to the skull using three screws and dental cement. After a week of recovery animals were placed in a custom designed recording chamber to measure SCN electrical activity and behavioral activity using passive infrared sensors simultaneously. Animals were connected to the recording system using a counterbalanced swivel system in which they were able to freely move. The electrical signal was amplified and bandwidth filtered (0.5–5kHz). Window discriminators were used to convert action potentials into digital pulses that were counted in 2 sec epochs. Physiological responses were used to confirm electrode placement within the light-responsive part of the SCN.
Animals were recorded over at least two days in continuous darkness. After two days of continuous darkness animals were exposed to 5 minutes of light (fluorescent light source; 150 µW/cm2) at CT 14–16 (2–7 pulses). The animals received multiple 5-min pulses within the same day at this phase. The circadian time of the light response was calculated per day on the basis of the onset of behavioral activity recorded by a passive infrared sensor in the recording chamber. For quantification of the response, the increases in SCN electrical activity were compared to baseline levels. Baseline levels were defined as 50 sec before lights on and the level of sustained light-induced increase was defined as the average firing rate during lights on (>5 sec after light onset). At the end of each recording, animals were sacrificed and brain tissue was collected for histological verification of the electrode location. After brain fixation in a 4% paraformaldehyde solution containing ferrocyanide, brains were sectioned coronally and stained with cresyl violet. The position of the electrode was determined by microscopic inspection (S. Fig. 1). Electrodes outside the SCN were excluded from analysis.
Whole cell patch clamp electrophysiology
Mid-SCN coronal slices were collected with a vibratome in slice solution (in mM: 26 NaHCO3, 1.25 NaH2PO4, 10 glucose, 125 NaCl, 3 KCl, 5 MgCl2, 1 CaCl2) from Per2::luciferase (P2L) mice and VIP KO × P2L littermates between 1.5 and 3 months of age. Slices were attached to the stage of a fixed-stage upright DIC microscope (Olympus, Tokyo, Japan), and superfused continuously with aerated (95% O2/5%CO2) artificial cerebrospinal fluid (ACSF in mM: NaHCO3, 26; NaH2PO4, 1.25; glucose, 10; NaCl, 125; KCl, 3; MgCl2, 2; CaCl2, 2). Recording electrodes (4–8MΩ) were pulled from glass capillaries (WPI, Sarasota, FL) on a multistage puller (Sutter P97, Novato, CA, USA) and recording electrodes were filled with standard internal solution (in mM): K-gluconate, 112.5; EGTA, 1; Hepes, 10; MgATP, 5; GTP, 1; leupeptin, 0.1; phosphocreatine, 10; NaCl, 4; KCl, 17.5; CaCl2, 0.5; and MgCl2, 1. Recordings were obtained using the AXOPATCH 200B amplifier (Molecular Devices, Sunnyvale, CA, USA) and monitored on-line with pCLAMP (Ver. 10, Molecular Devices). Each cell was visualized to be within the SCN by means of DIC microscopy, ventral cells were adjacent to or in close proximity with the optic chiasm. After forming a high resistance seal (>1 GΩ) in voltage clamp configuration, a second pulse of negative pressure was used to break the membrane. Most cells had a capacitance between 6 and 15pF, and cells with access resistance higher than 60 MΩ or holding currents larger than −30 pA (at VHold = −70 mV) were excluded from additional analysis. Junction potential between the pipette and extracellular solution was cancelled by voltage offset of the amplifier before establishing a seal. All solutions’ pH was adjusted to 7.25–7.3 and osmolarity adjusted to 290–310 mOsm.
Spontaneous firing rates (SFR) were recorded using current-clamp mode in whole cell patch clamp configuration. After entering whole cell mode in voltage clamp and switching to current clamp mode, neuronal firing was allowed 3–5 min. to stabilize. Baseline SFR was then calculated using the number of action potentials detected over the subsequent 60 sec. N-methyl-D-aspartate (NMDA; 25µM) was then applied for 2–3 min., and SFR was calculated using the number of action potentials detected during the subsequent min. of NMDA treatment. Following NMDA treatment, ACSF was used to wash slices and determine whether cells were able to re-hyperpolarize following pharmacological excitation to insure only healthy cells were included in analysis. All recordings were made in presence of the GABAA receptor blocker gabazine (10µM; Tocris, Minneapolis, MN, USA). Chemicals were purchased from Sigma-Aldrich (St. Louis, MO, USA) unless otherwise noted.
In vitro Ca2+ imaging
Brain slices containing the SCN were collected as described above from animals 6–10 weeks of age and loaded with the ratiometric Ca2+ indicator dye fura-2-acetoxymethyl ester (Fura-2-AM, Teflabs, Austin, TX, USA) as previously described (Michel et al. 2013). The slices were prepared at ZT 11 and the recordings made between ZT 15 – 17. A monochromator (Polychrome V, TILL Photonics, Gräfeling, Germany) was used to deliver paired 50 ms light pulses of two excitation wavelengths (340 and 380 nM). Emitted light (505 nM) was detected by a cooled CCD camera (Sensicam, TILL Photonics), and images were acquired at 2 sec intervals (0.5 Hz). Single-wavelength images were background subtracted, and ratio images (340/380) generated. Cells were defined as ventral or dorsal based on proximity to the optic chiasm or third ventricle respectively (S. Fig. 2), and the mean ratio values for these region-of-interest-defined cells were used to calculate intracellular Ca2+ concentration. Experiments were conducted using imaging software TILLvisION (TILL Photonics).
For electrical stimulation of the RHT, a concentric bipolar electrode (125 µm/Rnd/ 25 µm Pt-Ir, purchased from FHC, Bowdoin, ME, USA) connected to a Grass S88 Stimulator (Warwick, RI, USA) was placed in the center of the optic chiasm of a coronal hypothalamic slice. The stimulation strength was adjusted to elicit clear Ca2+ transient with a fast recovery to baseline levels. The cells were stimulated at 10 Hz for one sec with pulse duration of 200 µs. This train of stimuli was repeated three times with a 60 sec pause between stimulations.
Data were collected and analyzed using Tillvision, Igor Pro (Wavemetrics, Portland, OR), Excel (Microsoft, Redmond, WA), and SPSS 20 (IBM, Armonk, NY). First, baseline Ca2+ concentration were examined using mean and SD of signal 14 seconds before each peak in every cell. Cells with a baseline intracellular Ca2+ concentration [Ca2+]i larger than 600 nM were excluded from the data set. Values that were greater than two SDs from the mean were identified as outliers by the SPSS software and excluded from the analysis.
Digoxigenin ISH
A plasmid (pCRII; Invitrogen, Carlsbad, CA, USA) containing the cDNA for Per1 (340– 761 nucleotides, accession number AF022992) was generously provided by Dr. D. Weaver (University of Massachusetts), and insert identity was confirmed by sequencing using the M13R primer. To generate antisense and sense templates for hybridization, plasmids were linearized overnight, phenol-chloroform extracted, ethanol precipitated and re-suspended in diethyl pyrocarbonate (DEPC)-treated water.
Digoxigenin-labeled riboprobes were generated from 1 µg of template cDNA in a reaction mixture containing 2 µl of 10X concentrated digoxigenin (DIG) RNA Labeling Mix (Roche Applied Science Indianapolis, IN, USA), 2 µl of 10X concentrated Transcription Buffer (Roche Applied Science, Indianapolis, IN, USA), 40 U Rnase Block (Stratagene, La Jolla, CA, USA), and 2 µl of the appropriate RNA transcriptase (SP6, or T7; Roche Applied Science, Indianapolis, IN, USA) for 2 hours at 37°C. The in vitro transcription reaction was terminated by the addition of 2 µl of 0.2 M EDTA and precipitated with 2.5 µl of 4 M LiCl and 100% ethanol overnight at −20°C. The precipitate was extracted with 70% ethanol and reconstituted in 100 µl of sterile water. Probe yield estimates were determined by comparison to known concentrations of untranscribed, linearized plasmid in gel electrophoresis and also from serial dilutions of cross-linked riboprobe spotted to nitrocellulose membranes, bound to alkaline phosphatase-conjugated anti-DIG antibody (Roche Applied Science, Indianapolis, IN, USA) and visualized with 4-Nitro blue tetrazolium (NBT) and 5-Bromo-4-chloro-3-indolyl phosphate (BCIP) (Roche Applied Science, Indianapolis, IN, USA).
Prior to brain collection, wheel running activity was measured as described previously (Loh et al., 2013). Male VIP-deficient mice were housed in cages containing running wheels (Mini Mitter Co., Bend, OR) from 6–7 weeks of age and their wheel-running activity recorded as revolutions (rev) per 3 min intervals. Animals were exposed to a 12:12 hr light-dark cycle (LD; light intensity 350 lux) for 10 days, and then released to 24 hr of constant darkness (DD) to assess their free-running activity pattern for 7–10 days. Animals were exposed to light (10 min, light intensity ≈ 50 lux) at circadian time (CT) 16 based on wheel running activity records (CT 12 was defined as activity onset) and sacrificed after either 30, 60, 90, or 120 min under anesthesia (n=3–5 in each condition). Control animals were culled at the same time without a light pulse. Brains were removed, flash-frozen, sectioned at 20 µM and slide mounted, then stored at −80°C until used for ISH or immunofluorescence.
On the first day of hybridization, slides were warmed to room temperature and fixed in 4% paraformaldehyde. Following brief washes in PBS, slides were placed in prehybridization buffer (50% formamide, 5X SSC, 1% SDS, 0.2% Tween-20, 0.1% heparin, and 50 ng/mL Torula RNA) at 60°C for 1 – 2 hours. Sections were then hybridized overnight at 60°C in hybridization buffer (50% formamide, 5X SSC, 1% SDS, 0.2% Tween-20, 0.1% heparin, and 50 ng/mL Torula RNA), and ≈ 50–100 pg/µL of riboprobe) in sealed slide mailers. Following hybridization, slides were washed briefly in 5X SSC and then for 1 hour in 0.2X SSC at 60°C to remove unbound probe. Slides were then briefly washed with maleic acid buffer (0.1M maleic acid, 0.15M NaCl) and blocked in 20% heat-treated sheep serum in maleic acid buffer. After blocking, slides were incubated with 1:500 anti-DIG antibody conjugated to alkaline phosphatase (Roche Applied Science, Indianapolis, IN, USA) in a humid chamber at 4°C overnight. After antibody incubation, slides were washed in maleic acid buffer and then in Tris buffer (0.1 M Tris (pH 9.5), 0.1 M NaCl, and 5 mM MgCl2). For revelation, slides were incubated in a color reaction solution (Tris buffer, 0.3375% NBT, 0.35% BCIP, 1mM levimasole) at room temperature overnight in a humid chamber. After revelation, slides were washed with PBS and color was preserved via a final incubation in 4% paraformaldehyde containing EDTA. Slides were then cover-slipped and imaged on a Zeiss microscope using Axiovision software (Carl Zeiss Inc., Thornwood, NY) for analysis. Sense probe hybridization showed no positive staining.
For quantification, SCN sections were imaged and SCN borders were determined by 4',6-Diamidino-2-Phenylindole, Dihydrochloride (DAPI) and arginine vasopressin (AVP) distribution dorsal to the optic chiasm in the anterior hypothalamus. For each SCN, a template was created to define core and shell subregions delineated by AVP expression (S. Fig. 3). This delineation was confirmed by additionally double immunostaining against AR to confirm that a lack of AVP signal coincided with the SCN core. Templates from adjacent sections were superimposed onto both Per1+ and c-FOS+ sections and the resulting mid-SCN image (unilateral) for each animal was counted by an experimenter blind to condition.
IHC
Brains were processed as described above, and alternate sections were used to delineate SCN subregions chemo-architecturally. Sections were fixed in 4% paraformaldehyde at room temperature, washed with PBS, and incubated in blocking solution (3% normal goat serum (NGS), 0.1% Triton X-100 in PBS). After blocking, sections were incubated with a guinea pig polyclonal antibody raised against arginine-vasopressin (AVP, 1:000; Bachem, Torrance, CA); a rabbit polyclonal antibody raised against FOS (1:30,000; Merck Millipore, Darmstadt, Germany); or a rabbit polyclonal antibody raised against androgen receptor (AR; 1:150; Santa Cruz Biotechnology, Santa Cruz, CA) in blocking solution at 4oC for 4 days. Sections were then washed and incubated with Alexa Fluor® 568-conjugated goat anti-guinea pig IgG antisera (Molecular Probes, Eugene, OR), diluted to 1:300 with blocking solution at room temperature. If tissue was processed for double immunostaining, primary antibody incubation was carried out with both the primary AVP antibody and a rabbit polyclonal antibody raised against androgen receptor (Santa Cruz Biotechnology, Santa Cruz, CA) diluted at 1:150. Also, during the secondary antibody incubation, Alexo Fluor® 488-conjugated secondary antisera (Molecular Probes, Eugene, OR), diluted at 1:200, was additionally used. After incubation with secondary antibody, sections were again washed with PBS, cover slipped with Vectashield Mounting Media containing DAPI (Vector Laboratories, Burlingame, CA), and stored in the dark at 4°C until imaged.
Statistical measurements
The data sets were analyzed for equal variance and normal distribution to help select the appropriate statistical test. Significance for electrophysiological recordings and Ca2+ imaging was assessed using a Student’s t-test as well as two-way analysis of variance (ANOVA), with genotype and light or NMDA exposure as factors. Paired Student’s t-tests were used to detect significant changes due to pharmacological treatment and unpaired Student’s t-tests were used to assess differences in spontaneous electrical activity due to genotype. Effects were reported to be significant if P < 0.05. For ISH, the data sets were analyzed by two-way ANOVA, with genotype and light exposure as factors. If significant group differences were detected (P < 0.05) by ANOVA, then the Holm–Sidak method for pair-wise multiple comparisons was used. For all tests, values were considered significantly different if P < 0.05. All tests were performed using Sigmastat software (version 3.5, Systat Software, San Jose, CA, USA). Values are shown as mean ± SEM.
Results
In vivo electrophysiology finds no deficits in light evoked responses in SCN of VIP mutants
Using in vivo extracellular recording techniques, SCN electrical activity was measured in both VIP KO (n=7) and WT controls (n=5). Physiological responses were used to confirm that the electrode was placed in a light-response region of the SCN and histological analysis confirmed that each of these recordings was made in the SCN. Successful recordings showed high SCN electrical activity during the day and low electrical activity during the night. Light exposure induced an increase in the SCN electrical discharge pattern with a transient overshoot at lights on and a sustained elevation in SCN electrical activity throughout light exposure (Fig. 1A). No differences in light response characteristics were detected between VIP KO and WT mice (KO: 12 ± 2 % change; WT: 16 ± 6 %; t-test: P > 0.05; Fig. 1B). Both genotypes showed a significant increase in SCN electrical activity upon light exposure during the night (CT 14–16) (Fig. 1C). Two-way ANOVA (DF =23) was also performed to test for genotype and treatment effects. Main effect of light treatment (F = 15.610, P = 0.003) was identified, but no effect of genotype (F = 0.299, P = 0.596) nor an interaction (F = 0.173, P = 0.687) was found. These results demonstrate that photic information is reaching the retino-recipient cells in the SCN in the VIP KO mice.
Fig. 1.

Light-evoked changes in multiunit activity (MUA) recorded from the SCN of freely moving mice. (A, B) Representative examples of MUA rhythms recorded from the SCN of a WT and VIP KO mouse during the night. Light pulses are indicated above the graphs. SCN firing rate is increased in both VIP KO and WT mice, with a response latency of 0.04 sec. Bin size is 0.01 sec. (C) bar graphs show mean and SEM of the MUA before and during light exposure. * indicates significant difference (P<0.05) compared to controls analyzed by two-way ANOVA followed by Holm-Sidak method for multiple comparisons. There were no differences between the two genotypes.
In vitro electrophysiology demonstrates reduced activity but robust NMDA-evoked changes in ventral SCN neurons
A variety of evidence suggests that the effects of light on the mammalian circadian system are mediated by glutamatergic mechanisms and that the NMDA receptor plays an important role in this regulation. Using the whole cell patch-clamp recording technique in current clamp mode, we measured the SFR in ventral SCN neurons in a brain slice preparation in response to bath application of NMDA (25µM, 3min). Each of these cells was determined to be within the ventral region of the SCN by directly visualizing the location of the cell as being immediately adjacent to or in close proximity with the optic chiasm using infrared DIC video microscopy. In WT mice, ventral SCN neurons responded to bath application of NMDA with an increase in SFR (Fig. 2, P < 0.001). The VIP KO also showed a significant response to NMDA treatment (P = 0.02), but there were differences between the genotypes. First, the absolute SFR was reduced in mutant SCN compared to WT in both baseline (WT: 1.76 ± 0.4 Hz vs. VIP KO: 0.48 ± 0.2 Hz, P = 0.03) and NMDA treatment conditions (WT: 4.11 ± 1.0 Hz vs. VIP KO: 1.44 ± 0.4 Hz, P = 0.04). Second, whereas all WT neurons (16/16) responded to NMDA treatment with increased firing rates, only 9 out of 13 mutant neurons did (Chi2 = 5.7; P = 0.008). Two-way ANOVA (DF =57) was also performed to test for genotype and treatment effects. Main effects of genotype (F = 9.59, P = 0.003) and NMDA treatment (F = 8.17, P = 0.006) were identified, but no interaction of genotype and treatment (F = 1.20, P = 0.279) was found. Thus, in the ventral SCN region, while the absolute levels of neural activity were reduced in VIP deficient mice, NMDA still evoked a significant change in firing of these neurons although the excitatory effects were less uniform than in WT.
Fig. 2.

Application of NMDA increased the firing rate of ventral SCN neurons during the night in vitro. (A) Representative examples illustrating the NMDA-induced increase in firing rate in a ventral SCN neuron from the VIP KO and WT control mice. (B) Bar graphs show average firing rate for each group (+ SEM). * indicates significant difference (P<0.05) compared to controls analyzed by two-way ANOVA followed by Holm-Sidak method for multiple comparisons. # indicates a significant difference between the two genotypes.
Ca2+ imaging indicates RHT stimulation normal in ventral SCN cell population but reveals deficits in dorsal SCN in VIP KO mice
Release of glutamate from RHT terminals in the SCN after electrical stimulation will lead to an increase in [Ca2+]i (Irwin & Allen, 2007) and ultimately phase shifts of the circadian system. Optical imaging techniques and the fura2-AM indicator dye were used to measure RHT-stimulated Ca2+ transients in SCN cells in the night. RHT stimulation produced a reliable increase in [Ca2+]i in a subset of SCN neurons in both ventral (WT: 40%; KO: 38%) and dorsal (WT: 20%; KO: 19%) cell populations (S. Fig. 4). In the ventral SCN region, the magnitude of the RHT-evoked Ca2+ transient was enhanced in the VIP-deficient mice (Fig. 3A), while in the dorsal SCN, there was a 30% reduction in the amplitude of RHT-evoked Ca2+ increases (Fig. 3B). The baseline in Ca2+ levels measured during the night were low and did not vary between the genotypes (Fig. 3C). Two-way ANOVA (DF = 580) indicated no main effect of genotype (F = 0.04; P = 0.841) on the magnitude of the Ca2+ increases, but there were significant effects of region (F = 50.860; P = 0.001) and a significant interaction between genotype×region (F = 9.473; P = 0.002). Thus, as measured by Ca2+ transients, the ventral SCN cell population appears to be receiving the signal from the RHT but the dorsal SCN cells exhibit a weakened response in the absence of VIP.
Fig. 3.

Evoked Ca2+ transients in the SCN of VIP KO and WT controls in response to RHT stimulation in a brain slice. (A) Examples of increases in [Ca2+]i after electrical stimulation of the RHT (dotted line; 10Hz for 1 sec) in the ventral and dorsal region of the SCN for both WT and VIP KO mice. Each line represents the response of one cell to three repeated stimuli. (B) Average change in [Ca2+]i expressed in ratio (340 nm/380 nm) after RHT stimulation. Compared to WT controls, the VIP KO mice show higher responses in the ventral SCN (P = 0.005), but lower responses in the dorsal SCN (P = 0.003) after RHT stimulation. Error bars represent SEM. * indicates significant difference (P<0.01) compared to controls analyzed by two-way ANOVA followed by Holm-Sidak method for multiple comparisons. (C) Average baseline [Ca2+]i does not differ between the genotypes, nor between ventral and dorsal SCN.
The loss of VIP alters the temporal and spatial distribution of light-evoked increases in Period1 expression in the SCN
To establish how light-induced Per1 expression varied between the genotypes, in situ hybridization using digoxigenin probe for Per1 was performed on SCN tissue at 30, 60, 120 min after light exposure at CT 16 (50 lux, 10 min). SCN photomicrographs illustrate that WT and VIP deficient mice differ in the spatio-temporal expression profiles of Per1 (Fig. 4, 5). As has been previously reported (Yan and Silver, 2004) in WT SCN, Per1 is photically induced in two separate waves: one in the core followed by one in the shell. The majority of immediate light-induced Per1 expression occurs during the first wave in the SCN core. This is followed by a second wave in the shell, characterized by a steady increase of Per1 from 30 to 90 min. In VIP KO mice, the two waves of Per1 induction follow a different pattern. Although there was an immediate response to the light pulse with a sizable induction of Per1 seen 30 min after the initial light exposure in the SCN core, this first wave of Per1 induction decreased faster in the VIPKO, at least an hour earlier when compared to WT. Next, the second wave of Per1 induction in the SCN shell was markedly attenuated in VIP KO mice. In fact, Per1 levels were similar to untreated controls, although there was more animal to animal variation in mutants. Two-way ANOVA analysis (DF = 38) of the Per1 expression in the core revealed effects of genotype (F = 50.216, P = 0.001), light treatment (F = 9.272, P = 0.001) and interaction of genotype × light treatment (F = 4.109, P = 0.009) on light-induced Per1 expression levels in the mouse SCN.
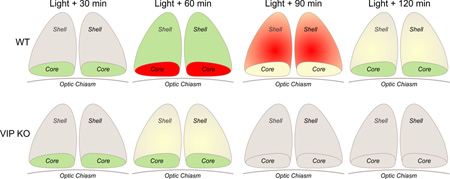
Fig. 4.

Examples of the temporal pattern of light-evoked changes in Per1 mRNA. SCN photomicrographs following digoxigenin ISH for Per1 reveal a time course of induction in WT mice at CT 16. Message begins to appear around 30 min after the beginning of the light pulse, with well-defined expression in a subpopulation of cells in the ventro-middle region of the nucleus around 45 to 60 min after the initial pulse. Message expression spreads across the nucleus and disappears by 4 hours after the initial pulse. This pattern is disrupted in the VIP KO mice in which the initial induction of the Per1 in response to light is strong but the signal is not sustained nor communicated to the shell SCN region. Upper left panel is labeled with PVN (paraventricular nucleus), SCN (suprachiasmatic nucleus), OC (optic chiasm), and 3rd V (3rd ventricle) as an aid for the reader.
Fig. 5.

Quantification of the temporal patterns of light-evoked Per1 expression in the core and shell SCN. Cell counting of Per1+ cells following ISH reveals that Per1 is significantly induced by a CT 16 light pulse at all-time points measured in WT mice, but only at 30 and 60 min post pulse in VIP KO mice. Post hoc analyses reveal significantly reduced Per1+ cell counts in the VIP KO compared with controls at 30, 60, and 90 min time points in the core SCN (denoted by *). In the shell, all Per1+ cell counts were significantly reduced. * indicates significant difference (P<0.05) compared to controls analyzed by two-way ANOVA followed by Holm-Sidak method for multiple comparisons.
We also examined the light induction of FOS in the core and shell SCN (Fig. 6). Compared to untreated controls, WT SCN exhibited a significant FOS induction when measured 60 and 120 min after light exposure (50 lux, 10 min) in both the core and shell regions. In contrast, the VIP KO mice only exhibited a significant FOS induction when measured 60 min after light exposure in the core SCN. By 120 min, the FOS counts were back at baseline in the core and never increased in the shell region. Two-way ANOVA analysis (DF = 22) of FOS expression in the core revealed effects of genotype (F = 24.851, P = 0.001), light treatment (F = 21.776, P = 0.001) and interaction of genotype×light treatment (F = 4.668, P = 0.02) on light-induced FOS expression levels in the mouse SCN. Thus in the VIP KO mice, the light-induction of cFOS and Per1 are attenuated in duration and most significantly impacted in the shell region of the SCN.
Fig. 6.

Quantification of the temporal patterns of light-evoked c-FOS expression core and shell SCN. Cell counting of c-FOS+ cells in the SCN core following immunofluorescence reveals that c-FOS is significantly induced by a CT 16 light pulse at both 60 and 120 min following light exposure in WT mice, but only at 60 min post pulse in VIP KO mice. In the SCN shell, c-FOS is significantly induced at both 60 and 120 min following light exposure in the WT mice. There was no significant c-FOS induction in the SCN shell of the mutant mice. Post hoc analyses reveal significantly reduced c-FOS+ cell counts in VIP KO mice compared with controls at both the 60 and 120 min time points. * indicates significant difference (P<0.01) compared to controls analyzed by two-way ANOVA followed by Holm-Sidak method for multiple comparisons.
Discussion
Previous studies have provided evidence that VIP signaling is important for synchronization of the circadian oscillator to the environment. Behavioral pharmacology studies have shown that the application of VIP alone (Piggins et al., 1995) or in combination with other peptides (Albers et al., 1991) can mimic the phase shifting effects of light. In a brain slice preparation containing the SCN, application of VIP induces clock gene expression (Nielsen et al., 2002) as well as phase shifts the circadian rhythm of vasopressin release (Watanabe et al., 2000) and neural activity (Reed et al., 2001). Behaviorally, the loss of VIP signaling alters the synchronization of circadian system. This phenotype is best seen in the experiments in which VIP or VIPR2 KO animals are released into DD from an LD cycle. A normally entrained animal will start its activity from a phase predicted from the prior LD cycle. For example, WT mice begin their free-running rhythm within 30 min of the time of lights-off in the prior LD cycle. In contrast, the VIP KO animals start their activity about 8 to 10 hours before the time of the prior lights-off (Colwell et al., 2003; Aton et al., 2005; Brown et al., 2007; Ciarleglio et al., 2009). Similarly, the VIPR2 KO mice also exhibit an extremely large advance in activity onset after release into DD (Harmar et al., 2002; Hughes and Piggins, 2008). This altered synchronization in the VIP KO mice is also seen when the mice are held in a skeleton photoperiod consisting of one or two light exposures per 24 hrs cycle and in the failure of these mice to response to short light exposure with phase shift in their locomotor activity rhythms (Colwell et al., 2003). The VIP KO mice fail to show behavioral and physiological adaptations to short or long photoperiods (Lucassen et al., 2012). Thus, the data are consistent with the suggestion that VIP is required for normal light-induced synchronization of the circadian system but does not tell us where in the circadian circuit the deficits lie.
To examine this issue, we first implanted electrodes into the SCN of VIP KO mice and litter-mate WT controls and recorded MUA in freely moving mice. In response to retinal illumination, light-responsive SCN neurons show an increase in electrical impulse frequency (Meijer et al., 1998; Nakamura et al., 2004; Drouyer et al., 2007; Brown et al., 2011; van Diepen et al., 2013). We found that the VIP KO mice exhibited robust light-responses that could not be distinguished from those recorded from the SCN of WT mice (Fig. 1). All of the cells were light-responsive but the nature of these extracellular recording makes it difficult to determine the region of the SCN from which the neurons were sampled. Prior work has established that the RHT mostly terminates on the ventral aspect of the SCN (Ibata et al., 1989; Kiss et al., 2008; Morin and Allen, 2006) and we assume that this is where the greatest % of light-responsive units are located. Given the severe behavioral deficits observed in the photic response of the VIP KO mice (Colwell et al., 2003), these results were unexpected. These results indicate that the retinal illumination is reaching the SCN of the mutant mice without difficulty.
A variety of evidence indicates that NMDA receptors play a critical role in transducing the glutamatergic RHT signal to an electrical response in the SCN (Colwell et al., 1990; Ding et al., 1994; Colwell, 2001; Pennartz et al., 2001; Wang et al., 2008). Therefore we next directly measured NMDA-evoked changes in firing rate in SCN neurons in a brain slice preparation. One caveat here is that in order to isolate the NMDA currents, we blocked GABA mediated synaptic transmission which could influence the findings. Focusing on neurons in the retino-recipient ventral region of the SCN, we found that VIP KO and WT mice exhibited clear NMDA-evoked changes in firing rate (Fig. 2). This observation fits with the extracellular recording described above. The single cell resolution of the whole cell patch clamp recordings offers a more nuanced view of the impact of the loss of VIP. The absolute level of SCN activity was significantly reduced in the absence of VIP and a smaller percentage of neurons exhibited a significant NMDA-evoked change in firing. These genotypic changes would be very difficult to detect with the extracellular technique used above. So the patch-clamp recording indicate that, while the KO mice exhibit a clear NMDA response, the absolute firing rate with and without NMDA treatments was reduced in the mutant ventral SCN neurons
After NMDA receptor activation, the next step in the signaling cascade in SCN neurons appears to be an increase in intracellular Ca2+ mediated by both glutamate receptor activation as well as depolarization driven activation of voltage sensitive Ca2+ channels (Kim et al., 2005; Irwin & Allen, 2007; Colwell, 2011). Optical imaging techniques and the fura2-AM indicator dye were used to measure RHT-stimulated Ca2+ transients in SCN cells in the night. While the % of cells responding to RHT did not vary between the genotypes (S. Fig. 4), we saw a striking difference in the magnitude of response between the ventral and dorsal cell populations. In the ventral SCN region, the RHT-evoked Ca2+ transient was actually enhanced in the VIP-deficient mice than in WT (Fig. 3A). This fits with our in vivo recordings as shown in Fig. 1. In contrast, in the dorsal SCN region, there was a 30% reduction in the amplitude of RHT-evoked Ca2+ increases (Fig. 3B). So the physiological measures indicate that the loss of VIP does not alter the transmission of light-information to the SCN circuit but raise the possibility that the VIP prevents the spread of photic information from the ventral neurons to the rest of the SCN circuit. This hypothesis fits with recent observations suggesting that VIP and its receptor (VIPR2) is necessary for circuit-level integration with the SCN (Brancaccio et al., 2013; Pauls et al. 2014).
Finally, we turned to anatomical techniques to further test this model. The increase in Ca2+ activates a number of signaling pathways that converge to alter transcriptional and/or translational regulators, including cyclic AMP-responsive element (CRE)-binding protein (CREB). Phosphorylated CREB is translocated into the nucleus where it can bind to CREs in the promoter regions of c-Fos and Period1 (Per1), and drives transcription of these genes over the course of hours (Kornhauser et al., 1996; Shearman et al., 1997; Shigeyoshi et al., 1997; Gau et al., 2002; Travnickova-Bendova et al., 2002). We have previously found that the photic induction of Per1 in the SCN was reduced in the VIP KO (Dragich et al., 2010) at 60 min following the light exposure but did not examine the spatio-temporal patterns in the mutants. So in our final set of experiments, we examined the light-evoked changes in Per1 and FOS in the SCN of the VIP KO mice. For each SCN, a template was created to define core and shell regions delineated by expression of AVP (shell) and androgen receptor (core) (S. Fig. 3). As has been previously reported (Hamada et al., 2004; Yan and Silver, 2004; Koch et al., 2009) in WT SCN, Per1 is photically induced in two separate waves: one in the core followed by one in the shell. The majority of immediate light-induced Per1 expression occurs during the first wave in the SCN core. This is followed by a second wave in the shell, characterized by a steady increase of Per1 from 30 to 90 min (Fig. 4, 5). The light induction of Per1 expression in the VIP KO showed a strikingly different pattern. As we have seen with the physiology, the immediate response to light exposure was a sizable induction of Per1 in the core SCN of the VIP KO mice. However, this increase declined faster and a second wave of Per1 induction in the SCN shell was markedly attenuated in VIP KO mice. As far as we know, this pattern of gene expression has only been reported once before. Mice heterozygous for a mutation in the NaV1.1 channel (Scn1a +/−) also show normal light induction of c-Fos and Per1 mRNA in ventral SCN but impaired gene expression responses in dorsal SCN (Han et al., 2012). We do not know the impact of the reduction in the Scn1a gene on SCN electrical activity but a reasonable speculation is that the excitability is reduced in both the Scn1a +/− and the VIP −/− mice.
Together these finding raise questions about mechanisms and functional significance. The ventral SCN receives most of the retinal input (Ibata et al., 1989; Kiss et al., 2008; Morin and Allen, 2006) and shows more robust light-induced changes in electrical activity (Meijer et al., 1998; Shibata et al., 1984) and gene expression (Antle et al., 2009). Many of the neurons that receive retinal input within the core SCN express the neuropeptides VIP and gastrin-releasing peptide, as well as the neurotransmitter GABA. In contrast, neurons of the dorsal shell appear to generate the most robust circadian oscillations, at least at the level of gene expression (Hamada et al., 2004; Nakamura et al., 2005; Yan and Okamura, 2002). The neurons in the shell express AVP, prokineticin 2 as well as GABA. Therefore VIP is well positioned to mediate core to shell communication. While the VIP receptors (VIPR2) are expressed throughout the SCN, the expression is more abundant in the dorsal region (An et al., 2012) especially in the central SCN where we do our physiological recordings.
Both light exposure as well as treatment with gastrin-releasing peptide or VIP can also cause persistent increases in neural activity within the SCN at night (Gamble et al. 2007; Gamble et al. 2011; Kuhlman et al. 2003; LeSauter et al. 2011; Kudo et al., 2013). Thus peptide transmitters can drive long-lasting changes in the excitability within the SCN network. We speculate that VIP and gastrin-releasing peptide may work together functionally to regulate the excitability of the SCN circuit. VIP is expressed with a subset of GABAergic interneurons found throughout the central nervous system and has been shown to alter the excitability of several neural populations (Hermes et al. 2009; Jeftinija et al. 1982; Lee and Cox 2006; Pawelzik et al. 1992). There is also evidence that SCN neurons from VIPR2−/− mice may be chronically hyperpolarized (Pakhotin et al., 2006) consistent with the findings in the present study. These findings suggest that VIP-induced changes in electrical activity may be critical for the light-induced changes in gene expression especially in the dorsal SCN. During the night, SCN neurons are normally silent but do respond to photic stimulation transduced by ipRGCs that generate action potentials up to 20 Hz (Berson et al. 2002; Irwin and Allen 2007; Meijer et al. 1998; Tu et al. 2005; Warren et al. 2003). This light-induced increase in neural activity drives synaptic communication with the rest of the cells in the circuit. Prior work in both mollusks and mammals suggests that the electrical activity of circadian pacemaker neurons determines how these cells respond to photic stimulation (McMahon & Block, 1987; Irwin & Allen, 2007; Colwell, 2011). This regulation can explain why the loss of VIP or its receptor has such a dramatic effect on photic entrainment of the circadian system and impairs the ability of the SCN to encode seasonal information.
Supplementary Material
Acknowledgements
We would like to acknowledge funding by Netherlands Organization for Scientific Research (grant Number: 818.02.016). AV was supported by Laboratory of Neuroendocrinology Training Grant T32 HD 07228.
Abbreviations
- ANOVA
analysis of variance
- AVP
arginine vasopressin
- ACSF
artificial cerebrospinal fluid
- Ca2+
calcium
- CT
circadian time
- DD
constant dark
- CREB
cyclic AMP-responsive element (CRE)-binding protein
- IHC
immunohistochemistry
- ISH
in situ hybridization
- ipRGCs
intrinsically photosensitive retinal ganglion cells
- LD
light-dark
- MUA
multi-unit activity
- NMDA
N-methyl-D-aspartic acid
- RHT
retinohypothalamic tract
- SFR
Spontaneous firing rates
- SCN
suprachiasmatic nucleus
- VIP
vasoactive intestinal peptide
- WT
wild-type
References
- Abrahamson EE, Moore RY. Suprachiasmatic nucleus in the mouse: retinal innervation, intrinsic organization and efferent projections. Brain Res. 2001;916(1–2):172–191. doi: 10.1016/s0006-8993(01)02890-6. [DOI] [PubMed] [Google Scholar]
- Albrecht U. Timing to perfection: the biology of central and peripheral circadian clocks. Neuron. 2012;74(2):246–260. doi: 10.1016/j.neuron.2012.04.006. [DOI] [PubMed] [Google Scholar]
- An S, Irwin RP, Allen CN, Tsai C, Herzog ED. Vasoactive intestinal polypeptide requires parallel changes in adenylate cyclase and phospholipase C to entrain circadian rhythms to a predictable phase. J Neurophysiol. 2011;105:2289–2296. doi: 10.1152/jn.00966.2010. [DOI] [PMC free article] [PubMed] [Google Scholar]
- An S, Tsai C, Ronecker J, Bayly A, Herzog ED. Spatiotemporal distribution of vasoactive intestinal polypeptide receptor 2 in mouse suprachiasmatic nucleus. J Comp Neurol. 2012;520(12):2730–2741. doi: 10.1002/cne.23078. [DOI] [PMC free article] [PubMed] [Google Scholar]
- Antle MC, Smith VM, Sterniczuk R, Yamakawa GR, Rakai BD. Physiological responses of the circadian clock to acute light exposure at night. Rev Endocr Metab Disord. 2009;10(4):279–291. doi: 10.1007/s11154-009-9116-6. [DOI] [PubMed] [Google Scholar]
- Aton SJ, Colwell CS, Harmar AJ, Waschek J, Herzog ED. Vasoactive intestinal polypeptide mediates circadian rhythmicity and synchrony in mammalian clock neurons. Nat Neurosci. 2005;8(4):476–483. doi: 10.1038/nn1419. [DOI] [PMC free article] [PubMed] [Google Scholar]
- Brancaccio M, Maywood ES, Chesham JE, Loudon AS, Hastings MH. A Gq-Ca2+ axis controls circuit-level encoding of circadian time in the suprachiasmatic nucleus. Neuron. 2013;78(4):714–728. doi: 10.1016/j.neuron.2013.03.011. [DOI] [PMC free article] [PubMed] [Google Scholar]
- Berson DM, Dunn FA, Takao M. Phototransduction by retinal ganglion cells that set the circadian clock. Science. 2002;295:1070–1073. doi: 10.1126/science.1067262. [DOI] [PubMed] [Google Scholar]
- Brown TM, Colwell CS, Waschek JA, Piggins HD. Disrupted neuronal activity rhythms in the suprachiasmatic nuclei of vasoactive intestinal polypeptide-deficient mice. J Neurophysiol. 2007;97:2553–2558. doi: 10.1152/jn.01206.2006. [DOI] [PMC free article] [PubMed] [Google Scholar]
- Brown TM, Wynne J, Piggins HD, Lucas RJ. Multiple hypothalamic cell populations encoding distinct visual information. J. Physiol. 2011;589:1173–1194. doi: 10.1113/jphysiol.2010.199877. [DOI] [PMC free article] [PubMed] [Google Scholar]
- Challet E, Caldelas I, Graff C, Pévet P. Synchronization of the molecular clockwork by light- and food-related cues in mammals. Biol Chem. 2003;384(5):711–719. doi: 10.1515/BC.2003.079. [DOI] [PubMed] [Google Scholar]
- Ciarleglio CM, Gamble KL, Axley JC, Strauss BR, Cohen JY, Colwell CS, McMahon DG. Population encoding by circadian clock neurons organizes circadian behavior. J Neurosci. 2009;29:1670–1676. doi: 10.1523/JNEUROSCI.3801-08.2009. [DOI] [PMC free article] [PubMed] [Google Scholar]
- Colwell CS. NMDA-evoked calcium transients and currents in the suprachiasmatic nucleus: Gating by the circadian system. Eur. J. Neurosci. 2001;13:1420–1428. doi: 10.1046/j.0953-816x.2001.01517.x. [DOI] [PMC free article] [PubMed] [Google Scholar]
- Colwell CS. Linking neural activity and molecular oscillations in the SCN. Nat Rev Neurosci. 2011;12:553–569. doi: 10.1038/nrn3086. [DOI] [PMC free article] [PubMed] [Google Scholar]
- Colwell CS, Michel S, Itri J, Rodriguez W, Tam J, Lelievre V, Hu Z, Liu X, Waschek JA. Disrupted circadian rhythms in VIP- and PHI-deficient mice. Am J Physiol Regul Integr Comp Physiol. 2003;285:R939–R949. doi: 10.1152/ajpregu.00200.2003. [DOI] [PubMed] [Google Scholar]
- Czeisler CA, Richardson GS, Zimmerman JC, Moore-Ede MC, Weitzman ED. Entrainment of human circadian rhythms by light-dark cycles: a reassessment. Photochem Photobiol. 1981;34(2):239–247. [PubMed] [Google Scholar]
- Dibner C, Schibler U, Albrecht U. The mammalian circadian timing system: organization and coordination of central and peripheral clocks. Annu Rev Physiol. 2010;72:517–549. doi: 10.1146/annurev-physiol-021909-135821. [DOI] [PubMed] [Google Scholar]
- Ding JM, Chen D, Weber ET, Faiman LE, Rea MA, Gillette MU. Resetting the biological clock: Mediation of nocturnal circadian shifts by glutamate and NO. Science. 1994;266:1713–1717. doi: 10.1126/science.7527589. [DOI] [PubMed] [Google Scholar]
- Dragich JM, Loh DH, Wang LM, Vosko AM, Kudo T, Nakamura TJ, Odom IH, Tateyama S, Hagopian A, Waschek JA, Colwell CS. The role of the neuropeptides PACAP and VIP in the photic regulation of gene expression in the suprachiasmatic nucleus. Eur J Neurosci. 2010;31:864–875. doi: 10.1111/j.1460-9568.2010.07119.x. [DOI] [PubMed] [Google Scholar]
- Drouyer E, Rieux C, Hut RA, Cooper HM. Responses of suprachiasmatic nucleus neurons to light and dark adaptation: relative contributions of melanopsin and rod-cone inputs. J. Neurosci. 2007;27:9623–9631. doi: 10.1523/JNEUROSCI.1391-07.2007. [DOI] [PMC free article] [PubMed] [Google Scholar]
- Gamble KL, Kudo T, Colwell CS, McMahon DG. Gastrin-releasing peptide modulates fast delayed rectifier potassium current in Per1-expressing SCN neurons. J Biol Rhythms. 2011;26:99–106. doi: 10.1177/0748730410396678. [DOI] [PMC free article] [PubMed] [Google Scholar]
- Hamada T, Antle MC, Silver R. Temporal and spatial expression patterns of canonical clock genes and clock–controlled genes in the suprachiasmatic nucleus. Eur. J. Neurosci. 2004;19:1741–1748. doi: 10.1111/j.1460-9568.2004.03275.x. [DOI] [PMC free article] [PubMed] [Google Scholar]
- Hannibal J, Hindersson P, Knudsen SM, Georg B, Fahrenkrug J. The photopigment melanopsin is exclusively present in pituitary adenylate cyclase-activating polypeptide-containing retinal ganglion cells of the retinohypothalamic tract. J. Neurosci. 2002;22:RC191. doi: 10.1523/JNEUROSCI.22-01-j0002.2002. [DOI] [PMC free article] [PubMed] [Google Scholar]
- Hannibal J, Brabet P, Fahrenkrug J. Mice lacking the PACAP type I receptor have impaired photic entrainment and negative masking. Am J Physiol Regul Integr Comp Physiol. 2008;295(6):R2050–R2058. doi: 10.1152/ajpregu.90563.2008. [DOI] [PubMed] [Google Scholar]
- Han S, Yu FH, Schwartz MD, Linton JD, Bosma MM, Hurley JB, Catterall WA, de la Iglesia HO. Na(V)1.1 channels are critical for intercellular communication in the suprachiasmatic nucleus and for normal circadian rhythms. Proc Natl Acad Sci USA. 2012;109(6):E368–E377. doi: 10.1073/pnas.1115729109. [DOI] [PMC free article] [PubMed] [Google Scholar]
- Harmar AJ, Marston HM, Shen S, Spratt C, West KM, Sheward WJ, Morrison CF, Dorin JR, Piggins HD, Reubi JC, Kelly JS, Maywood ES, Hastings MH. The VPAC(2) receptor is essential for circadian function in the mouse suprachiasmatic nuclei. Cell. 2002;109:497–508. doi: 10.1016/s0092-8674(02)00736-5. [DOI] [PubMed] [Google Scholar]
- Hermes ML, Kolaj M, Doroshenko P, Coderre E, Renaud LP. Effects of VPAC2 receptor activation on membrane excitability and GABAergic transmission in subparaventricular zone neurons targeted by suprachiasmatic nucleus. J Neurophysiol. 2009;102:1834–1842. doi: 10.1152/jn.91261.2008. [DOI] [PubMed] [Google Scholar]
- Hughes AT, Piggins HD. Behavioral responses of Vipr2−/− mice to light. J Biol Rhythms. 2008;23(3):211–219. doi: 10.1177/0748730408316290. [DOI] [PubMed] [Google Scholar]
- Ibata Y, Takahashi Y, Okamura H, Kawakami F, Terubayashi H, Kubo T, Yanaihara N. Vasoactive intestinal peptide (VIP)-like immunoreactive neurons located in the rat suprachiasmatic nucleus receive a direct retinal projection. Neurosci. Letters. 1989;97:1–5. doi: 10.1016/0304-3940(89)90129-8. [DOI] [PubMed] [Google Scholar]
- Irwin R, Allen C. Calcium response to retinohypothalamic tract synaptic transmission in suprachiasmatic nucleus neurons. J Neurosci. 2007;27:11748–11757. doi: 10.1523/JNEUROSCI.1840-07.2007. [DOI] [PMC free article] [PubMed] [Google Scholar]
- Itri J, Colwell CS. Regulation of inhibitory synaptic transmission by vasoactive intestinal peptide (VIP) in the mouse suprachiasmatic nucleus. J. Neurophysiol. 2003;90:1589–1597. doi: 10.1152/jn.00332.2003. [DOI] [PubMed] [Google Scholar]
- Jeftinija S, Murase K, Nedeljkov V, Randic M. Vasoactive intestinal polypeptide excites mammalian dorsal horn neurons both in vivo and in vitro. Brain Res. 1982;243:158–164. doi: 10.1016/0006-8993(82)91131-3. [DOI] [PubMed] [Google Scholar]
- Khalsa SB, Jewett ME, Cajochen C, Czeisler CA. A phase response curve to single bright light pulses in human subjects. J Physiol. 2003;549(Pt 3):945–952. doi: 10.1113/jphysiol.2003.040477. [DOI] [PMC free article] [PubMed] [Google Scholar]
- Kiss J, Csaki A, Csaba Z, Halasz B. Synaptic contacts of vesicular glutamate transporter 2 fibres on chemically identified neurons of the hypothalamic suprachiasmatic nucleus of the rat. Eur. J. Neurosci. 2008;28:1760–1774. doi: 10.1111/j.1460-9568.2008.06463.x. [DOI] [PubMed] [Google Scholar]
- Koch JM, Hagenauer MH, Lee TM. The response of Per1 to light in the suprachiasmatic nucleus of the diurnal degu (Octodon degus) Chronobiol Int. 2009;26(6):1263–1271. doi: 10.3109/07420520903223992. [DOI] [PMC free article] [PubMed] [Google Scholar]
- Kornhauser JM, Mayo KE, Takahashi JS. Light, immediate-early genes, and circadian rhythms. Behav Genet. 1996;26(3):221–240. doi: 10.1007/BF02359382. [DOI] [PubMed] [Google Scholar]
- Kudo T, Tahara Y, Gamble KL, McMahon DG, Block GD, Colwell CS. Vasoactive intestinal peptide produces long-lasting changes in neural activity in the suprachiasmatic nucleus. J Neurophysiol. 2013;110(5):1097–1106. doi: 10.1152/jn.00114.2013. [DOI] [PMC free article] [PubMed] [Google Scholar]
- Lee SH, Cox CL. Excitatory actions of vasoactive intestinal peptide on mouse thalamocortical neurons are mediated by VPAC2 receptors. J Neurophysiol. 2006;96:858–871. doi: 10.1152/jn.01115.2005. [DOI] [PubMed] [Google Scholar]
- LeSauter J, Silver R, Cloues R, Witkovsky P. Light exposure induces short- and long-term changes in the excitability of retinorecipient neurons in suprachiasmatic nucleus. J Neurophysiol. 2011;106:576–588. doi: 10.1152/jn.00060.2011. [DOI] [PMC free article] [PubMed] [Google Scholar]
- Lucas RJ, Lall GS, Allen AE, Brown TM. How rod, cone, and melanopsin photoreceptors come together to enlighten the mammalian circadian clock. Prog Brain Res. 2012;199:1–18. doi: 10.1016/B978-0-444-59427-3.00001-0. [DOI] [PubMed] [Google Scholar]
- Lucassen EA, van Diepen HC, Houben T, Michel S, Colwell CS, Meijer JH. Role of vasoactive intestinal peptide in seasonal encoding by the suprachiasmatic nucleus clock. Eur J Neurosci. 2012;35(9):1466–1474. doi: 10.1111/j.1460-9568.2012.08054.x. [DOI] [PubMed] [Google Scholar]
- McMahon DG, Block GD. The Bulla ocular circadian pacemaker. I. Pacemaker neuron membrane potential controls phase through a calcium-dependent mechanism. J Comp Physiol A. 1987;161(3):335–346. doi: 10.1007/BF00603959. [DOI] [PubMed] [Google Scholar]
- Meijer J, Watanabe K, Schaap J, Albus H, Détári L. Light responsiveness of the suprachiasmatic nucleus: long-term multiunit and single-unit recordings in freely moving rats. J Neurosci. 1998;18:9078–9087. doi: 10.1523/JNEUROSCI.18-21-09078.1998. [DOI] [PMC free article] [PubMed] [Google Scholar]
- Michel S, Itri J, Colwell CS. Excitatory mechanisms in the suprachiasmatic nucleus: the role of AMPA/KA glutamate receptors. J Neurophysiol. 2002;88:817–828. doi: 10.1152/jn.2002.88.2.817. [DOI] [PMC free article] [PubMed] [Google Scholar]
- Michel S, Marek R, Vanderleest HT, Vansteensel MJ, Schwartz WJ, Colwell CS, Meijer JH. Mechanism of bilateral communication in the suprachiasmatic nucleus. Eur J Neurosci. 2013;37(6):964–971. doi: 10.1111/ejn.12109. [DOI] [PubMed] [Google Scholar]
- Mohawk JA, Green CB, Takahashi JS. Central and peripheral circadian clocks in mammals. Annu Rev Neurosci. 2012;35:445–462. doi: 10.1146/annurev-neuro-060909-153128. [DOI] [PMC free article] [PubMed] [Google Scholar]
- Morin LP, Allen CN. The circadian visual system. Brain Res. Rev. 2006;51:1–60. doi: 10.1016/j.brainresrev.2005.08.003. [DOI] [PubMed] [Google Scholar]
- Nakamura TJ, Fujimura K, Ebihara S, Shinohara K. Light response of the neuronal firing activity in the suprachiasmatic nucleus of mice. Neurosci. Lett. 2004;371:244–248. doi: 10.1016/j.neulet.2004.09.005. [DOI] [PubMed] [Google Scholar]
- Nielsen HS, Hannibal J, Fahrenkrug J. Vasoactive intestinal polypeptide induces per1 and per2 gene expression in the rat suprachiasmatic nucleus late at night. Eur J Neurosci. 2002;15:570–574. doi: 10.1046/j.0953-816x.2001.01882.x. [DOI] [PubMed] [Google Scholar]
- O'Neill JS, Maywood ES, Hastings MH. Cellular mechanisms of circadian pacemaking: beyond transcriptional loops. Handb Exp Pharmacol. 2013;217:67–103. doi: 10.1007/978-3-642-25950-0_4. [DOI] [PubMed] [Google Scholar]
- Pakhotin P, Harmar AJ, Verkhratsky A, Piggins H. VIP receptors control excitability of suprachiasmatic nuclei neurones. Pflugers Arch. 2006;452:7–15. doi: 10.1007/s00424-005-0003-z. [DOI] [PubMed] [Google Scholar]
- Pawelzik H, Dodt HU, Zieglgansberger W. Actions of vasoactive intestinal polypeptide (VIP) on neocortical neurons of the rat in vitro. Neurosci Lett. 1992;147:167–170. doi: 10.1016/0304-3940(92)90586-v. [DOI] [PubMed] [Google Scholar]
- Pauls S, Foley NC, Foley DK, LeSauter J, Hastings MH, Maywood ES, Silver R. Differential contributions of intra-cellular and inter-cellular mechanisms to the spatial and temporal architecture of the suprachiasmatic nucleus circadian circuitry in wild-type, cryptochrome-null and vasoactive intestinal peptide receptor 2-null mutant mice. Eur J Neurosci. 2014;40:2528–2540. doi: 10.1111/ejn.12631. [DOI] [PMC free article] [PubMed] [Google Scholar]
- Pennartz CMA, Hamstra R, Geurtsen AMS. Enhanced NMDA receptor activity in retinal inputs to the rat suprachiasmatic nucleus during the subjective night. J. Physiol. (Camb.) 2001;532:181–194. doi: 10.1111/j.1469-7793.2001.0181g.x. [DOI] [PMC free article] [PubMed] [Google Scholar]
- Reed HE, Meyer-Spasche A, Cutler DJ, Coen CW, Piggins HD. Vasoactive intestinal polypeptide (VIP) phase-shifts the rat suprachiasmatic nucleus clock in vitro. Eur J Neurosci. 2001;13(4):839–843. doi: 10.1046/j.0953-816x.2000.01437.x. [DOI] [PubMed] [Google Scholar]
- Reed HE, Cutler DJ, Brown TM, Brown J, Coen CW, Piggins HD. Effects of vasoactive intestinal polypeptide on neurones of the rat suprachiasmatic nuclei in vitro. Journal of neuroendocrinology. 2002;14:639–646. doi: 10.1046/j.1365-2826.2002.00826.x. [DOI] [PubMed] [Google Scholar]
- Rollag MD, Berson DM, Provencio I. Melanopsin, ganglion-cell photoreceptors, and mammalian photoentrainment. J Biol Rhythms. 2003;18(3):227–234. doi: 10.1177/0748730403018003005. [DOI] [PubMed] [Google Scholar]
- Schmidt TM, Do MT, Dacey D, Lucas R, Hattar S, Matynia A. Melanopsin-positive intrinsically photosensitive retinal ganglion cells: from form to function. J Neurosci. 2011;31(45):16094–16101. doi: 10.1523/JNEUROSCI.4132-11.2011. [DOI] [PMC free article] [PubMed] [Google Scholar]
- Shearman LP, Zylka MJ, Weaver DR, Kolakowski LF, Jr, Reppert SM. Two period homologs: circadian expression and photic regulation in the suprachiasmatic nuclei. Neuron. 1997;19(6):1261–1269. doi: 10.1016/s0896-6273(00)80417-1. [DOI] [PubMed] [Google Scholar]
- Shibata S, Liou S, Ueki S, Oomura Y. Influence of environmental light-dark cycle and enucleation on activity of suprachiasmatic neurons in slice preparations. Brain Res. 1984;302:75–81. doi: 10.1016/0006-8993(84)91286-1. [DOI] [PubMed] [Google Scholar]
- Shibata S, Watanabe A, Hamada T, Ono M, Watanabe S. N-methyl-D-aspartate induces phase shifts in circadian rhythm of neuronal activity of rat SCN in vitro. Am. J. Physiol. 1994;267:R360–R364. doi: 10.1152/ajpregu.1994.267.2.R360. [DOI] [PubMed] [Google Scholar]
- Shigeyoshi Y, Taguchi K, Yamamoto S, Takekida S, Yan L, Tei H, Moriya T, Shibata S, Loros JJ, Dunlap JC, Okamura H. Light-induced resetting of a mammalian circadian clock is associated with rapid induction of the mPer1 transcript. Cell. 1997;91(7):1043–1053. doi: 10.1016/s0092-8674(00)80494-8. [DOI] [PubMed] [Google Scholar]
- Travnickova-Bendova Z, Cermakian N, Reppert SM, Sassone-Corsi P. Bimodal regulation of mPeriod promoters by CREB-dependent signaling and CLOCK/BMAL1 activity. Proc. Natl Acad. Sci. U.S.A. 2002;99:7728–7733. doi: 10.1073/pnas.102075599. [DOI] [PMC free article] [PubMed] [Google Scholar]
- Tu DC, Zhang D, Demas J, Slutsky EB, Provencio I, Holy TE, Van Gelder RN. Physiologic diversity and development of intrinsically photosensitive retinal ganglion cells. Neuron. 2005;48:987–999. doi: 10.1016/j.neuron.2005.09.031. [DOI] [PubMed] [Google Scholar]
- van Diepen HC, Ramkisoensing A, Peirson SN, Foster RG, Meijer JH. Irradiance encoding in the suprachiasmatic nuclei by rod and cone photoreceptors. FASEB J. 2013;27(10):4204–4212. doi: 10.1096/fj.13-233098. [DOI] [PubMed] [Google Scholar]
- Wang LM, Schroeder A, Loh D, Smith D, Lin K, Han JH, Michel S, Hummer DL, Ehlen JC, Albers HE, Colwell CS. Role for the NR2B subunit of the N-methyl-D-aspartate receptor in mediating light input to the circadian system. Eur J Neurosci. 2008;27(7):1771–1779. doi: 10.1111/j.1460-9568.2008.06144.x. [DOI] [PMC free article] [PubMed] [Google Scholar]
- Warren EJ, Allen CN, Brown RL, Robinson DW. Intrinsic light responses of retinal ganglion cells projecting to the circadian system. Eur J Neurosci. 2003;17:1727–1735. doi: 10.1046/j.1460-9568.2003.02594.x. [DOI] [PMC free article] [PubMed] [Google Scholar]
- Welsh D, Takahashi J, Kay S. Suprachiasmatic nucleus: cell autonomy and network properties. Annu Rev Physiol. 2010;72:551–577. doi: 10.1146/annurev-physiol-021909-135919. [DOI] [PMC free article] [PubMed] [Google Scholar]
- Yan L, Okamura H. Gradients in the circadian expression of Per1 and Per2 genes in the rat suprachiasmatic nucleus. Eur J Neurosci. 2002;15(7):1153–1162. doi: 10.1046/j.1460-9568.2002.01955.x. [DOI] [PubMed] [Google Scholar]
- Yan L, Silver R. Resetting the brain clock: time course and localization of mPER1 and mPER2 protein expression in suprachiasmatic nuclei during phase shifts. Eur J Neurosci. 2004;19(4):1105–1109. doi: 10.1111/j.1460-9568.2004.03189.x. [DOI] [PMC free article] [PubMed] [Google Scholar]
Associated Data
This section collects any data citations, data availability statements, or supplementary materials included in this article.