Abstract
Purpose
To assess the impact of approximations in current analytical dose calculation methods (ADCs) on tumor control probability (TCP) in proton therapy.
Methods
Dose distributions planned with ADC were compared to delivered dose distributions (as determined by Monte Carlo simulations). A total of 50 patients were investigated in this analysis with 10 patients per site for 5 treatment sites (head-and-neck, lung, breast, prostate, liver). Differences were evaluated using dosimetric indices based on a dose-volume-histogram analysis, a γ-index analysis and estimations of TCP.
Results
We find that ADC overestimates the target doses on average by 1–2% for all patients considered. The mean dose, D95, D50 and D02 (the dose value covering 95%, 50% and 2% of the target volume, respectively) are predicted within 5% of the delivered dose. The γ-index passing rate for target volumes was above 96% for a 3%/3mm criteria. Differences in TCP were up to 2%, 2.5%, 6%, 6.5%, and 11% for liver and breast, prostate, head-and-neck and lung patients, respectively. Differences in normal tissue complication probabilities for bladder and anterior-rectum of prostate patients were less than 3%.
Conclusion
Our results indicate that current dose calculation algorithms lead to underdosage of the target by as much as 5%, resulting in differences in TCP of up to 11%. In order to ensure full target coverage, advanced dose-calculation methods like Monte Carlo simulations may be necessary in proton therapy. Monte Carlo simulations may also be required in order to avoid biases due to systematic discrepancies in calculated dose distributions for clinical trials comparing proton therapy to conventional radiotherapy.
1. Introduction
With an increasing number of proton centers currently being built around the world, the number of patients receiving full or partial treatment with proton therapy is steadily increasing. The standard method to calculate and optimize dose distributions for a patient treatment plan is based on fast analytical dose calculation (ADC) algorithms. These algorithms calculate dose along narrow width beams (pencils) with a certain spread. While more accurate dose calculation engines are available, they are not yet standard in clinical practice. The Monte Carlo (MC) simulation method is considered the gold standard to describe particle interactions and calculate the resulting dose (1). Several studies comparing proton dose distributions calculated with MC and ADC algorithms have demonstrated the shortcomings of the latter, in particular when delivering fields to heterogeneous patient geometries (2, 3). Soukup et al have previously reported the shortcomings of ADCs on the target coverage predicted by the planning system based on dose-volume histograms (DVHs) of six example patients (4), however, a systematic analysis of the effects has not yet been conducted.
In a recent study, we have assessed the clinical impact of range uncertainty margins in proton therapy (5). The range of protons is subject to uncertainties arising from various sources such as inaccuracies in patient set-up, CT imaging, conversion of CT Hounsfield units to material composition and limitations of the dose calculation engine. The impact of the latter has been assessed with respect to coverage of clinical target volumes (CTVs) (6, 7). Margins are generally a function of initial proton energy neglecting dependencies on the patient geometry. We have shown that clinically defined margins can be reduced for homogeneous treatment sites such as prostate, liver and whole brain. On the other hand, for heterogeneous sites such as head-and-neck, breast and lung, the use of the currently applied generic range margins is insufficient to cover range fluctuations for each individual treatment field (5). While this previous study quantified range uncertainties due to dose calculation in proton therapy, it did not address target coverage. Approximations in dose calculation can affect target coverage two-fold, either leading to a geometrical miss from overestimating the range or predicting unrealistic dose homogeneity due to under- or overestimation of scattering effects in tissue.
In this study we investigate the clinical significance of approximations in ADCs.
2. Methods
2.1 Patient Cohort
50 patients from 5 treatment sites (10 patients per site) were selected from our clinical database covering the full range from relatively homogeneous patient geometries (liver) to patients with high geometrical complexity (air cavities and density heterogeneities in head-and-neck, lung and breast patients) and from shallow targets (breast) to deep-seated tumors (prostate). Table 1 summarizes the patient cohort and lists the range of target volumes, prescribed doses, proton beam ranges and modulation widths.
Table 1.
Summary of the patient cohort.
| Treatment Site | Number of patients | Range of Prescription Doses [Gy(RBE)] | Range of Target Volumes [cc] | Range of Beam Ranges in Water [mm] | Range of Modulation widths [mm] | Range of aperture opening area [cm2] |
|---|---|---|---|---|---|---|
| Head-and- neck | 10 | 54–76 | 22–134 | 53–195 | 16–139 | 4.5–143.4 |
| Lung | 10 | 35–75 | 2.3–478 | 75–244 | 13–138 | 9.9–103.7 |
| Breast | 10 | 45–50.4 | 358–3424 | 53–121 | 18–116 | 16.2–337.8 |
| Prostate | 10 | 33–79.2 | 30–178 | 224–271 | 66–122 | 26.5–54.9 |
| Liver | 10 | 40–58.5 | 48–723 | 109–237 | 57–138 | 18.1–110.9 |
2.2 Analytical Dose Calculation (XiO) & Monte Carlo simulations (TOPAS)
Dose distributions for patient treatment plans for double-scattered proton therapy at the Francis H. Burr Proton therapy center at the Massachusetts General Hospital are calculated using an ADC algorithm implemented on the XiO treatment planning system (by Computerized Medical Systems Inc., now by ELEKTA). This ADC algorithm is based on a parameterized beam model propagating protons through the patient-specific compensator and patient geometry. The lateral spread is estimated based on a physics model developed by Hong et al. (8) which separates the beam into a central axis part (kernel) and a Gaussian fluence map to accounting for the lateral beam spread. The width of this Gaussian distribution is determined by the scattering angle distribution of the incident beams within the patient and patient-specific treatment head components.
The dose distributions predicted by the planning system were recalculated using TOPAS (TOol for PArticle Simulations, version beta8) (9), which is layered on top of Geant4 (version 9.6.p02) (10). TOPAS has been extensively validated for proton therapy showing agreement with measurements well within clinical requirements for quality assurance purposes (11). TOPAS determines the material composition for each voxel in the patient geometry based on its CT Hounsfield unit following the approach by Schneider et al. (12) as described in detail elsewhere (9, 13, 14). MC simulations start with a realistic beam spot at the treatment head entrance. Subsequently, protons are transported through the treatment head with field-specific beam-shaping devices.
30 statistically independent simulations were performed to simulate each treatment field. Variance reduction techniques were employed as described elsewhere (15). An equivalent of 480 million initial protons were simulated per treatment field leading to a statistical uncertainty in calculated dose of approximately 1% per voxel in the high-dose region. For comparison with the ADC algorithm, the dose-to-water scorer in TOPAS was selected using the treatment-planning CT grid from the ADC-based calculation.
2.3 Analysis methods
To compare the dose distributions calculated by TOPAS and the ADC algorithm, three sets of parameters were investigated: DVH-based indices and a 3-dimensional γ-index (16) to quantify dosimetric differences, and the tumor control probability (TCP) to estimate the clinical impact. The normal tissue complication probability (NTCP) is used to estimate the likelihood of side effects for organs-at-risk (OARs). Generally, the target volume of interest is the clinical target volume (CTV), however, for prostate and liver patients as well as some lung and head-and-neck patients a planning target volume (PTV) was defined instead and consequently used for this analysis.
The following DVH-based indices were considered for the target volumes:
Mean target dose: the dose averaged over all voxels in the target structure
V90: the percentage of the target volume covered by 90% of the prescription dose
D95: the maximum dose that covers 95% of the target volume (used instead of minimum dose to avoid artifacts due to statistical fluctuations)
D50: the median target dose
D02: the maximum dose that covers 2% of the target volume (a surrogate for the maximum dose)
The 3-dimensional γ-index was calculated as described by Clasie et al (17) for the full treatment plan. A voxel-by-voxel analysis with a γ-index criterion of 3%/3mm was used, with the ADC as the reference dose. The percentage of voxels passing the criterion was calculated for both the target volume and the entire patient (defined by the skin contour) for all voxels receiving at least 10% of the mean target dose in the MC-based dose distribution.
For TCP estimation we employed a logistic TCP model (18) using the mean dose. The required parameters D50 and γ50, representing the dose needed for 50% tumor control and the slope of the response curve at that point, were obtained from the literature. The following [D50, γ50] values were applied: breast [56.77, 1.48] (19), head-and-neck [59.3, 2.0] (20), liver [53.0, 1.2] (21), lung [74.5, 3.52] (22), and prostate [75.5, 2.25] (23). All treatment regimens employed have been translated to 2Gy/fraction schedules using the linear-quadratic model with α/β=10Gy for all sites except prostate, where a value of 2Gy was used (24).
Due to the large variability of tumors and surrounding OARs in our patient cohort, we limit the NTCP analysis to the OARs of prostate patients (bladder and anterior-rectum). Prostate patient treatment plans have consistent set-up and OARs in close proximity to the target. We use the Lyman-Kutcher-Burman (LKB) model with parameters for bladder (a=2, m=0.11, TD50=80Gy) and anterior-rectum (a=8.33, m=0.15, TD50=80Gy) (25), TD50 is the dose for 50% probability of damage, m is a parameter to control the slope and a is the exponent in the model equations.
3. Results
3.1 DVH-based analysis
The results for the DVH-based analysis are shown in Figure 1. The difference of the mean dose, D95, D50, D02 and V90 are shown for each target. Each data point represents the relative difference between the analytical and MC-based calculations for one patient, grouped by treatment site. Head-and-neck patients and lung patients show the largest variation in all dose related properties. Breast patients have the largest spread in V90 coverage. For all dosimetric indices the MC values differ less than +1% to −5% from ADC.
Figure 1.
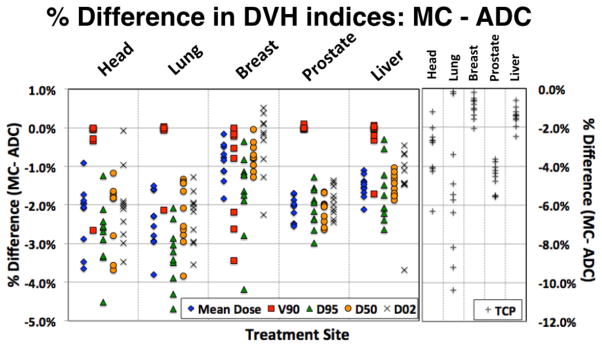
Summary of the dosimetric analysis: percentage difference for five sites and five dosimetric parameters. DXX is the maximum dose covering XX% of the target volume, V90 is the % of the target volume covered by 90% of the prescribed dose, and TCP is the tumor control probability.
The difference of TCP between ADC and MC is shown in the right column of figure 1. The largest differences are seen in lung (up to 10.4%) while the difference in TCP for breast and liver patients is less than 2.5%.
3.2 γ-index analysis
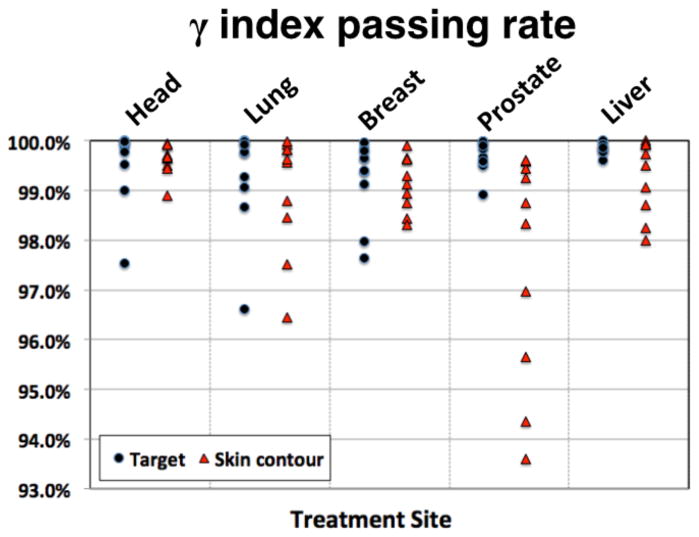
The results from the γ-index analysis are illustrated in figure 2. The passing rate for all target volumes is greater than 96.5% when considering complete treatment plans. For the whole patient, the passing rate for all sites is greater than 93.5%.
Figure 2.
γ-index passing rate with 3%/3mm criteria for all patients for the target volume and whole patient.
3.3 Example patients
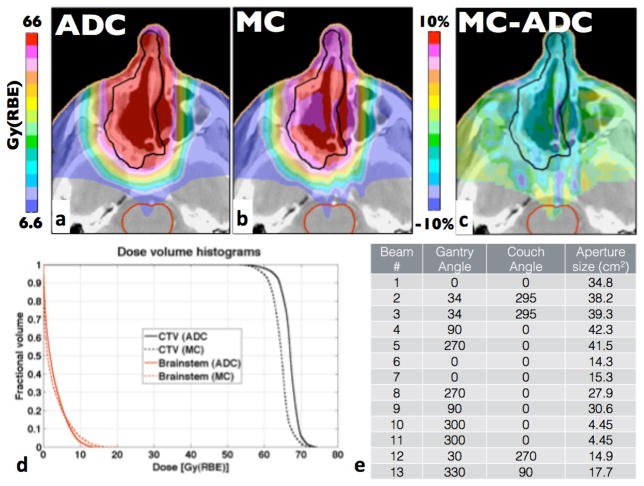
The largest differences outside the lung patient cohort are found in head-and-neck patients. The head-and-neck patient with the largest difference in TCP had a 6.5% lower TCP than predicted by the ADC algorithm. The corresponding MC-based dosimetric indices are 2% to 4.5% lower than for ADC. This patient also had the lowest γ-index passing rate for the target among all patients under study. The dose distributions for this patient, the dose difference and DVHs for the CTV and the brainstem are shown in figure 3. This case is a good example where approximations by ADC become significant. ADCs cannot describe the effects of multiple-Coulomb scattering (MCS) at high-density gradients accurately particularly when such interfaces are parallel to the treatment field direction. For example streaks of over- and underdose can be seen in figure 3c distal to the interface of the nasal septum and air cavities.
Figure 3.
Head-and-neck patient with the lowest γ-index passing rate. The prescription dose for the CTV was 66Gy(RBE). a) and b) show dose distributions for ADC and MC, respectively, c) shows the difference (MC-ADC) and d) displays the DVHs for the CTV and the selected OARs.
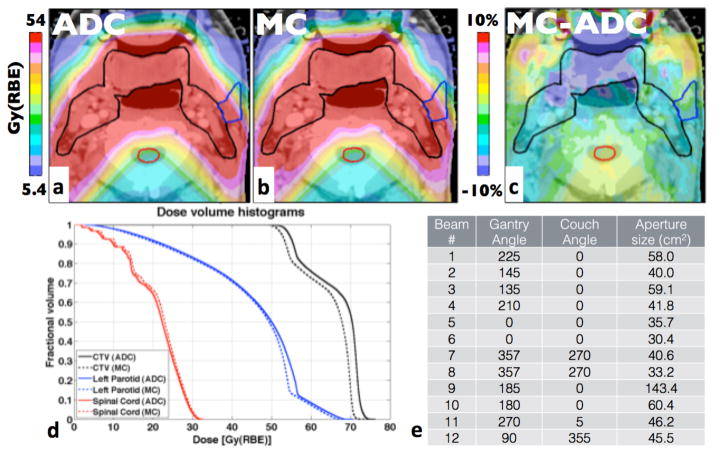
Figure 4 displays the head-and-neck patient with the largest D50 difference (3.7%). The prescribed dose was 54Gy(RBE). The mean dose was 64.5Gy(RBE) due to two fields boosting the smaller gross tumor volume (GTV) to 70Gy(RBE). The target is covered by a total of 12 treatment fields. The largest differences can be observed around the oral cavity. While the γ-index passing rate is 99%, there are large areas in the target region under-dosed by more than 10% of the prescribed dose (5.4Gy(RBE)) compared to the ADC.
Figure 4.
Head-and-neck patients with the largest difference in D50. The prescription dose for the CTV was 54Gy(RBE). a-d as in figure 3.
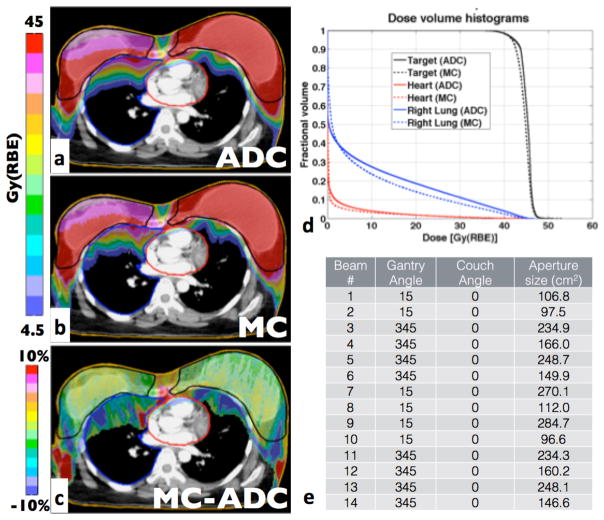
Figure 5 shows the patient with the largest target volume (3,424cc) including both breasts plus the surrounding lymph nodes. All dosimetric indices agree within 2.2%, except for D95, which shows a 3.8% difference. The difference in TCP is 0.5% and the γ-index passing rate is 97.6% for the full target, but decreases to 95.1% for the right breast only. Dose fluctuations occur due to MCS caused by either bone-lung or soft tissue-air interfaces resulting in under-dosed areas in the target or high-dose areas for example on the heart surface. Areas of potential clinical significance are seen inside the target where MC simulations predict doses 10% lower than ADC.
Figure 5.
Largest treatment site: breast patient treated on both breasts. The prescription dose for the CTV was 45Gy(RBE). a-d as in figure 3.
4. Discussion
The ADC algorithm consistently predicts a higher mean dose to the target compared to the MC algorithm. The differences range from <2% (liver, breast), ~2% (prostate) to up to 4% (head-and-neck, lung). All differences for clinically used dosimetric indices are less than 5%. There are two factors that can cause discrepancies between ADC and MC that impact the dose homogeneity in the target, i.e. differences in the overall predicted dose in the high dose region and differences in the predicted range.
Discrepancies in predicted dose are either caused by differences in modeling of the treatment field before the protons reach the patient or when propagating protons inside the patient. Discrepancies occurring before the patient can only be attributed to modeling of particle-propagation through the aperture and the range compensator because both ADC and MC agree with measured dose distributions in water. Previous studies have shown a loss of equilibrium at isocenter for small fields, i.e. small aperture openings (2, 3, 26). Treatments for head-and-neck or lung cancer patients often include small fields. Additionally, a small underestimation of MCS within the aperture and range compensator causes discrepancies in calculated dose increasing with range, resulting in underdose for treatment fields with longer ranges.
Differences in the predicted dose distributions between the two calculation algorithms within the patient are mainly attributed to inaccurate modeling of MCS. This results in a redistribution of dose, in particular when protons are propagated along high-density gradients such as along the nasal septum in figure 3. The most clinically significant differences between the calculation algorithms were seen in lung, where the largest differences in mean dose, D50, D95 and TCP were observed (figure 1). Apart from inaccurate modeling of MCS, the low density of lung tissue is an additional source of discrepancies in these cases due to inaccuracies in dose calculations based on water-equivalent path-lengths (27).
The differences in range are also mainly caused by inaccurate modeling of MCS in the ADC as has previously been investigated (5). We estimated that the margins assigned to proton fields to cover range uncertainties could be reduced for some treatment sites (prostate, liver and whole brain). However, for more heterogeneous treatment sites (head-and-neck, lung and breast) these margins should be increased if generic margins are applied (5). We did find that range margins are sufficient for prostate and liver treatment plans, i.e. the position of the distal 90% dose falloff relative to the prescribed dose (R90) is always outside the target volume. Additional range margins would not improve tumor coverage for these sites. Underdosage in lung patients cannot be prevented by larger range margins either as has been shown elsewhere (27).
Breast treatment fields often contain sections where the planned R90 is within the target volume due to difficulties in plan design. Small differences in R90 can therefore be significant and an increase in range margin might compensate for some of the underdosage we see. However, most regions of underdosage are due to MCS and cannot be prevented by larger margins such as the low-dose regions on the left and right side in the target in figure 5c. Head-and-neck plans are too complex to find a generic distinction between range effects and an overall underdosage of the target region as targets are often covered by multiple fields intentionally stopping inside the target.
For this analysis we investigated full treatment plans, i.e. the combination of multiple treatment fields, which often mitigates the effects of dose calculation uncertainties. The impact on TCP has been estimated using population-derived parameters (19–23, 28–30) and can be seen as a conservative estimate, as the slopes of the dose-response curves are likely steeper for individual patients. Breast fields (short range, large fields, homogeneous target) show very good agreement (<2% difference in mean dose and TCP). Patient geometries for liver treatments are homogeneous with generally larger target volumes and a wide range of treatment depths, resulting in mean dose and TCP differences <2.5%. Lung and head-and-neck patients exhibit highly heterogeneous geometries. Their treatment fields have greatly varying ranges and often consist of multiple fields including smaller ones, resulting in differences of up to 4% in mean dose and up to 6.5% and 11% in TCP for head-and-neck and lung patients, respectively. The differences in TCP for lung show large variations (see figure 1), caused by the diverse spectrum of treatment regimens for this site. Early-stage patients treated with hypo-fractionated regimes receive biologically equivalent doses exceeding 100Gy(RBE), which is in the shoulder region of the TCP curve and insensitive to small changes in target dose. However, patients with high-grade tumors receiving 66Gy(RBE) in 33 fractions are in the steep part of the dose-response curve and dosimetric differences translate into considerable TCP changes.
Prostate treatment fields have the longest range in patients, between 23 and 27 cm. ADC overestimates the mean dose by 1.7%–2.6% in the target region. The small spread of mean dose differences (2.1% ± 0.3%) suggests a systematic source of dose overestimation. The TCP reduction for prostate patients is considerable, 3.5 to 5.5%. This is because the TCP parameters have been estimated from a high-risk patient cohort (23), because low-risk prostate cancer patients are not typical candidates for proton therapy.
The NTCP for bladder was found to be less than 1% for all prostate patients for both calculation methods. The NTCP for the anterior-rectum agreed within 1% for all patients with NTCP<10% (8 out of 10 patients). The remaining two patients had a NTCP of 12.7% and 16.0% and MC predicted a 2% and 2.7% lower NTCP, respectively. Thus, no clinically significant difference in NTCP was observed.
Conclusion
For the patient cohort studied we conclude that ADC algorithms may overestimate target dose by up to 5%. There are two reasons for this overestimation: inaccurate modeling of multiple-Coulomb scattering causing inaccurate predictions of the proton range and inaccurate predictions of the absolute dose. Clinical expansion margins are introduced to compensate for the range uncertainties. As previously shown (5), typically used margins may not always be sufficient to account for range differences in complex patient geometries. The absolute dose is generally overestimated. Our study shows small deviations (<2.5%) in mean dose for homogeneous geometries (breast, liver), up to 2.6% in deep-seated targets (prostate) and up to 5% in complex geometries (head-and-neck, lung). The γ-index analysis showed that the agreement between the two calculation methods is within 3%/3mm for over 96% of voxels in the target.
The goal of radiation therapy is to ensure tumor coverage while minimizing normal tissue irradiation. We found that overall ADC overestimates the delivered dose. Additionally, the inaccurate modeling of MCS can result in local dose fluctuations of over 10% of the prescribed dose both inside and outside of the target. Dose differences can result in large TCP differences for lung (<11%), head-and-neck (<6.5%) and high-grade prostate (<6%). The differences in TCP for breast (< 2.5%) and liver (<2%) were small. NTCP was only investigated for prostate patients, no significant differences were found. We have confirmed that the majority of these effects cannot be compensated for by increasing margins because they are a result of the difficulties of ADCs to correctly predict MCS.
Thus, for complex geometries (head-and-neck, lung) and very deep-seated targets (prostate), advanced dose-calculation methods like MC simulations could be required in clinical trials comparing proton therapy to conventional radiotherapy to avoid biases due to systematic discrepancies in calculated dose distributions.
Summary.
The clinical impact of uncertainties in analytical dose calculations was investigated by comparing dose-volume-histogram based properties, γ-index and tumor control probability for 50 patients from five treatment sites (liver, prostate, breast, head-and-neck, and lung). Significant differences in TCP were found for lung (11%), head-and-neck (6.5%) and prostate (6%). Liver and breast patients showed good agreement (<2.5% discrepancy) between the two algorithms. Predictions of normal tissue complication probability for prostate patients agreed within 3%.
Acknowledgments
This work was supported by NIH/NCI under CA U19 21239.
We would like to thank the MGH Monte Carlo group for many fruitful discussions. We also thank Jonathan Jackson and Tao Song of the Enterprise Research Infrastructure and Services (ERIS) group at Partners Healthcare for their in-depth support and smooth computing cluster operations, upgrades and fixes.
Footnotes
Conflict of interest: none
Publisher's Disclaimer: This is a PDF file of an unedited manuscript that has been accepted for publication. As a service to our customers we are providing this early version of the manuscript. The manuscript will undergo copyediting, typesetting, and review of the resulting proof before it is published in its final citable form. Please note that during the production process errors may be discovered which could affect the content, and all legal disclaimers that apply to the journal pertain.
References
- 1.Paganetti H. Monte Carlo simulations will change the way we treat patients with proton beams today. Br J Radiol. 2014;87:20140293. doi: 10.1259/bjr.20140293. [DOI] [PMC free article] [PubMed] [Google Scholar]
- 2.Bednarz B, Daartz J, Paganetti H. Dosimetric accuracy of planning and delivering small proton therapy fields. Phys Med Biol. 2010;55:7425–7438. doi: 10.1088/0031-9155/55/24/003. [DOI] [PMC free article] [PubMed] [Google Scholar]
- 3.Bueno M, Paganetti H, Duch MA, et al. An algorithm to assess the need for clinical Monte Carlo dose calculation for small proton therapy fields based on quantification of tissue heterogeneity. Med Phys. 2013;40:081704. doi: 10.1118/1.4812682. [DOI] [PubMed] [Google Scholar]
- 4.Soukup M, Alber M. Influence of dose engine accuracy on the optimum dose distribution in intensity-modulated proton therapy treatment plans. Phys Med Biol. 2007;52:725–740. doi: 10.1088/0031-9155/52/3/014. [DOI] [PubMed] [Google Scholar]
- 5.Schuemann J, Dowdell S, Grassberger C, et al. Site-specific range uncertainties caused by dose calculation algorithms for proton therapy. Phys Med Biol. 2014;59:4007–4031. doi: 10.1088/0031-9155/59/15/4007. [DOI] [PMC free article] [PubMed] [Google Scholar]
- 6.Paganetti H. Range uncertainties in proton therapy and the role of Monte Carlo simulations. Phys Med Biol. 2012;57:R99–R117. doi: 10.1088/0031-9155/57/11/R99. [DOI] [PMC free article] [PubMed] [Google Scholar]
- 7.Yang M, Virshup G, Clayton J, et al. Theoretical variance analysis of single- and dual-energy computed tomography methods for calculating proton stopping power ratios of biological tissues. Phys Med Biol. 2010;55:1343–1362. doi: 10.1088/0031-9155/55/5/006. [DOI] [PubMed] [Google Scholar]
- 8.Hong L, Goitein M, Bucciolini M, et al. A pencil beam algorithm for proton dose calculations. Phys Med Biol. 1996;41:1305–1330. doi: 10.1088/0031-9155/41/8/005. [DOI] [PubMed] [Google Scholar]
- 9.Perl J, Shin J, Schuemann J, et al. TOPAS: An innovative proton Monte Carlo platform for research and clinical applications. Med Phys. 2012;39:6818. doi: 10.1118/1.4758060. [DOI] [PMC free article] [PubMed] [Google Scholar]
- 10.Agostinelli S, Allison J, Amako K, et al. Geant4—a simulation toolkit. Nuclear Instruments and Methods in Physics Research Section A: Accelerators, Spectrometers, Detectors and Associated Equipment. 2003;506:250–303. [Google Scholar]
- 11.Testa M, Schuemann J, Lu HM, et al. Experimental validation of the TOPAS Monte Carlo system for passive scattering proton therapy. Med Phys. 2013;40:121719. doi: 10.1118/1.4828781. [DOI] [PMC free article] [PubMed] [Google Scholar]
- 12.Schneider W, Bortfeld T, Schlegel W. Correlation between CT numbers and tissue parameters needed for Monte Carlo simulations of clinical dose distributions. Phys Med Biol. 2000;45:459–478. doi: 10.1088/0031-9155/45/2/314. [DOI] [PubMed] [Google Scholar]
- 13.Paganetti H, Jiang H, Parodi K, et al. Clinical implementation of full Monte Carlo dose calculation in proton beam therapy. Phys Med Biol. 2008;53:4825–4853. doi: 10.1088/0031-9155/53/17/023. [DOI] [PubMed] [Google Scholar]
- 14.Schuemann J, Paganetti H, Shin J, et al. Efficient voxel navigation for proton therapy dose calculation in TOPAS and Geant4. Phys Med Biol. 2012;57:3281–3293. doi: 10.1088/0031-9155/57/11/3281. [DOI] [PMC free article] [PubMed] [Google Scholar]
- 15.Ramos-Méndez J, Perl J, Faddegon B, et al. Geometrical splitting technique to improve the computational efficiency in Monte Carlo calculations for proton therapy. Med Phys. 2013;40:041718. doi: 10.1118/1.4795343. [DOI] [PMC free article] [PubMed] [Google Scholar]
- 16.Low DA, Harms WB, Mutic S, et al. A technique for the quantitative evaluation of dose distributions. Med Phys. 1998;25:656–661. doi: 10.1118/1.598248. [DOI] [PubMed] [Google Scholar]
- 17.Clasie B, Wroe A, Kooy H, et al. Assessment of out-of-field absorbed dose and equivalent dose in proton fields. Med Phys. 2010;37:311. doi: 10.1118/1.3271390. [DOI] [PMC free article] [PubMed] [Google Scholar]
- 18.Schultheiss TE, Orton CG, Peck RA. Models in radiotherapy: volume effects. Med Phys. 1983 doi: 10.1118/1.595312. [DOI] [PubMed] [Google Scholar]
- 19.Okunieff P, Morgan D, Niemierko A, et al. Radiation dose-response of human tumors. Int J Radiat Oncol Biol Phys. 1995;32:1227–1237. doi: 10.1016/0360-3016(94)00475-z. [DOI] [PubMed] [Google Scholar]
- 20.Jeong J, Setton JS, Lee NY, et al. Estimate of the impact of FDG-avidity on the dose required for head and neck radiotherapy local control. Radiother Oncol. 2014;111:340–347. doi: 10.1016/j.radonc.2014.03.018. [DOI] [PMC free article] [PubMed] [Google Scholar]
- 21.Lausch A, Sinclair K, Lock M, et al. Determination and comparison of radiotherapy dose responses for hepatocellular carcinoma and metastatic colorectal liver tumours. Br J Radiol. 2013;86:20130147. doi: 10.1259/bjr.20130147. [DOI] [PMC free article] [PubMed] [Google Scholar]
- 22.Willner J, Baier K, Caragiani E, et al. Dose, volume, and tumor control prediction in primary radiotherapy of non-small-cell lung cancer. Int J Radiat Oncol Biol Phys. 2002 doi: 10.1016/s0360-3016(01)01823-5. [DOI] [PubMed] [Google Scholar]
- 23.Cheung R, Tucker SL, Dong L, et al. Dose-response for biochemical control among high-risk prostate cancer patients after external beam radiotherapy. Int J Radiat Oncol Biol Phys. 2003 doi: 10.1016/s0360-3016(03)00278-5. [DOI] [PubMed] [Google Scholar]
- 24.Vogelius IR, Bentzen SM. Meta-analysis of the alpha/beta ratio for prostate cancer in the presence of an overall time factor: bad news, good news, or no news? Int J Radiat Oncol Biol Phys. 2013;85:89–94. doi: 10.1016/j.ijrobp.2012.03.004. [DOI] [PMC free article] [PubMed] [Google Scholar]
- 25.Burman C, Kutcher GJ, Emami B, et al. Fitting of normal tissue tolerance data to an analytic function. Radiation Oncology Biology. 1991;21:123–135. doi: 10.1016/0360-3016(91)90172-z. [DOI] [PubMed] [Google Scholar]
- 26.Grassberger C, Daartz J, Dowdell S, et al. Quantification of proton dose calculation accuracy in the lung. Int J Radiat Oncol Biol Phys. 2014;89:424–430. doi: 10.1016/j.ijrobp.2014.02.023. [DOI] [PMC free article] [PubMed] [Google Scholar]
- 27.Daartz J, Engelsman M, Paganetti H, et al. Field size dependence of the output factor in passively scattered proton therapy: Influence of range, modulation, air gap, and machine settings. Med Phys. 2009;36:3205. doi: 10.1118/1.3152111. [DOI] [PubMed] [Google Scholar]
- 28.Bentzen SM, Tucker SL. Quantifying the position and steepness of radiation dose-response curves. Int J Radiat Biol. 1997;71:531–542. doi: 10.1080/095530097143860. [DOI] [PubMed] [Google Scholar]
- 29.Boonkitticharoen V. Biologically Equivalent Dose in Construction of Tumor Control Probability Curve for Hepatocellular Carcinoma Treated by Radiotherapy. J Thai Soc Therap Rad Onc. 2011 [Google Scholar]
- 30.Warkentin B, Stavrev P, Stavreva N, et al. A TCP-NTCP estimation module using DVHs and known radiobiological models and parameter sets. J Appl Clin Med Phys. 2004;5:50–63. doi: 10.1120/jacmp.v5i1.1970. [DOI] [PMC free article] [PubMed] [Google Scholar]


