

Abstract
DEAD-box RNA helicases eIF4A and Ded1 are believed to promote translation initiation by resolving mRNA secondary structures that impede ribosome attachment at the mRNA 5′ end or subsequent scanning of the 5′ UTR, but whether they perform unique or overlapping functions in vivo is poorly understood. We compared the effects of mutations in Ded1 or eIF4A on global translational efficiencies (TEs) in budding yeast Saccharomyces cerevisiae by ribosome footprint profiling. Despite similar reductions in bulk translation, inactivation of a cold-sensitive Ded1 mutant substantially reduced the TEs of >600 mRNAs, whereas inactivation of a temperature-sensitive eIF4A variant encoded by tif1-A79V (in a strain lacking the ortholog TIF2) yielded <40 similarly impaired mRNAs. The broader requirement for Ded1 did not reflect more pervasive secondary structures at low temperature, as inactivation of temperature-sensitive and cold-sensitive ded1 mutants gave highly correlated results. Interestingly, Ded1-dependent mRNAs exhibit greater than average 5′ UTR length and propensity for secondary structure, implicating Ded1 in scanning through structured 5′ UTRs. Reporter assays confirmed that cap-distal stem–loop insertions increase dependence on Ded1 but not eIF4A for efficient translation. While only a small fraction of mRNAs shows a heightened requirement for eIF4A, dependence on eIF4A is correlated with requirements for Ded1 and 5′ UTR features characteristic of Ded1-dependent mRNAs. Our findings suggest that Ded1 is critically required to promote scanning through secondary structures within 5′ UTRs, and while eIF4A cooperates with Ded1 in this function, it also promotes a step of initiation common to virtually all yeast mRNAs.
In translation of most eukaryotic mRNAs, the initiation codon is selected by the scanning mechanism, wherein a 43S preinitiation complex (PIC) containing methionyl initiator tRNA (tRNAi) attaches to the capped 5′ end of mRNA and scans the 5′ UTR for an AUG codon. PIC attachment to the mRNA is stimulated by eIF4F, comprised of cap-binding protein eIF4E, DExD/H-box helicase eIF4A, and scaffold subunit eIF4G, which stimulates eIF4A's ATP-dependent RNA helicase activity (Rogers et al. 2002; Schutz et al. 2008). Activation of eIF4A is expected to generate single-stranded RNA to facilitate ribosome binding, and mRNAs with more structured 5′ UTRs display a greater requirement for eIF4A/eIF4F (Blum et al. 1992; Svitkin et al. 2001; Pestova and Kolupaeva 2002; Mitchell et al. 2010). Interaction of eIF4G with components of the 43S complex, eIF3, eIF5, or eIF1, is thought to facilitate recruitment of the PIC to cap-bound eIF4F (for review, see Hinnebusch 2014).
As might be expected, eIF4F and ATP hydrolysis are dispensable in reconstituted systems for assembly of 48S PICs at the AUG codon on synthetic mRNAs with unstructured 5′ UTRs but are required with native mRNAs (Pestova et al. 1998; Pestova and Kolupaeva 2002; Mitchell et al. 2010). Moreover, inactivating eIF4A in mammalian extracts decreased translation of reporter mRNAs with cap-proximal structures by impairing eIF4F binding to mRNA and reducing 43S-mRNA attachment. However, translation of mRNAs devoid of structures was also reduced (Svitkin et al. 2001); similarly, translation of reporter mRNAs with only 8-nt-long 5′ UTRs was impaired in yeast extracts containing defective eIF4A variants (Blum et al. 1992). Thus, eIF4A helicase activity might be needed to dissociate RNA-RNA interactions other than stable stem–loops (SLs) or resolve mRNA-protein interactions in the 5′ UTR for efficient PIC attachment. Indeed, eIF4A is essential in yeast even though the 5′ UTRs of most yeast mRNAs are relatively short and devoid of highly stable, well-defined SLs (Ringner and Krogh 2005; Lawless et al. 2009; Kertesz et al. 2010; Wan et al. 2012; Rouskin et al. 2014).
In mammalian reconstituted systems, eIF4A can facilitate scanning through a SL of moderate stability distal from the cap (Pestova et al. 1996). Other DExD/H helicases, DHX29 and yeast Ded1 (the ortholog of mammalian DDX3X), were required with SLs of higher stability (Pisareva et al. 2008; Abaeva et al. 2011), although none (DHX29, DDX3X, or yeast Ded1) could substitute for eIF4F for 48S PIC assembly on beta-globin mRNA. Thus, it appeared that DHX29 and DDX3X/Ded1 specifically stimulate scanning through secondary structures, whereas eIF4F enhances both PIC attachment and scanning but is less effective in resolving strong SLs (Abaeva et al. 2011). In yeast cells, a ded1 mutation had a stronger effect than an eIF4A mutation (tif1-A79V in a strain lacking TIF2) on translation of a reporter harboring a long 5′ UTR (Berthelot et al. 2004), and a ded1 mutation impaired scanning through a SL located distal to the 5′ cap (Chiu et al. 2010). On the other hand, inactivation of Ded1 in yeast (Chuang et al. 1997) or knock-down of DHX29 in mammalian cells (Parsyan et al. 2009) impairs bulk translation, suggesting that DHX29 and Ded1 are not dedicated solely to mRNAs with strong, cap-distal secondary structures that impede scanning. The role of mammalian DDX3X in translation is not well understood (Lai et al. 2008; Lee et al. 2008), although recent work indicates that it resolves cap-proximal structures, possibly to facilitate eIF4F binding to the mRNA (Soto-Rifo et al. 2012), but it also can promote joining of 60S subunits to 48S PICs independent of helicase activity (Geissler et al. 2012).
DDX3X and Ded1 can function as translational repressors when present at abnormally high concentrations. Overexpressed DDX3X functioned as an inhibitory eIF4E-binding protein that competes with eIF4G for eIF4F assembly (Shih et al. 2008). Ded1 overexpression impairs yeast cell growth and induces assembly of stress granules; and excess Ded1 inhibits translation in cell extracts at the step of 48S PIC assembly. These inhibitory activities do not require Ded1 helicase activity. It was suggested that Ded1 interacts with eIF4G to assemble messenger ribonucleoprotein particles (mRNPs) that accumulate in stress granules and subsequently activates repressed mRNPs under favorable growth conditions through its helicase activity (Hilliker et al. 2011). Whereas Ded1 function in stimulating bulk translation is well established (Chuang et al. 1997; de la Cruz et al. 1997), it has not been shown that inactivating yeast Ded1 de-represses translation of mRNAs in unfavorable growth conditions. Clearly, additional work is needed to define the in vivo functions of Ded1 and DDX3X.
In this study, we sought to determine whether eIF4A and Ded1 perform largely overlapping functions or, rather, have distinct activities in stimulating translation initiation in living yeast cells. To this end, we conducted genome-wide ribosomal profiling (Ingolia et al. 2009) of Saccharomyces cerevisiae mutants defective for one or the other helicase under conditions where bulk translation is reduced, but not abolished, and identified mRNAs whose translational efficiencies are impaired to the greatest extent in each mutant.
Results
Ribosome footprint profiling of ded1 mutants reveals sizable fractions of genes particularly dependent on Ded1 for efficient translation
To determine the relative importance of eIF4A and Ded1 in translation of different mRNAs, we constructed isogenic yeast strains containing the cold-sensitive (Cs−) allele ded1-120, encoding amino acid substitutions of Gly108/Gly494 with Asp (G108D/G494D), or the temperature-sensitive (Ts−) allele ded1-952 (encoding substitutions T408I/W253R) as the only source of Ded1. G494D likely impairs conserved subdomain VI function in ATP binding or hydrolysis, whereas T408I in subdomain IV probably affects RNA binding (Linder and Jankowsky 2011). (Henceforth, these alleles are referred to as ded1-cs and ded1-ts.) We also constructed a strain lacking both chromosomal genes encoding eIF4A (TIF1/TIF2) and harboring the Ts− allele tif1-A79V as the only source of eIF4A (tif1-ts), which confers a slow-growth phenotype (Slg−) at 30°C and lethality at 37°C. The location of A79V between subdomains Ib and Ic might indicate a defect in RNA binding (Linder and Jankowsky 2011). The growth defects of all three mutants were fully complemented by the wild-type (WT) alleles on plasmids (Supplemental Fig. S1A–C).
To identify culture conditions that evoke comparable levels of translational inhibition in the mutants, polysome profiles were determined after shifting cultures to nonpermissive temperatures for different periods of time. For ded1-cs cells, marked dissociation of polysomes and accumulation of 80S monosomes were apparent after 10 min at 15°C, with the polysome:monosome (P/M) ratio reduced by ∼77% compared to that seen in WT cells (Supplemental Fig. S1D). ded1-ts confers a relatively less severe defect, with a 2-h shift to 37°C required to reduce the P/M ratio by ∼63% (Supplemental Fig. S1E). The P/M ratios of the ded1 mutants at the permissive temperature were similar to those for the corresponding DED1+ transformants (data not shown). For tif1-ts, the P/M ratio is ∼75% below WT during continuous culture at 30°C (Supplemental Fig. S1F), consistent with its Slg− phenotype at this temperature (Supplemental Fig. S1C); the P/M ratio was diminished further, for an ∼83% reduction of the WT ratio, after 1 h at 37°C (Supplemental Fig. S1G).
We conducted ribosome profiling of the ded1 and tif1 strains and their WT counterparts under the conditions described in Supplemental Figure S1. Given that total polysomes are diminished in the mutants, the absolute translation efficiencies (TEs) of most mRNAs will be reduced in the mutant cells, but these reductions are masked by normalization to total ribosome footprint reads for each strain, such that changes in TE are calculated relative to all mRNAs. Those mRNAs exhibiting reductions in relative TE in mutant versus WT cells display a greater than average dependence on Ded1 or eIF4A for efficient translation in WT cells, whereas mRNAs exhibiting increased TE in the mutant show a lower than average dependence on the helicase. Both ribosome footprinting and RNA-seq results were highly reproducible between biological replicates for each strain (Pearson's r ≈ 0.99) (Supplemental Fig. S2A–D). A scatterplot comparing ribosome footprint data between ded1-cs and WT cells revealed a population of genes with substantially altered translation in the mutant (Fig. 1A; red dots indicating >twofold deviation from identity), whereas RNA-seq data showed far fewer differences in mRNA abundance between the two strains (Fig. 1B), indicating widespread alterations in TE in ded1-cs cells (Fig. 1C).
Figure 1.

ded1-cs and ded1-ts mutations evoke genome-wide changes in relative TE values for substantial fractions of genes that overlap significantly. (A,B) Scatterplots of normalized read densities expressed as number of reads mapping to gene coding sequences normalized by coding sequence length and by total number of reads for that sample. (A) Ribosome footprint density and (B) mRNA density for ded1-cs (NSY5) versus WT (NSY4) strains. (C) Scatterplot of translational efficiencies (TEs) between WT and ded1-cs. Eight-hundred fourteen genes exhibiting ≥twofold changes in TE in ded1-cs cells at FDR < 0.01 are in red. (D) Same as C for WT (NSY10) versus ded1-ts (NSY11) strains; 336 genes with ≥twofold change in TE in ded1-ts cells at FDR < 0.01 colored red. (E) Smooth scatterplot of log2ΔTE values for 4696 expressed genes for ded1-ts versus ded1-cs strains, excluding genes with log2ΔTE >6 or <−6. Black line: determined regression line; gray line: theoretical regression line for identical changes in ΔTE values. Plot was generated using R smoothscatter function with 128 color bins and kernel density estimate. The red to green gradient indicates density of data points. (F) Venn diagram of overlap between genes exhibiting ≥twofold reductions in TE in the two ded1 mutants.
Analysis of statistically significant changes in ribosome footprint or RNA-seq values revealed mRNA-specific changes in TE as the major consequence of reduced Ded1 activity. Ribosome footprint density was found to be significantly increased or decreased for 1026 of 4918 expressed genes analyzed (21%), whereas mRNA abundance levels were significantly changed for only 102 of 1026 affected genes. Integrating ribosome footprint and RNA-seq data revealed that 814 genes (∼17% of expressed genes) displayed a change in TE in ded1-cs versus WT cells (ΔTEded1-cs = TEded1-cs/TEWT) of a factor of ≥2 with a false-discovery rate (FDR) of <0.01. A majority of these genes (617/814) displayed a reduction in TE in the mutant (Supplemental File S1), indicating that >10% of all genes exhibit a heightened dependence on Ded1 for efficient translation at 15°C.
Considering that RNA secondary structures should be more pervasive at lower temperatures, we asked whether Ded1 is also important for robust translation of many genes at elevated growth temperature by profiling the ded1-ts mutant shifted to 37°C (Supplemental Fig. S3A–D). A smaller fraction of all genes exhibited significant changes in TE in the ded1-ts mutant versus the ded1-cs strain (cf. Fig. 1D and 1C): Of 336 genes displaying a ΔTEded1-ts of ≥twofold, 228 (6.3% of expressed genes) were translated less efficiently in the mutant versus WT cells (Supplemental File S2). Nevertheless, there is extensive overlap between the genes exhibiting altered TE in ded1-ts versus ded1-cs cells, as the ΔTEded1-ts and ΔTEded1-cs values for all genes are significantly correlated (Pearson's r = 0.48, P < 0.0001) (Fig. 1E). Moreover, the majority (76%) of genes exhibiting ≥twofold reductions in TE in ded1-ts cells were similarly down-regulated in the ded1-cs strain (Fig. 1F). Consistent with the relative effects of the two mutations on bulk translation (Supplemental Fig. S1D,E), the magnitude of ΔTE values genome-wide is greater for ded1-cs versus ded1-ts cells, as revealed by a slope <1 for the trend-line of the scatterplot ΔTEded1-ts versus ΔTEded1-cs (Fig. 1E). Thus, a sizable fraction of genes display a marked dependence on Ded1 for efficient translation at both elevated and reduced growth temperatures.
Ribosome footprint profiling reveals only a small fraction of genes particularly dependent on eIF4A for efficient translation
Ribosome profiling of the tif1-ts mutant and isogenic WT strain cultured continuously at 30°C, and following a shift from 30°C to 37°C (Supplemental Fig. S4A–H), gave results distinct from those described for ded1 mutants. At 30°C, 211 genes displayed significantly altered ribosome densities (55 genes decreased and 156 genes increased) in the tif1-ts mutant versus WT strain, but most of these changes were accompanied by a corresponding change in mRNA abundance (Supplemental File S3). On a shift to 37°C, ribosome density was significantly altered in the tif1-ts mutant for 123 genes, and this alteration occurred at the translational level for roughly half (68 genes with >twofold change in TE at FDR < 0.01), of which only 36 (0.72% of all expressed genes) displayed a significant reduction in TE (Fig. 2A). Thus, in contrast to results above for Ded1, only a small proportion of genes display a substantially greater than average dependence on eIF4A for efficient translation at 37°C.
Figure 2.

A significant number of genes require both Ded1 and eIF4A for WT translation. (A) Scatterplot of TE of tif1-ts versus WT cells at 37°C, with 68 genes showing a ≥twofold change in the mutant at FDR < 0.01, colored red. (B) Venn diagram of genes exhibiting ≥twofold reductions in tif1-ts (at 37°C) and ded1-cs strains. (C) Smooth scatterplot of the indicated log2 ΔTE values, generated as in Figure 1E. (D) Hierarchical clustering analysis of absolute ΔTE values for 4696 expressed genes from the indicated mutant versus WT comparisons (excluding genes with >64-fold changes in TE) as a heat map using the R heatmap.2 function from the R “gplots” library, using the default hclust hierarchical clustering algorithm.
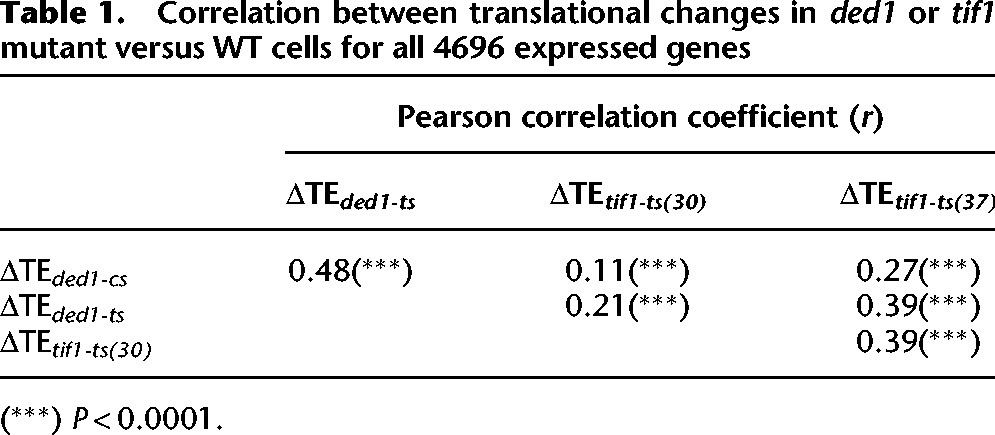
Twelve of the 36 genes whose TE was decreased by >twofold in tif1-ts cells at 37°C were similarly affected in ded1-cs cells (Fig. 2B), which is ∼2.5-fold higher than the ∼five such genes expected from chance alone (36·[605/4696] = 4.6). Furthermore, analysis of all expressed genes revealed that the ΔTE values for tif1-ts versus WT cells at 37°C (ΔTEtif1-ts(37)) are significantly correlated with ΔTE values for both ded1-cs cells and ded1-ts cells (r values of 0.27 and 0.39, respectively) (Fig. 2C; Table 1). However, the magnitude of TE changes genome-wide is considerably larger in ded1-cs versus tif1-ts cells (Fig. 2C). The degree of functional overlap between Ded1 and eIF4A is illustrated by the gene clustering analysis in Figure 2D. Among major clusters discerned, clusters 1–3 tend to show increased TEs, while clusters 7–9 generally exhibit reduced TEs in the two ded1 mutants and tif1-ts cells. In contrast, genes in clusters 4–6 display differential responses in different mutants. Together, our results indicate that (1) there are many genes that display a greater than average requirement for both Ded1 and eIF4A and are affected to a greater extent by inactivating Ded1 versus eIF4A; but also that (2) many genes have a greater than average dependence on one helicase but not the other; and (3) only a small fraction of genes exhibit a strong dependence on eIF4A. To account for these conclusions, we propose that most mRNAs exhibit a similar dependence on eIF4A for binding eIF4F or PIC attachment to the mRNA 5′ end, while a sizable proportion are unusually dependent on Ded1 because they harbor secondary structures that impede scanning, which are resolved primarily by Ded1 with auxiliary contributions from eIF4A.
Table 1.
Correlation between translational changes in ded1 or tif1 mutant versus WT cells for all 4696 expressed genes
The 5′ UTRs of Ded1-dependent mRNAs are atypically long with greater than average propensity for secondary structure
A prediction of our interpretation is that Ded1-dependent mRNAs should exhibit distinctive structural features that impede scanning and are resolved by the Ded1 helicase function. To test this, we interrogated the 5′ UTRs of Ded1-dependent mRNAs using a compilation of 5′ UTR lengths and propensities for secondary structure for 3000 yeast genes (Kertesz et al. 2010). Interestingly, the 328 genes with a ≥twofold reduction in TE in ded1-cs cells (for which 5′ UTRs were compiled) exhibit a mean 5′ UTR length of 149 nt, substantially greater than the mean 5′ UTR length of 79 nt calculated for all 2593 compiled genes examined in our study (P < 0.0001) (Fig. 3A). Moreover, the 129 genes (out of 197 compiled) displaying a ≥twofold increase in TE in ded1-cs cells have a mean 5′ UTR length of only 45 nt, significantly smaller than the genome-average 5′ UTR length (P < 0.0001) (Fig. 3A). Thus, mRNAs with greater than average dependence on Ded1 tend to have atypically long 5′ UTRs.
Figure 3.
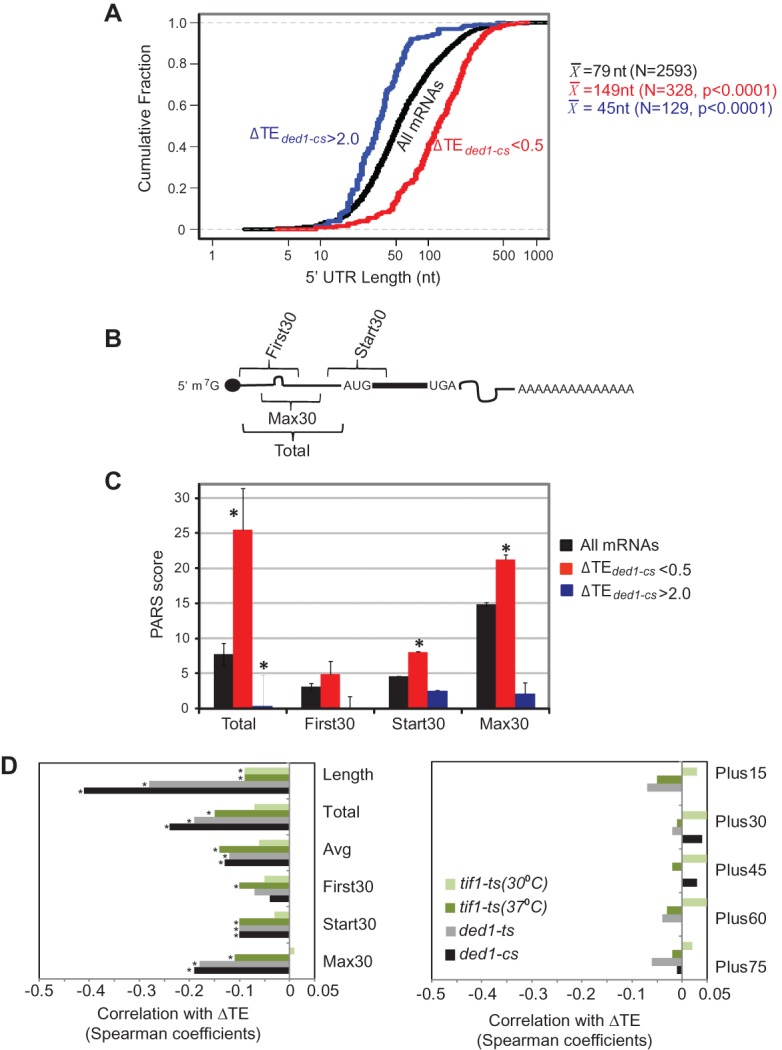
5′ UTRs of Ded1-dependent genes exhibit greater than average length and PARS scores. 5′ UTR features of genes with ≥twofold reductions in TE in ded1-cs cells, for genes curated by Kertesz et al. (2010). (A) Cumulative distributions of 5′ UTR lengths for all 2593 genes, or genes of indicated ΔTE values, with mean lengths (X) for the indicated number of genes (N). P-values of Student's t-tests for statistical significance of the differences between mean lengths for Ded1-dependent genes and genome-average length (79 nt) are shown. (B) Schematic showing 5′ UTR intervals assigned for calculating cumulative PARS scores. (C) Average PARS scores calculated for the indicated gene set for each 5′ UTR interval described in B. (*) P < 0.05. (D) Genome-wide changes in TE are negatively correlated with 5′ UTR length and PARS scores in ded1 and tif1 mutants. Spearman correlation coefficients of ΔTE values in the indicated mutant versus WT cells for the 5′ UTR features described in B and the text. Coefficients with significance levels of P < 10−16 are indicated with asterisks.
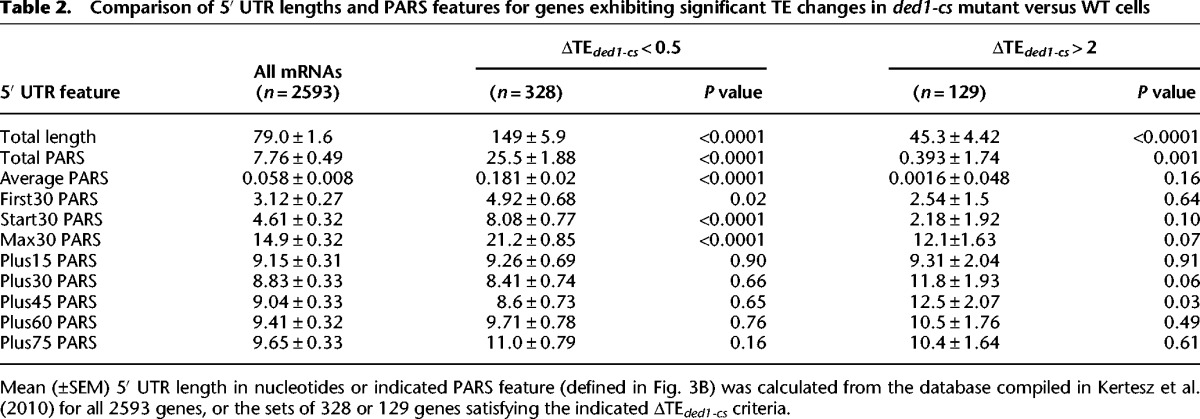
To determine whether Ded1-dependence is associated with elevated secondary structure, we interrogated the same data set (Kertesz et al. 2010) wherein each transcribed nucleotide in 3000 different yeast transcripts was assigned a “parallel analysis of RNA structure” (PARS) score, based on its susceptibility in yeast mRNA reannealed in vitro to digestion with nucleases specific for single-stranded or double-stranded RNA, with a higher PARS score denoting a higher frequency of residing in double-stranded conformation. For each transcript we examined: sum of PARS scores for all 5′ UTR nucleotides (Total PARS); average PARS score over the 5′ UTR (Avg PARS); sum of PARS scores for the first 30 nt (First30 PARS); sum of PARS scores for 30 nt surrounding the start codon (for genes with a 5′ UTR of ≥15 nt; Start30 PARS); and highest total PARS score measured in any 30-nt window sliding across the 5′ UTR (Max30 PARS) (Fig. 3B). We also tabulated PARS scores downstream from the AUG, including intervals +1 to +30 (Plus15), +16 to +45 (Plus30), +31 to +60 (Plus45), +46 to +75 (Plus60), and +61 to +90 (Plus75).
Remarkably, for 328/617 genes annotated with PARS scores and displaying ΔTEded1-cs < 0.5, all 5′ UTR PARS features, but none for coding sequences, were significantly greater than the genome averages for all 2593 transcripts in the PARS database (Fig. 3C; Table 2, cf. columns 2 and 3). In contrast, for 129 genes with ΔTEded1-cs > 2, none of the PARS features were atypical except that the 5′ UTR Total PARS score was considerably lower than the genome average (Fig. 3C; Table 2, cf. columns 2 and 5). Similar conclusions were reached from genome-wide analysis of correlations between ΔTE and 5′ UTR length or PARS features in ded1-cs cells, as significant Spearman (negative) correlation coefficients were observed for all 5′ UTR features except for the First30 PARS score (Fig. 3D, left, black bars) but for none of the coding sequence features (Fig. 3D, right, black bars). The strongest negative correlations with ΔTEded1-cs values were for length, Total PARS, and Max30 PARS scores of 5′ UTRs (Fig. 3D, left). Analysis of genes showing ΔTEded1-ts < 0.5 (Supplemental Table S1) and genome-wide correlation analyses conducted for the ded1-ts mutant revealed similar conclusions (Fig. 3D, gray bars). These findings suggest that 5′ UTR length and propensity for secondary structure make significant contributions to changes in TE evoked by ded1-cs and ded1-ts mutations.
Table 2.
Comparison of 5′ UTR lengths and PARS features for genes exhibiting significant TE changes in ded1-cs mutant versus WT cells
For tif1-ts cells at 37°C, significant but weaker negative correlations were observed between ΔTE values and all 5′ UTR parameters, with the strongest correlations for total PARS, average PARS, and Max30 PARS scores (Fig. 3D, dark olive). ΔTE values for tif1-ts cells at 30°C displayed even weaker negative correlations with these same three 5′ UTR features (Fig. 3D, lime). Thus, a propensity for secondary structure in the 5′ UTR is a significant determinant of diminished TE evoked by impairing eIF4A function, but this characteristic is less predictive of changes in TE than is the case with comparable reductions in Ded1 activity.
Interestingly, as described in Supplemental Figure S5, gene ontology (GO) analysis of genes exhibiting reduced TE in ded1 or tif1 mutants indicated that Ded1, but not eIF4A, is particularly important for efficient translation of certain genes involved in cell growth, polarity, or morphogenesis; whereas a group of genes concerned with DNA topology, DNA damage response, chromosome structure, or mitotic recombination display a diminished dependence on eIF4A.
Identification of 5′ UTRs that confer Ded1 dependence
We next sought to identify genes for which sequences conferring unusual dependence on Ded1 are confined to the 5′ UTR by fusing promoters and 5′ UTRs of candidate genes to firefly luciferase coding sequences (FLUC) and a truncated version of the 3′ UTR of yeast RPL41A (Fig. 4A). Eleven candidate genes were examined that exhibit a >threefold decrease in TE as well as abundant mRNA levels that do not change appreciably in ded1-cs cells. We also included three genes identified in a recent genome-wide analysis of stable secondary structures in yeast cells containing well-defined SL structures confined to the 5′ UTR: SFT2, PMA1, and PCL5 (Rouskin et al. 2014), which displayed ΔTEded1-cs values of ∼0.25–0.3. As controls, LUC reporters were constructed for eight genes whose TEs were either not substantially reduced, or increased, in the ded1-cs mutant. Luciferase expression was assayed after incubating the ded1-cs mutant and WT transformants at 23°C, where ded1-cs cells continue to divide but exhibit a slow-growth phenotype. (We chose continuous culture at a semipermissive temperature versus shift to the nonpermissive temperature of 15°C to overcome the complication of detecting luciferase produced in mutant cells in the permissive condition. Whereas dilution of the pre-existing luciferase would be prevented by cessation of cell division at 15°C, it would occur at 23°C where mutant cells still divide.)
Figure 4.
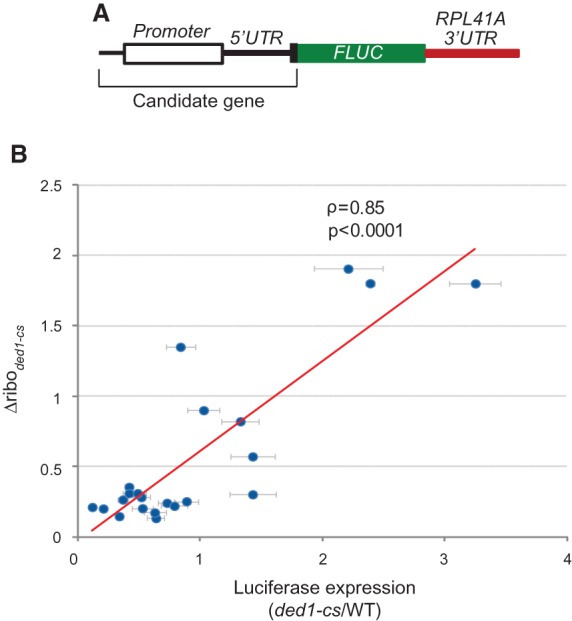
Identification of 5′ UTRs sufficient to confer Ded1 dependence of LUC reporter expression. (A) Schematic of reporters containing promoter, 5′ UTR, and first 20 codons of candidate genes, fused to firefly luciferase coding sequences (FLUC) and a modified RPL41A 3′ UTR. (B) Changes in ribosome density of the 22 candidate genes (from ribosome footprints) in ded1-cs versus WT cells plotted against the ratio of LUC expression in ded1-cs versus WT for corresponding reporters. Strains were grown in SC−Leu−Ura at 30°C, diluted to OD600∼0.1, and grown for ∼three doublings at 23°C (∼18 h for ded1-cs and ∼10 h for WT). Luciferase activities were assayed in whole cell extracts (WCE), normalized to total protein, and reported in relative light units (RLUs) per mg of protein, as means (±SEM) determined from six transformants.
We observed a significant reduction in LUC expression in the ded1-cs mutant for 12 of 14 reporters containing 5′ UTRs of Ded1-dependent genes, including PMA1 and PCL5 that harbor defined SLs in their 5′ UTRs, whereas none of the control reporters exhibited a significant decrease, and several displayed increased LUC expression in ded1-cs versus WT cells (Supplemental Table S2). A plot of the changes in LUC expression against changes in ribosome density reveals significant correlation between these parameters (Fig. 4B). However, six of the 14 reporters for Ded1-dependent genes displayed reductions in LUC expression in ded1-cs cells considerably smaller than the reductions in ribosome density observed for the corresponding native genes (YPR159W, YNL101W, YIL090W, YDL145C, YML035C, and YBL102W ) (Supplemental Table S2). One possible explanation for this discrepancy is that Ded1 function is relatively less impaired in ded1-cs cells at the 23°C temperature used for reporter assays versus the 15°C temperature used for ribosome profiling (data not shown). In fact, 5/6 Ded1-dependent genes showing the least correspondence between LUC expression and ribosome density have relatively low Total PARS and Max30 PARS scores compared to other Ded1-dependent genes subjected to reporter analysis (Supplemental Table S2), such that Ded1 function remaining at 23°C in ded1-cs cells might be sufficient to overcome the moderately stable structures formed by these 5′ UTRs. Another possibility is that the 5′ UTRs of some of these mRNAs could engage in long-range interactions with their CDS or 3′ UTRs, forming inhibitory structures that would be absent in the corresponding LUC reporter constructs. These interactions might be underrepresented in PARS analysis of purified mRNAs folded in vitro if they are stimulated in vivo by eIF4G interactions with poly(A)-binding protein that juxtapose mRNA 5′ and 3′ ends.
Ded1 is critically required for scanning through a cap-distal SL structure
Our ribosomal profiling results indicated that 5′ UTRs of mRNAs displaying strong Ded1 dependence tend to be atypically long and conducive to secondary structure. Previous studies indicated that inactivation of Ded1 in yeast cells reduces translation of reporter constructs containing long 5′ UTRs (Berthelot et al. 2004) or harboring a SL insertion (Chiu et al. 2010); however, the relative contributions of length and secondary structure, and the importance of SL position in the 5′ UTR, were unclear. Hence, we assayed a panel of LUC reporters in which the length of an unstructured 5′ UTR and position and stability of SL insertions were varied systematically, using the same strains and semipermissive growth conditions as above. The reporters contain the promoter, the 22-nt 5′ UTR, and the first four codons of RPL41A fused to LUC and the truncated RPL41A 3′ UTR, with CAA repeats inserted into the 5′ UTR to vary its length without increasing secondary structure. Sequences capable of forming SLs of varying stabilities were inserted into the construct with a 91-nt 5′ UTR, 7 nt or 55 nt from the mRNA 5′ end (Fig. 5A,B). As 43S PICs protect ∼45 nt of mRNA (Kozak and Shatkin 1977; Lazarowitz and Robertson 1977), the cap-proximal SLs inserted 7 nt from the 5′ end should inhibit 43S PIC attachment, whereas cap-distal SL insertions at 55 nt should inhibit scanning through the 5′ UTR without impeding 43S attachment.
Figure 5.
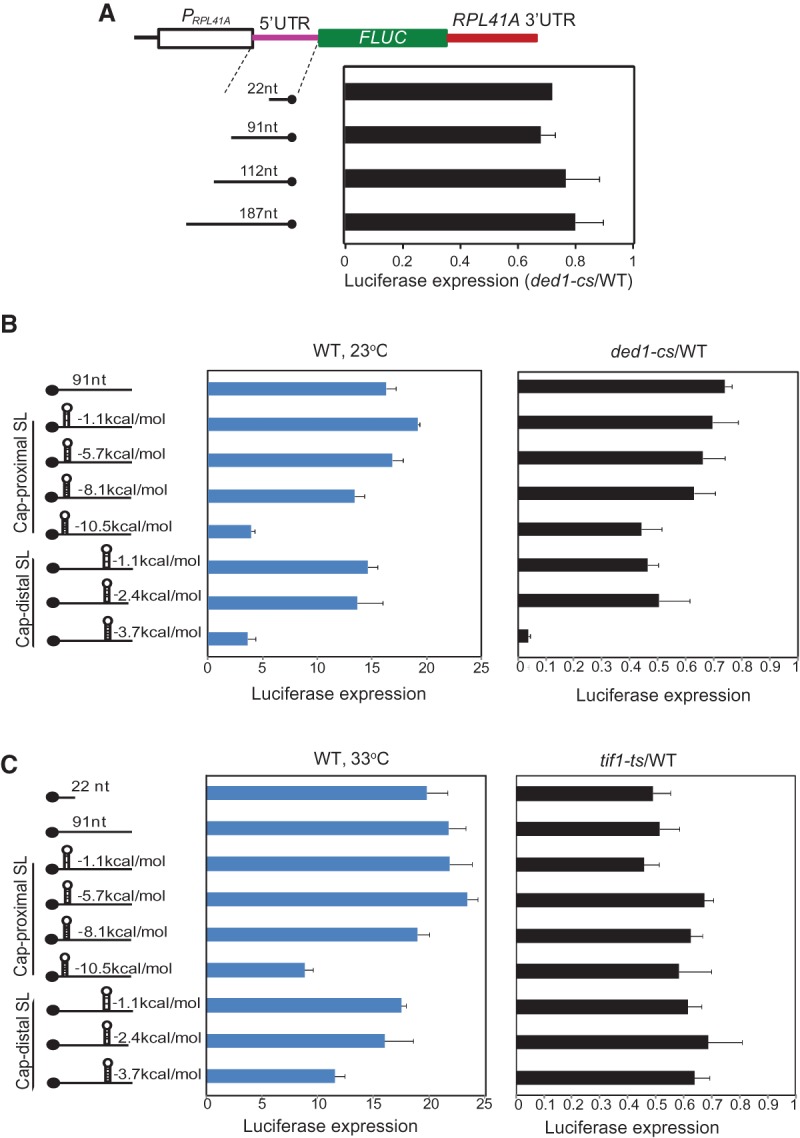
Cap-distal, but not cap-proximal, SL insertion confers strong Ded1 dependence on LUC reporter expression. (A) Schematics of LUC reporters containing promoter, 22-nt 5′ UTR, and first four codons of RPL41A fused to FLUC coding sequences and modified RPL41A 3′ UTR, plus indicated 5′ UTR insertions of CAA repeats. LUC expression was assayed as in Figure 4B and mean (±SEM) ratios of expression in ded1-cs versus WT cells are plotted. (B) Schematics to indicate the position and stability of SLs (predicted at http://rna.urmc.rochester.edu/RNAstructure.html) inserted into the 91-nt 5′ UTR reporter in A. LUC expression was assayed as in Figure 4B; and mean (±SEM) expression (in million units) in WT (middle) and ratios of expression in ded1-cs versus WT cells (right) are plotted. (C) Same as B except that LUC expression was measured in three transformants of WT and tif1-ts by preculturing in SC−Leu−Ura at 23°C, diluting to OD600∼0.1, and growing for ∼three doublings at 33°C (∼24 h for tif1-ts and ∼6 h for WT).
Increasing the 5′ UTR length from 22 nt to 187 nt had little effect on LUC expression in WT cells, and expression of all four reporter constructs of this category was reduced in ded1-cs cells by similar amounts, to ∼80% of the WT level (Fig. 5A), indicating that lengthening the 5′ UTR per se does not increase Ded1 dependence. A cap-distal insertion of moderate predicted stability (−3.7 kcal/mol) drastically inhibited luciferase expression in WT cells, whereas a cap-proximal insertion of higher predicted stability (−10.5 kcal/mol) was required for a comparable reduction in reporter expression (WT, 23°C) (Fig. 5B). Remarkably, the −3.7 kcal/mol cap-distal insertion conferred a strong requirement for Ded1, greatly reducing the ded1-cs/WT expression ratio, whereas the −10.5 kcal/mol cap-proximal insertion produced a small increase in Ded1 dependence comparable to that seen for cap-distal insertions of lower predicted stabilities (Fig. 5B, rightmost panel). These findings suggest that Ded1 is more critically required for translation of an mRNA harboring a cap-distal SL versus one with a cap-proximal SL, consistent with a greater requirement for Ded1 in scanning through secondary structures versus 43S attachment near the 5′ end. The tendency for Ded1-dependent genes to have longer than average 5′ UTRs might partly reflect the fact that longer 5′ UTRs have greater numbers of nucleotides capable of forming structures that impede scanning.
To confirm that the reduced LUC expression in ded1-cs cells conferred by the −3.7 kcal/mol cap-distal SL reflected diminished translation initiation, we determined the distribution of this “SL-mRNA” between polysomes, monosomes, 40S subunits, and free mRNPs resolved by sedimentation of whole cell extracts (WCE) through sucrose density gradients. Cells were treated with formaldehyde prior to harvesting to fix 48S PICs and polysomes and prevent their dissociation during sedimentation. As expected, total polysomes were depleted in the ded1-cs mutant compared to WT (Fig. 6A), and the reporter mRNA containing the extended 5′ UTR but no SL insertion was associated with large polysomes in both the mutant and WT but shifted somewhat toward smaller polysomes in the ded1-cs mutant (Fig. 6B, left). In both WT and ded1-cs cells, the SL-mRNA was shifted to smaller polysomes, monosomes, and 48S PICs compared to the no-SL mRNA (Fig. 6B, cf. right and left panels), in accordance with reduced expression of the SL-containing reporter in both strains (Fig. 5B). Importantly, the proportion of SL-mRNA in large polysomes is decreased with an attendant increase in the proportion present in the 48S fraction in ded1-cs versus WT cells (Fig. 6B, right). This shift in distribution is consistent with reduced translation and accumulation of the SL-mRNA in 48S intermediates with a scanning PIC stalled at the SL insertion. As described in Supplemental Figure S6, omitting formaldehyde fixation led to accumulation of SL-mRNA at the top of gradient instead of the 48S region for the ded1-cs extracts, ruling out accumulation of free mRNP versus 48S PICs in the experiment of Figure 6B.
Figure 6.

Inactivation of Ded1 evokes accumulation in 48S PICs of LUC reporter mRNA with a stable cap-distal SL insertion. (A,B) WT and ded1-cs strains harboring LUC reporters described in Figure 5A,B, with a 91-nt 5′ UTR or containing the −3.7 kcal/mol SL, were cultured as in Figure 4B and cells were cross-linked with 2% HCHO for 1 h prior to harvesting. WCEs were resolved by sedimentation through 10%–50% sucrose gradients, and fractions were collected while scanning at 254 nm. (A) Representative polysome profiles. (B) Gradient fractions were spiked with equal amounts of control RNA, total RNA extracted, and abundance of LUC reporter (relative to control) mRNA quantified by qRT-PCR, conducting three technical replicates for each fraction. Results from biological replicates ±SEM are shown.
Having found by ribosome profiling that relatively few mRNAs show a greater than average dependence on eIF4A, we examined the effects of the tif1-ts mutation on expression of the same LUC reporters at 33°C. In WT cells, the SL insertions reduced reporter expression (Fig. 5C, left) similarly to that described above at 23°C (Fig. 5B, left), except that the magnitude of inhibition was diminished at the higher temperature of 33°C. Surprisingly, in tif1-ts cells, LUC reporter expression was reduced by 40%–50% regardless of the presence or location of a SL structure, indicating that the SLs did not increase dependence on eIF4A for efficient translation. Similar results were obtained when WT and tif1-ts cells were cultured at 30°C (Supplemental Fig. S7). As described in Supplemental Figure S8, we obtained additional evidence corroborating our conclusion that cap-distal secondary structures increase dependence on Ded1, but not eIF4A, for translation in vivo by assaying GCN4-lacZ reporters containing or lacking a cap-distal SL. Finally, Supplemental Figure S9 presents results obtained on the ded1-ts mutant assayed at 33°C demonstrating that the stronger effect of ded1-cs versus tif1-ts on expression of the LUC reporter with cap-distal SL did not result from the fact that ded1-cs cells were examined at 23°C (Fig. 5B) where the SL should be more stable than at the 33°C temperature used to inactivate tif1-ts (Fig. 5C). We conclude that efficient translation in the presence of a cap-distal SL is more strongly dependent on Ded1 than eIF4A in cells regardless of the growth temperature.
Discussion
We have used a combination of ribosome profiling and reporter analysis to shed light on the in vivo functions of Ded1 and eIF4A in translation of different mRNAs in yeast. Because both helicases are essential, and mutations in either protein reduce bulk translation initiation, we sought to determine whether the sets of mRNAs that are most dependent on Ded1 or eIF4A overlap extensively or, rather, are largely nonoverlapping and exhibit distinct properties. Our findings suggest an outcome somewhere between these extremes. Inactivation of Ded1 by the ded1-cs mutation led to widespread reductions in TEs of many mRNAs, which exhibit a mean 5′ UTR length about twice the genome average, and a heightened propensity for secondary structures (higher PARS scores). Conversely, genes displaying ≥twofold increased TE in ded1-cs cells exhibit mean 5′ UTR length and PARS scores below genome averages. We also identified inverse correlations genome-wide between changes in TE and the length and PARS features of 5′ UTRs for both ded1-cs and ded1-ts mutants. These results support the notion that Ded1 is important for stimulating 43S PIC scanning through 5′ UTRs of many yeast mRNAs.
The stimulatory effect of Ded1 could involve increased processivity or a greater ability to resolve secondary structures. Analysis of LUC reporters with unstructured 5′ UTRs indicate that a longer 5′ UTR per se does not confer greater Ded1 dependence, inconsistent with Ded1 simply preventing PIC drop-off during scanning through long distances. In contrast, insertion of a SL of moderate stability 55 nt from the cap, where it should affect scanning but not PIC attachment, dramatically increased the effect of ded1-cs on reporter expression, and this SL-mRNA was shifted from polysomes/monsomes into 48S PICs in the mutant cells, consistent with scanning PICs becoming paused at the SL. Insertion of a strong SL only 7 nt from the cap produced a moderate increase in Ded1 dependence, suggesting that Ded1 also promotes 43S PIC attachment at the 5′ ends of mRNAs harboring cap-proximal secondary structure. One way to explain the relatively smaller Ded1 dependence of the reporter with cap-proximal SL is to propose that Ded1 and eIF4A make comparable contributions to PIC attachment at 5′ ends, whereas Ded1 is paramount in resolving cap-distal structures. This would account for genetic data suggesting that Ded1 functionally overlaps with eIF4F in yeast cells (de la Cruz et al. 1997), as well as previous findings that inactivating Ded1, but not eIF4A, specifically impaired expression of a reporter with a long 5′ UTR relative to one with a more typical short 5′ UTR (Berthelot et al. 2004). We suggest that the increased Ded1 dependence of the long-5′ UTR reporter in that study reflected the use of the GCN4 mRNA leader, which is not devoid of structure, such that the longer 5′ UTR contained more structure-forming sequences that impede scanning and can be resolved by Ded1. We advance the same interpretation to account for the inverse correlation observed here between changes in TE and 5′ UTR length in ded1 mutant cells.
As noted earlier, previous studies showed that overexpressed Ded1 inhibits translation (Beckham et al. 2008) and accumulates in stress granules in yeast cells and that these inhibitory effects are enhanced by inactivation of its ATPase activity, leading to the model that Ded1 assembles translationally repressed mRNPs and can reverse the repression under the appropriate conditions through its helicase function (Hilliker et al. 2011). While it is still unclear whether Ded1 at native levels can repress translation, some mRNAs that display reduced TEs in the ded1 mutants might be translationally repressed by the mutant Ded1 proteins rather than be impaired by the absence of Ded1 helicase activity. Examining the effects of mutant Ded1 proteins on translation of such mRNAs in a reconstituted system might resolve this issue.
Our genome-wide analysis of the effects of inactivating eIF4A by the tif1-ts mutation identified ∼20-fold fewer genes than the number of Ded1-dependent genes identified in ded1-cs cells at 15°C, despite comparable reductions in bulk polysome assembly in the two mutants. These findings suggest that most yeast mRNAs have comparable requirements for eIF4A and are thus similarly impaired in the tif1-ts mutant. This conclusion is mirrored by our findings that the presence of stable SL insertions in the 5′ UTR increased the deleterious effect of ded1-cs, but not tif1-ts, on reporter expression in vivo. Interestingly, approximately one-third of the unusually eIF4A-dependent genes also strongly depend on Ded1, and there is a positive correlation between the effects of tif1-ts and ded1-cs on TEs genome-wide. Consistently, changes in TE are negatively correlated with length and PARS features of 5′ UTRs in the tif1-ts mutant, as in the ded1 mutants. These findings suggest that a substantial proportion of mRNAs displaying atypical dependence on Ded1 also exhibit an enhanced requirement for eIF4A, of lesser magnitude. Many of the mRNAs with this dual Ded1/eIF4A requirement are visible in gene clusters 7–9 of the heat map in Figure 2D. This overlap between Ded1- and eIF4A-dependent mRNAs, together with the moderate tendency for eIF4A-dependent mRNAs to have longer, more structured 5′ UTRs, suggests that eIF4A and Ded1 functionally cooperate on a subset of mRNAs to promote scanning through 5′ UTRs, with Ded1 generally making the stronger contribution to resolving cap-distal secondary structures. The cluster analysis also reveals genes with a greater than average dependence on Ded1, whose relative TE actually increases in the tif1-ts mutant (e.g., cluster 6), signifying a smaller than average dependence on eIF4A function; the converse is evident for many genes in clusters 4–5 (Fig. 2D). Thus, there appear to be subsets of mRNAs in which one helicase but not the other makes an important contribution to TE. The mRNAs that exhibit a greater requirement for eIF4A than Ded1 might have a cap-proximal sequence or structure that impedes eIF4F attachment to the mRNA, which would depend largely on eIF4A functioning as a component of eIF4F.
Results from the ded1-ts mutant indicate that our identification of many fewer mRNAs strongly dependent on eIF4A versus Ded1 is unlikely due to the lower incubation temperature for ded1-cs. We also considered whether we had underestimated the number of genes strongly dependent on eIF4A because reductions in ribosome occupancy conferred by tif1-ts evoked increased mRNA turnover and reduced mRNA abundance, a secondary effect that could dampen calculated reductions in TE. Indeed, there is a strong correlation between changes in ribosome occupancy and changes in mRNA abundance genome-wide in the tif1-ts mutant at both 30°C and 37°C (Spearman coefficients, ρ = 0.52 and ρ = 0.45, respectively). However, we found an equally strong correlation between changes in ribosome occupancy and mRNA levels in the ded1-ts mutant (ρ = 0.52), while analysis of the ded1-ts and tif1-ts mutants identified ∼sixfold more genes strongly dependent on Ded1 versus eIF4A at the same incubation temperature. Note also that many more genes exhibit ≥twofold changes in ribosome occupancy (ΔRibo) in the ded1-cs and ded1-ts strains (1026 and 749 genes, respectively) versus the tif1-ts mutant at 30°C or 37°C (211 and 123 genes, respectively). Thus, even if all changes in ribosome occupancy in tif1-ts cells resulted from altered translation rates (regardless of whether they are accompanied by changes in mRNA abundance), there would still be many fewer genes strongly affected in tif1-ts versus ded1-ts or ded1-cs cells, as we concluded from analyzing changes in TE.
The increased dependence on Ded1 imparted by 5′ UTR structure can be explained by proposing that Ded1 promotes PIC attachment and (especially) subsequent scanning by resolving RNA structures that impede the threading of mRNA in single-stranded conformation through the mRNA binding cleft of the 40S subunit. How can we explain the finding that most mRNAs display an equally strong, but much more uniform dependence on eIF4A? One possibility would be that eIF4A stimulates eIF4G binding to mRNA and 43S PIC attachment to eIF4F·mRNPs primarily by resolving the large ensemble of weaker RNA-RNA interactions involving cap-proximal 5′ UTR nucleotides that occur within all mRNAs and impede both processes. The presence of a strong cap-proximal SL would not increase the requirement for eIF4A either because eIF4A is relatively ineffective in unwinding such stable structures compared to Ded1, or because eIF4G might bind to single-stranded nucleotides straddling the SL and thereby “loop-out” the unresolved duplex. Alternately, the ATP-dependent RNA binding and the RNA- and eIF4G-stimulated ATPase activity of eIF4A may provide an essential function in translation initiation not related directly to removing mRNA secondary structure. It will be interesting to compare the relative importance of eIF4A and Ded1 in attachment of eIF4G and 43S PICs to different native mRNAs in vivo.
Methods
Construction of yeast strains and plasmids
Yeast strains and plasmids used in this study are listed in Supplemental Tables S3 and S4, and were generated as described in Supplemental Material.
Yeast biochemical methods
β-galactosidase activities were assayed in WCEs as described previously (Chiu et al. 2010). To assay LUC reporters, cells were disrupted with glass beads in 1× PBS containing two Complete EDTA-free Protease Inhibitor Cocktail Tablets (Roche)/50 mL, and firefly luciferase activities were measured using the Dual-Luciferase Reporter Assay System (Promega) according to the supplier's protocol and normalized to the total protein levels in the extracts.
Polysome profiles, polysome gradient fractionation, RNA isolation, and quantitative RT-PCR
For polysome analysis, strains were cultured under the conditions specified in the Results to A600 ∼0.8, cycloheximide was added to 50 μg/mL for 5 min prior to harvesting, and WCEs were prepared and resolved by sedimentation through sucrose density gradients, as detailed in the Supplemental Material.
Ribosome footprinting and RNA-seq
Ribosome profiling was conducted essentially as described (Ingolia et al. 2009; Ingolia 2010). Statistical analysis of differences in ribosome footprint or RNA-seq read counts, or TE values, between WT and mutant samples was conducted using DESeq (Anders and Huber 2010). Genes with less than 128 total mRNA reads in the four samples combined (replicates of both WT and mutant strains) were excluded from the calculation of TE values.
Data access
Sequencing data from this study have been submitted to the NCBI Gene Expression Omnibus (GEO; http://www.ncbi.nlm.nih.gov/geo/) under accession number GSE66411.
Supplementary Material
Acknowledgments
We thank members of our laboratories and the Dever and Lorsch groups for many helpful suggestions, Sumit Sen, James Iben, and Tingfen Yan for help with bioinformatics, and Patrick Linder, Roy Parker, Susan Wente, and Charlie Boone for generous gifts of strains or plasmids. N.T.I. was supported by the Searle Scholars Program (11-SSP-229) and NIEHS grant R21 ES22575-01. This work was supported in part by the Intramural Research Program of the National Institutes of Health.
Footnotes
[Supplemental material is available for this article.]
Article published online before print. Article, supplemental material, and publication date are at http://www.genome.org/cgi/doi/10.1101/gr.191601.115.
References
- Abaeva IS, Marintchev A, Pisareva VP, Hellen CU, Pestova TV. 2011. Bypassing of stems versus linear base-by-base inspection of mammalian mRNAs during ribosomal scanning. EMBO J 30: 115–129. [DOI] [PMC free article] [PubMed] [Google Scholar]
- Anders S, Huber W. 2010. Differential expression analysis for sequence count data. Genome Biol 11: R106. [DOI] [PMC free article] [PubMed] [Google Scholar]
- Beckham C, Hilliker A, Cziko AM, Noueiry A, Ramaswami M, Parker R. 2008. The DEAD-box RNA helicase Ded1p affects and accumulates in Saccharomyces cerevisiae P-bodies. Mol Biol Cell 19: 984–993. [DOI] [PMC free article] [PubMed] [Google Scholar]
- Berthelot K, Muldoon M, Rajkowitsch L, Hughes J, McCarthy JE. 2004. Dynamics and processivity of 40S ribosome scanning on mRNA in yeast. Mol Microbiol 51: 987–1001. [DOI] [PubMed] [Google Scholar]
- Blum S, Schmid SR, Pause A, Buser P, Linder P, Sonenberg N, Trachsel H. 1992. ATP hydrolysis by initiation factor 4A is required for translation initiation in Saccharomyces cerevisiae. Proc Natl Acad Sci 89: 7664–7668. [DOI] [PMC free article] [PubMed] [Google Scholar]
- Chiu WL, Wagner S, Herrmannova A, Burela L, Zhang F, Saini AK, Valasek L, Hinnebusch AG. 2010. The C-terminal region of eukaryotic translation initiation factor 3a (eIF3a) promotes mRNA recruitment, scanning, and, together with eIF3j and the eIF3b RNA recognition motif, selection of AUG start codons. Mol Cell Biol 30: 4415–4434. [DOI] [PMC free article] [PubMed] [Google Scholar]
- Chuang RY, Weaver PL, Liu Z, Chang TH. 1997. Requirement of the DEAD-Box protein ded1p for messenger RNA translation. Science 275: 1468–1471. [DOI] [PubMed] [Google Scholar]
- de la Cruz J, Iost I, Kressler D, Linder P. 1997. The p20 and Ded1 proteins have antagonistic roles in eIF4E-dependent translation in Saccharomyces cerevisiae. Proc Natl Acad Sci 94: 5201–5206. [DOI] [PMC free article] [PubMed] [Google Scholar]
- Geissler R, Golbik RP, Behrens SE. 2012. The DEAD-box helicase DDX3 supports the assembly of functional 80S ribosomes. Nucleic Acids Res 40: 4998–5011. [DOI] [PMC free article] [PubMed] [Google Scholar]
- Hilliker A, Gao Z, Jankowsky E, Parker R. 2011. The DEAD-box protein Ded1 modulates translation by the formation and resolution of an eIF4F-mRNA complex. Mol Cell 43: 962–972. [DOI] [PMC free article] [PubMed] [Google Scholar]
- Hinnebusch AG. 2014. The scanning mechanism of eukaryotic translation initiation. Annu Rev Biochem 83: 779–812. [DOI] [PubMed] [Google Scholar]
- Ingolia NT. 2010. Genome-wide translational profiling by ribosome footprinting. Methods Enzymol 470: 119–142. [DOI] [PubMed] [Google Scholar]
- Ingolia NT, Ghaemmaghami S, Newman JR, Weissman JS. 2009. Genome-wide analysis in vivo of translation with nucleotide resolution using ribosome profiling. Science 324: 218–223. [DOI] [PMC free article] [PubMed] [Google Scholar]
- Kertesz M, Wan Y, Mazor E, Rinn JL, Nutter RC, Chang HY, Segal E. 2010. Genome-wide measurement of RNA secondary structure in yeast. Nature 467: 103–107. [DOI] [PMC free article] [PubMed] [Google Scholar]
- Kozak M, Shatkin AJ. 1977. Sequences and properties of two ribosome binding sites from the small size class of reovirus messenger RNA. J Biol Chem 252: 6895–6908. [PubMed] [Google Scholar]
- Lai MC, Lee YH, Tarn WY. 2008. The DEAD-box RNA helicase DDX3 associates with export messenger ribonucleoproteins as well as tip-associated protein and participates in translational control. Mol Biol Cell 19: 3847–3858. [DOI] [PMC free article] [PubMed] [Google Scholar]
- Lawless C, Pearson RD, Selley JN, Smirnova JB, Grant CM, Ashe MP, Pavitt GD, Hubbard SJ. 2009. Upstream sequence elements direct post-transcriptional regulation of gene expression under stress conditions in yeast. BMC Genomics 10: 7–26. [DOI] [PMC free article] [PubMed] [Google Scholar]
- Lazarowitz SG, Robertson HD. 1977. Initiator regions from the small size class of reovirus messenger RNA protected by rabbit reticulocyte ribosomes. J Biol Chem 252: 7842–7849. [PubMed] [Google Scholar]
- Lee CS, Dias AP, Jedrychowski M, Patel AH, Hsu JL, Reed R. 2008. Human DDX3 functions in translation and interacts with the translation initiation factor eIF3. Nucleic Acids Res 36: 4708–4718. [DOI] [PMC free article] [PubMed] [Google Scholar]
- Linder P, Jankowsky E. 2011. From unwinding to clamping—the DEAD box RNA helicase family. Nat Rev Mol Cell Biol 12: 505–516. [DOI] [PubMed] [Google Scholar]
- Mitchell SF, Walker SE, Algire MA, Park EH, Hinnebusch AG, Lorsch JR. 2010. The 5′-7-methylguanosine cap on eukaryotic mRNAs serves both to stimulate canonical translation initiation and block an alternative pathway. Mol Cell 39: 950–962. [DOI] [PMC free article] [PubMed] [Google Scholar]
- Parsyan A, Shahbazian D, Martineau Y, Petroulakis E, Alain T, Larsson O, Mathonnet G, Tettweiler G, Hellen CU, Pestova TV, et al. 2009. The helicase protein DHX29 promotes translation initiation, cell proliferation, and tumorigenesis. Proc Natl Acad Sci 106: 22217–22222. [DOI] [PMC free article] [PubMed] [Google Scholar]
- Pestova TV, Kolupaeva VG. 2002. The roles of individual eukaryotic translation initiation factors in ribosomal scanning and initiation codon selection. Genes Dev 16: 2906–2922. [DOI] [PMC free article] [PubMed] [Google Scholar]
- Pestova TV, Hellen CUT, Shatsky IV. 1996. Canonical eukaryotic initiation factors determine initiation of translation by internal ribosomal entry. Mol Cell Biol 16: 6859–6869. [DOI] [PMC free article] [PubMed] [Google Scholar]
- Pestova TV, Borukhov SI, Hellen CUT. 1998. Eukaryotic ribosomes require initiation factors 1 and 1A to locate initiation codons. Nature 394: 854–859. [DOI] [PubMed] [Google Scholar]
- Pisareva VP, Pisarev AV, Komar AA, Hellen CU, Pestova TV. 2008. Translation initiation on mammalian mRNAs with structured 5′UTRs requires DExH-box protein DHX29. Cell 135: 1237–1250. [DOI] [PMC free article] [PubMed] [Google Scholar]
- Ringner M, Krogh M. 2005. Folding free energies of 5′-UTRs impact post-transcriptional regulation on a genomic scale in yeast. PLoS Comput Biol 1: e72. [DOI] [PMC free article] [PubMed] [Google Scholar]
- Rogers GW Jr, Komar AA, Merrick WC. 2002. eIF4A: the godfather of the DEAD box helicases. Prog Nucleic Acid Res Mol Biol 72: 307–331. [DOI] [PubMed] [Google Scholar]
- Rouskin S, Zubradt M, Washietl S, Kellis M, Weissman JS. 2014. Genome-wide probing of RNA structure reveals active unfolding of mRNA structures in vivo. Nature 505: 701–705. [DOI] [PMC free article] [PubMed] [Google Scholar]
- Schutz P, Bumann M, Oberholzer AE, Bieniossek C, Trachsel H, Altmann M, Baumann U. 2008. Crystal structure of the yeast eIF4A-eIF4G complex: an RNA-helicase controlled by protein–protein interactions. Proc Natl Acad Sci 105: 9564–9569. [DOI] [PMC free article] [PubMed] [Google Scholar]
- Shih JW, Tsai TY, Chao CH, Wu Lee YH. 2008. Candidate tumor suppressor DDX3 RNA helicase specifically represses cap-dependent translation by acting as an eIF4E inhibitory protein. Oncogene 27: 700–714. [DOI] [PubMed] [Google Scholar]
- Soto-Rifo R, Rubilar PS, Limousin T, de Breyne S, Decimo D, Ohlmann T. 2012. DEAD-box protein DDX3 associates with eIF4F to promote translation of selected mRNAs. EMBO J 31: 3745–3756. [DOI] [PMC free article] [PubMed] [Google Scholar]
- Svitkin Y, Pause A, Haghighat A, Pyronnet S, Witherell GW, Belsham G, Sonenberg N. 2001. The requirement for eukaryotic initiation factor 4A (eIF4A) in translation is in direct proportion to the degree of mRNA 5′ secondary structure. RNA 7: 382–394. [DOI] [PMC free article] [PubMed] [Google Scholar]
- Wan Y, Qu K, Ouyang Z, Kertesz M, Li J, Tibshirani R, Makino DL, Nutter RC, Segal E, Chang HY. 2012. Genome-wide measurement of RNA folding energies. Mol Cell 48: 169–181. [DOI] [PMC free article] [PubMed] [Google Scholar]
Associated Data
This section collects any data citations, data availability statements, or supplementary materials included in this article.