

Abstract
We report a novel high-throughput method to empirically quantify individual-specific regulatory element activity at the population scale. The approach combines targeted DNA capture with a high-throughput reporter gene expression assay. As demonstration, we measured the activity of more than 100 putative regulatory elements from 95 individuals in a single experiment. In agreement with previous reports, we found that most genetic variants have weak effects on distal regulatory element activity. Because haplotypes are typically maintained within but not between assayed regulatory elements, the approach can be used to identify causal regulatory haplotypes that likely contribute to human phenotypes. Finally, we demonstrate the utility of the method to functionally fine map causal regulatory variants in regions of high linkage disequilibrium identified by expression quantitative trait loci (eQTL) analyses.
There are now several examples of noncoding genetic variants that alter the activity of regulatory elements and contribute substantially to complex traits and human diseases (Olansky et al. 1992; Nicolae et al. 2010; Maurano et al. 2012; Corradin et al. 2014; Stadhouders et al. 2014; Guo et al. 2015). Such examples are likely representative of a larger trend that genetic variations in regulatory elements are a major contributor to complex phenotypes and disease (Maurano et al. 2012; Gusev et al. 2014). Genetic effects on gene regulation are pervasive, as demonstrated by association studies revealing expression quantitative trait loci (eQTL) for the majority of human genes (Cantor et al. 2010; Stranger and Raj 2013; Battle et al. 2014). Recent studies have further demonstrated that genetic variants associated with DNase I hypersensitivity, a strong predictor of the presence of a regulatory element, explain a substantial proportion of eQTLs (Degner et al. 2012), and individuals who are heterozygous in those elements likely have heritable allele-specific open chromatin and transcription factor binding (Birney et al. 2010; McDaniell et al. 2010; Reddy et al. 2012). Although there is now much evidence supporting the contributions of regulatory variation to human phenotypes, systematically identifying the specific variants and regulatory elements that contribute to phenotype remains a major challenge.
One of the major reasons that challenge remains is that patterns of recombination across the genome limit the resolution of genetic association studies and prevent the identification of specific causal variants. That limitation motivates the development of complementary empirical approaches to assay the consequences of noncoding genetic variation on regulatory element activity (Feng et al. 2013; Fogarty et al. 2014; Stadhouders et al. 2014; Guo et al. 2015). In a reporter gene expression assay, for example, a gene regulatory element is cloned into a plasmid, where the element can control the expression of a fluorescent or chemiluminescent protein. The plasmid is then transfected or infected into cells, and the activity of the regulatory element is estimated by measuring the expression of the reporter gene. Several examples have now shown that reporter assays are a valuable tool to compare the function of genetically different versions of the same regulatory element and to identify noncoding variants that explain genetic associations with gene expression and phenotypes (Fogarty et al. 2014; Guo et al. 2015). Recent advances have dramatically increased the throughput of reporter assays by embedding molecular barcodes within the reporter gene that can later be observed with DNA sequencing (Patwardhan et al. 2009; Kwasnieski et al. 2012; Melnikov et al. 2012; White et al. 2013), and the regulatory activity of more than one million unique DNA fragments can now be assayed in a single experiment using such massively parallel reporter assays (Arnold et al. 2013).
Here, we have developed a novel high-throughput approach to efficiently measure the activity of regulatory elements captured from the genomes of a human study population. Previous approaches to identify genetic effects on regulatory element activity have used DNA synthesis and random mutagenesis to generate mutations in select regulatory elements (Patwardhan et al. 2009; Melnikov et al. 2012; White et al. 2013). By instead assaying putative regulatory elements captured from donor genomes, the strategy presented here allows for high-throughput empirical measurement of the effects of regulatory variants specific to a study population. Moreover, because haplotypes are maintained within each regulatory element, empirical measurement of the combined effects of all common, rare, and personal variants within a regulatory element are possible. The result is individual-specific measurements of regulatory element activity across the study population. Because candidate regulatory elements are assayed independently of one another, the approach is an effective strategy to identify causal mutations within large regions of statistical association between genotype and phenotype. Together, these results demonstrate that population-scale functional reporter assays are a valuable strategy for identifying specific causal genetic variants and haplotypes within genomic loci previously associated with phenotype.
Results
Population-scale reporter assay approach
We designed an empirical strategy to measure the activity of specific candidate regulatory elements across a population of individuals (Fig. 1A). The strategy is based on the STARR-seq assay (Arnold et al. 2013). Briefly, in STARR-seq, candidate regulatory elements are cloned into the 3′ untranslated region (UTR) of a reporter gene. The resulting plasmid pool is then transfected into host cells, where the cloned elements can regulate expression of the reporter gene in which they are embedded. High-throughput sequencing of the 3′ UTR of the expressed reporter gene mRNA can then be used to estimate the regulatory activity of each element.
Figure 1.

Identification of regulatory variants using population-scale STARR-seq assays. (A) Schematic of population STARR-seq assay design. (B) Candidate regulatory sites were sequenced in 95 members of the Hyperglycemia and Adverse Pregnancy Outcome (HAPO) Study (Urbanek et al. 2013) patient cohort using custom amplicon sequencing. The targeted regions overlap open chromatin (DHSs) in multiple cell types as described in Methods. (C) Population STARR-seq is highly reproducible. Rep1–7 are biological replicates generated from independent transfections. The x- and y-axes represent element activity (output RNA reads/input DNA reads). In each case, Spearman's ρ > 0.90. (D) Plotted is a comparison of the allele frequency of each SNP in the cohort DNA to the allele frequency of each SNP in the resulting reporter library. Allele frequencies of the cohort DNA used are shown on the x-axis, and the allele frequencies in the resulting reporter library are on the y-axis. The allele frequencies are highly correlated, as evaluated by a Pearson correlation (r2 = 0.94, P < 1 × 10⁻⁵). The one-to-one line is shown in blue. The least squares fit is shown in red. (E) Log2(effect sizes) for nonsignificant (pink) and significant (FDR < 0.05, blue) variants. The effect sizes are small and range between 0.25 and 3.96 fold-change. (F) Firefly luciferase assay validations for population STARR-seq. In all cases, the higher expressing allele in our high-throughput reporter assay, shown in green, also had higher luciferase expression.
To leverage the STARR-seq approach to measure the activity of candidate regulatory elements across a population of individuals, we first generate a targeted sequencing library of regulatory elements from donor genomes using multiplex PCR. In a subsequent PCR reaction, we then modify the resulting fragment libraries such that the sequence of the terminal 15 bp at each end of each fragment matches the ends of the cloning site in the STARR-seq backbone. We then clone the capture regulatory elements into the STARR-seq backbone using a homology-based cloning strategy and expand the resulting input library in Escherichia coli. To assay the activity of each captured fragment, we transfect the input library into a human liver carcinoma cell line, HepG2, and use 250-bp paired-end sequencing to observe the abundance of each allele of each element in the input pool of transfected DNA and in the expressed reporter gene mRNA. Using an allele-specific analysis strategy, we then estimate the effect of each allele on regulatory element activity.
Targeted sequencing of candidate regulatory elements from a GWAS population
As demonstration of the aforementioned approach, we focused on candidate regulatory elements from a 250-kb region on Chromosome 3 (3q25) that we previously found to be associated with measures of adiposity at birth (Urbanek et al. 2013). We selected the regions to assay based on evidence from the ENCODE Project Consortium (2012) that suggests potential regulatory activity. Specifically, we aggregated open chromatin data from 40 different cell types relevant to metabolism, which yielded an initial set of 128 open chromatin sites. We further prioritized those sites by selecting DNase I hypersensitive sites (DHSs) that were present in at least two or more cell lines, resulting in a total 104 DHSs (Fig. 1B; Supplemental Data 1). We designed 174 PCR amplicons to amplify from the 104 candidate regulatory elements (Supplemental Data 2). The amplicons had an average length of 409 bp. We then used multiplex PCR to amplify those elements from 95 individuals at the extremes of adiposity in the genetic association cohort (Urbanek et al. 2013).
To quantify the genetic variation in the captured elements, we sequenced the regions using paired-end 250-bp sequencing. That read length was sufficient to observe the entire sequence of each amplicon. Sequencing was completed to a median depth of 1500× (Supplemental Fig. 1), resulting in the identification of 321 genetic variants in the captured elements (Supplemental Data 3). Twenty-three percent of the variants identified were specific to the study population as determined by their absence from dbSNP and the 1000 Genomes Project Consortium database (Sherry et al. 2001; The 1000 Genomes Project Consortium 2012). The ratio of transitions to transversions was similar between the captured variants and those found in the 1000 Genomes Project (Supplemental Table 1), suggesting that the novel variants were unlikely due to systematic sequencing errors. We identified a substantially greater fraction of rare and personal variants in our targeted sequencing, likely due to increased sequencing depth that supported more highly powered variant calling (Supplemental Fig. 2). The preponderance of study-specific variants emphasizes the importance of assaying regulatory elements captured from the genomes of the study population rather than from a separate cohort.
Quantifying the effects of noncoding variation in a GWAS population
To quantify the activity of the captured candidate regulatory elements, we cloned the captured amplicons into the 3′ UTR of the STARR-seq reporter gene (Arnold et al. 2013) to generate an input plasmid library. The input library covered 99% of the targeted sequence and included both alleles of 88% of the variants observed in targeted sequencing of the region at a median coverage of approximately 2200× (Supplemental Table 2; Supplemental Fig. 3). We then performed seven independent transfections of the input library into HepG2 cells and used targeted high-throughput sequencing of the expressed reporter gene transcripts to measure the allele-specific regulatory activity for each amplicon. The sequencing generated a median coverage of the target amplicons of approximately 13,000× (Supplemental Fig. 4) and assayed both alleles of 283 of 321 SNPs detected in the input library. Of the assayed SNPs, 83 (29%) were rare, defined as a minor allele frequency <1%. We observed a similar fraction of rare SNPs in the input library (32%), suggesting that there was minimal bias against rare variants in the assays.
There was strong correlation between the allele ratios in each pair of output libraries (Spearman's ρ between 0.90 and 0.97) (Fig. 1C), demonstrating reproducibility of the assay. There was also strong correlation between the allele ratios in the input plasmid pool versus the allele ratios in each of the output libraries (Spearman's ρ between 0.80 and 0.88) (Supplemental Fig. 5), demonstrating that variants had small effects on regulatory activity overall. Cloning the captured candidate regulatory elements into the STARR-seq backbone did not introduce biases in the allele frequency in the assay as demonstrated by a strong correlation between the allele ratios in the plasmid DNA library and the allele ratios in the sequencing of the initial multiplex PCR products (r2 = 0.94, two-sided P < 0.0001) (Fig. 1D). We therefore concluded that the resulting assay libraries were representative of the genetic diversity in the population. When the allele frequencies of the input plasmid DNA library were compared to the allele frequencies of the variants called in the 95 individuals, we observed enrichment of rare minor alleles in the input plasmid DNA library (Supplemental Fig. 6). Because that bias was specific to the comparison with called variants and was not observed when comparing to the raw sequencing reads, the bias was likely due to underestimation of rare allele frequencies by conservative calling of rare variants (The 1000 Genomes Project Consortium 2012).
To identify individual variants that have a statistically significant effect on regulatory activity after taking into account differences in read depth, we pooled reads from the replicate output libraries and compared relative variant abundance to the input library using Fisher's exact test. We identified 27 common and nine rare regulatory variants with a false discovery rate (FDR) < 5%. The identified variants had fold changes in regulatory activity ranging from 0.25 to 3.96 (Supplemental Data 4), consistent with previous observations using saturation mutagenesis of enhancers (Fig. 1E; Patwardhan et al. 2012). To empirically validate that the results were not due to the candidate regulatory elements’ location in the 3′ UTR of the reporter gene, we used a standard luciferase reporter assay in which the candidate regulatory element is located upstream of the promoter. In all cases, the allele with greater regulatory activity in the STARR-seq assay also had increased luciferase expression (Fig. 1F). That positive validation indicates that the observed effects were not specific to the location of the candidate regulatory element relative to the reporter gene.
Regulatory variants are enriched in active enhancers
We next evaluated whether regulatory variants were enriched in the most active enhancers or could instead be due to noise in low-activity or silent candidate regulatory elements. We defined an enhancer activity score as the proportion of the total reads contributed by a fragment in the targeted RNA-seq output library divided by the proportion of the total reads contributed by that fragment in the input DNA plasmid library. The fragments that contained regulatory variants had higher-ranking enhancer activity scores than those that lacked regulatory variants (U-test, P < 10−4) (Fig. 2A; Supplemental Data 5,6), consistent with regulatory variants being located in the most active candidate regulatory elements. We also asked whether there was evidence that rare alleles were more likely to have a stronger effect on regulatory activity, and we did not find a statistically significant association between effect size and allele frequency (Spearman ρ = −0.18, P = 0.28) (Supplemental Fig. 7).
Figure 2.

Comprehensive measurement of haplotype-specific regulatory element activity provides mechanistic insights into gene regulation. (A) Distribution of enhancer activity scores for fragments containing regulatory variants (red) and fragments containing nonregulatory variants (blue). (B) Histogram of number of SNPs per assayed element. (C) Manhattan plot of eQTLs for the long noncoding RNA LINC00881. Blue dots indicate −log10 (P-value) of LINC00881 eQTL from the Geuvadis database (left y-axis); red bars indicate −log10(FDR) for variants that alter regulatory activity in the population STARR-seq assay (right y-axis). Red dotted line indicates a FDR = 1.0. (D) Association between normalized expression of long noncoding gene LINC00881 in LCLs as measured by the Geuvadis project (y-axis) and the measured effect size in population STARR-seq assay (x-axis) for SNP rs73170828 (r2 = 0.07, P = 7.6 × 10⁻⁹). (E) Allele-specific H3K27ac analysis of variants rs62274098 and rs73170828, both eQTLs proximal to and 5′ of LINC00881; read counts (y-axis) differed substantially between alleles for rs73170828 (Wilcoxon P = 0.058, binomial P = 0.004) but not for rs62274098 (Wilcoxon P = 0.9; binomial P = 0.92).
Effects of haplotypes on regulatory element activity
For 98 of the amplicons, there was more than one polymorphic site (Fig. 2B), allowing us to ask whether multiple variants act independently to alter regulatory element activity at the haplotype level. To investigate that possibility, we generated phased haplotype sequences based on the targeted sequencing data and used sequence alignment to assign sequencing reads from the expressed reporter library to each haplotype (Supplemental Data 7). That analysis allowed us to estimate the relative expression of each of the more than 450 distinct haplotypes assayed and revealed 24 haplotypes across 16 amplicons that significantly altered regulatory element activity (adjusted P < 0.05, Fisher's exact test) (Supplemental Data 8). We then evaluated the extent to which the independent contributions of the estimated effects of each SNP in a haplotype predicted the observed activity of the entire haplotype (Supplemental Fig. 8). The correlation between the effects predicted by individual SNPs and the effects of the haplotype (r = 0.54, P = 0.007) supports an overall consistency between SNP effects and their combination into haplotype effects. However, there was substantial residual variation that may be due to either experimental noise or synergistic effects between variants within haplotypes. Measuring haplotype-scale effects in larger populations will also be important to establish the distribution of natural functional variation in regulatory elements and may provide insights into the role of gene regulation in a wide variety of biological processes.
Fine mapping genetic associations with phenotypes
One of the major goals of functionally evaluating regulatory variants is to determine genetic effects on regulatory element activity that may explain genetic associations with phenotypes. To demonstrate that our strategy can support such fine mapping, we investigated a set of SNPs associated with the expression of a long noncoding RNA LINC00881 in the region. Specifically, the Geuvadis project (Lappalainen et al. 2013) identified a cluster of nine eQTLs associated with the expression of LINC00881 in lymphoblastoid cell lines (LCLs) (Supplemental Fig. 9). The variants associated with LINC00881 span ∼12 kb of the genome. The statistical significance of the association with LINC00881 was similar across all nine variants, likely due to high linkage disequilibrium across the region (Fig. 2C). Four of the nine eQTLs were also assayed in the 95 individuals with our population scale reporter assays. Only one variant, rs73170828, located 242 bp upstream of the annotated LINC00881 transcription start site, significantly altered reporter gene expression (FDR = 0.02). In the eQTL analysis and in our population scale reporter assays, the reference allele of rs73170828 was associated with increased gene expression and increased regulatory activity, respectively (Fig. 2D). Together, these results suggest that the promoter-proximal variant rs73170828 is a causal variant that regulates the transcription of LINC00881 and explains the association of the other eQTLs in the region. As independent support of the regulatory function of rs73170828, we searched for evidence of allele-specific histone 3 lysine 27 acetylation (H3K27ac), a histone modification associated with active gene regulation (Creyghton et al. 2010). In ChIP-seq experiments performed on LCLs derived from five individuals heterozygous for rs73170828 (Kilpinen et al. 2013), there was substantially higher H3K27ac on the reference allele across the LCLs (P = 0.058, paired Wilcoxon test). Furthermore, there was an overall significant increase in the number of reads aligning to the reference allele when compared to a null model in which the same proportion of reads align to each allele (binomial P = 0.004). Those results are concordant with increased regulatory activity of the reference allele in our reporter assays and increased LINC00881 expression. The second closest assayed variant, rs62274098, did not have significant allele-specific H3K27ac (binomial P = 0.92), suggesting again that rs73170828 and not neighboring variants mechanistically contributes to the expression of LINC00881 (Fig. 2E). Together, these results show that our novel approach for quantifying the effects of noncoding variation on gene regulation within cohorts reveals likely causal variants that contribute to genotype-phenotype associations.
Identifying candidate mechanisms of regulatory element activity
Quantifying genetic effects on regulatory element activity can also give insight into the underlying mechanisms controlling gene expression. As an example, one of the most significant regulatory variants in our study, the common SNP rs4266144 (minor allele frequency = 0.40), had a 1.34-fold effect on the activity of the regulatory element in which it is located. The variant overlaps a binding site for the transcription factor TEAD4 in the HepG2 cell line that we used in this study (The ENCODE Project Consortium 2012). The C allele more closely matches the TEAD4 consensus motif and also had increased regulatory activity (Fig. 1F, left-most plot; Fig. 3). The higher-activity C allele is also human-specific, whereas the ancestral G allele is conserved across nonhuman members of the Hominidae clade; and it is possible that recent evolution has altered the regulatory activity of that site by changing the TEAD4 recognition sequence (Blanchette et al. 2004). Although only a case study, this example highlights the possibility that combining the identification of regulatory variants with existing maps of transcription factor binding can reveal regulatory factors contributing to regulatory element activity. A systematic evaluation of that possibility will require expanding the catalog of functional noncoding genetic variants in larger populations.
Figure 3.
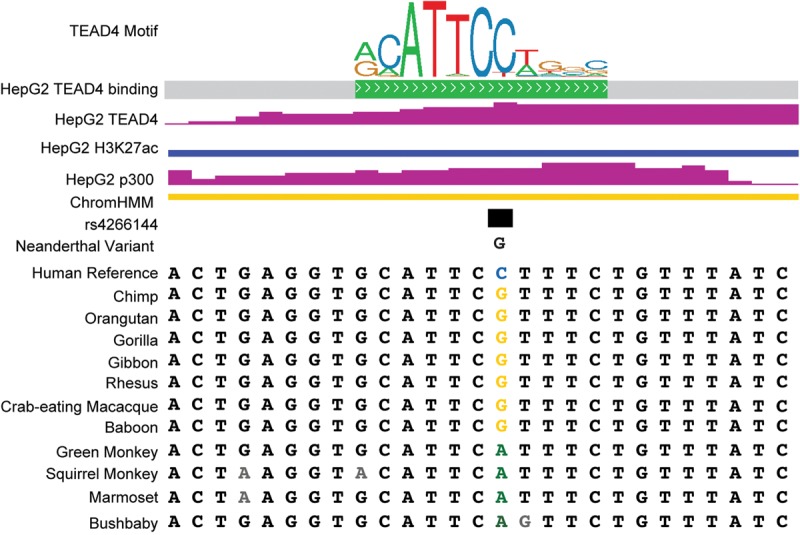
SNP rs4266144 resides within a TEAD4 ChIP-seq binding site as assayed in HepG2 cells. The C > G variant is located in a largely invariant region of the TEAD4 canonical consensus binding motif. The binding site is located within a region that is enriched for H3K27ac and EP300 occupancy. Concordantly, ChromHMM segmentation analysis scores the locus as a putative weak enhancer (Ernst and Kellis 2012). Multispecies conservation analysis suggests that this motif resides within a region that is conserved between the great apes.
Discussion
In this work, we developed a novel high-throughput empirical approach to measure the regulatory effects of noncoding human genetic variation directly from the DNA of individuals from a population-based study cohort. The ability to assay directly from cohort DNA samples is an important distinction from previous high-throughput reporter assays because it allows investigation of variants and haplotypes that are not present in existing databases of human genetic variation. As rare variants are typically not observed frequently enough to support a statistical association, rare-variant burden tests instead collapse or aggregate variants and correlate the overall burden of those variants with phenotypes (Li and Leal 2008; Zawistowski et al. 2010). Although burden testing within the coding regions of the genome can leverage predicted effects on the resulting protein (Choi et al. 2012; Hu et al. 2013), modeling regulatory element activity based on sequence alone remains a major challenge. Measuring regulatory activity directly from cohort DNA provides a possible empirical solution that allows the regulatory machinery of the cell to determine the cumulative effects of all regulatory variation in the element tested and allows for inference about the activity of that regulatory element that would not be possible otherwise.
The ability to associate empirically measured regulatory function and phenotype is especially needed in light of recent studies suggesting that coordination of regulatory effects between alleles may explain how weak effects of individual noncoding variants contribute to overall phenotypes (Corradin et al. 2014; Stadhouders et al. 2014; Guo et al. 2015). As we have shown, assaying regulatory elements outside the context of genetic linkage enables identification of individual regulatory elements that contribute to observed associations with gene expression. Importantly, however, genetic linkage is maintained within each individual regulatory element tested. That feature allows for measuring the effects of regulatory element haplotypes on element activity without the confounding effects of a nearby regulatory element. For those reasons, the approach described here has the ability to both resolve independent effects in multiple regulatory elements while also maintaining local epistatic interactions between variants within an individual element.
For any complex disease, multiple types of cells are likely relevant to an observed phenotype. Additionally, the causal regulatory elements may only be active under certain environmental conditions, or an interaction with the environment may amplify the effect. Transient reporter assays have been shown to recapitulate cell-type- and environment-specific gene regulation (Pennacchio et al. 2006; Gisselbrecht et al. 2013; Shlyueva et al. 2014). Because the input plasmid libraries generated in this study are a renewable resource that can be readily expanded in E. coli, the same captured regulatory elements can be assayed in numerous cell models and environmental contexts. Doing so may have particular benefit for identifying the specific cells or environments that are more relevant to a given genetic association signal.
There are both advantages and disadvantages intrinsic to the architecture of the STARR-seq assay platform. Among the advantages is the potential to characterize dual functioning enhancer-promoters (Arnold et al. 2013). We detected regulatory variants within TSS-proximal regions of two of the three genes located within our test locus, suggesting that the elements that contain these variants serve as dual function enhancer-promoters. The approach is limited by the observation that enhancers often have promoter-specific activity in transient transfection assays, indicating that alternative promoters may be required in some cases (Zabidi et al. 2015). Addressing those shortcomings will further increase the ability to assign regulatory causes to genetic associations.
Taken together, the approach demonstrated here enables measurement of the functional variation in regulatory activity across human populations and provides a novel and general path forward to identify disease-related perturbations in regulatory mechanisms after the completion of a genome-wide association study.
Methods
TruSeq custom amplicon sequencing
We defined a target region as the region containing all variants in linkage disequilibrium (LD) (D′ > 0.05) with the lead SNP previously reported to be associated with fetal adiposity (Urbanek et al. 2013). All annotated exons and all sites with evidence of putative enhancer activity as determined by the presence of DNase I hypersensitive sites (DHSs) in two or more cell lines studied by the ENCODE Project Consortium (2012) were selected for capture (Supplemental Data 1). Captured sites included 10 bp of flanking DNA to ensure that the entire putative regulatory site was included in the study. Lists of annotated DHSs from the ENCODE Project Consortium were downloaded as BED files from http://genome.ucsc.edu/ENCODE/downloads, and the union of overlapping DHSs was obtained using the “merge” command in BEDTools (Quinlan and Hall 2010). TruSeq custom amplicon probes targeting the regions as well as the exons of CCNL1, LINC00880, LINC00881, and the five exons of VEPH1 residing within the LD block were designed using the Illumina Design Studio. The probes were designed to not overlap any known SNPs and capture an additional 25 bp flanking each DNase I hypersensitive site. The final design consisted of 174 amplicons with lengths ranging from 398 to 450 bp (mean length of 409 bp and a median length of 402 bp) capturing a total of ∼60 kb of DNA (Supplemental Data 2). We designed the amplicons to be <450 bp to ensure that paired-end 250-bp sequencing would cover the entire length of the fragment. Library construction was conducted via the standard protocol provided by Illumina using 250 ng genomic DNA per reaction. The libraries were pooled and sequenced using paired-end 250-bp reads on an Illumina MiSeq instrument.
Variant calling and phasing
Sequencing reads were demultiplexed and aligned to the target regions using the standard Illumina Custom Amplicon Workflow protocol. Reads were first aligned to the downstream locus-specific and upstream locus-specific oligonucleotide primers used to amplify the targeted regions. Then, the alignment was performed using a banded Smith-Waterman alignment. Variant calling was performed using tools from the Genome Analysis Toolkit (GATK) version 3.2-2, according to GATK Best Practices recommendations (McKenna et al. 2010; DePristo et al. 2011; Van der Auwera et al. 2013). According to September 2014 guidelines for small targeted experiments, this workflow included using HaplotypeCaller to call variants in target regions individually per subject, followed by joint genotyping using GenotypeGVCFs to produce a multisample VCF. Default settings were used for both tools. After variant calling, the following annotations and thresholds were used to remove low confidence SNPs, based on GATK recommendations for hard filtering: QD < 2.0; MQ < 40.0; FS > 60.0; MQRankSum < −12.5; ReadPosRankSum < −8.0; QUAL < 100.0. Similarly, the following filters were applied to remove low confidence indels: QD < 2.0; FS > 200.0; ReadPosRankSum < −20.0; InbreedingCoeff < −0.8; QUAL < 100.0. After hard-filtering, haplotypes were estimated with SHAPEIT2 software (Delaneau et al. 2012, 2013b; O'Connell et al. 2014) using the “Read Aware Phasing” algorithm (Delaneau et al. 2013a). According to SHAPEIT2 documentation, linkage disequilibrium patterns necessary for haplotype inference can be adequately captured using MCMC sampling in studies with at least 100 subjects; therefore, reference panels were not incorporated, and default algorithm parameters were used.
Reporter input library construction
PCR amplicons from Illumina custom capture libraries from 95 individuals were pooled in equal volume. The resulting pools were then PCR amplified to add 15 bp of sequence matching the STARR-seq backbone using primers TS2SSF and TS2SSpatientR using Q5 polymerase with GC buffer (New England Biolabs) using the following cycling conditions: for 15 sec at 98°C and cycles of 10 sec at 98°C, 30 sec at 63°C, and 3 min at 72°C. The resulting products were purified using Solid Phase Reverse Immobilization (SPRI) beads at a 1.8× SPRI:reaction ratio.
The STARR-seq screening vector was digested overnight with SalI and AgeI, and linearized backbone was purified with the Wizard SV Gel and PCR Clean-Up kit (Promega). One hundred nanograms backbone and 23 ng pooled insert were cloned in two 20 μL Gibson assembly reactions. The reactions were purified using SPRI beads and eluted in 5 μL ddH20 and then transformed into Stellar chemically competent cells according to the manufacturer's protocol. Transformations were recovered for 1 h in SOC medium while shaking (225 rpm, 37°C) and then grown for 14 h in 250 mL of Luria Broth while shaking (225 rpm, 37°C). The resulting reporter input libraries were then purified using the Promega Pure Yield Maxiprep kit.
To assess variant diversity in the population STARR-seq input libraries, the fragments inserted into each were sequenced on an Illumina MiSeq. Ten nanograms of each input library were PCR amplified using indexed custom sequencing primers and Q5 polymerase in GC buffer (New England Biolabs). The following thermal cycling protocol was used: 30 sec at 98°C followed by 10 cycles of 10 sec at 98°C, 30 sec at 65°C, and 2 min at 72°C, with a final extension for 7 min at 72°C. The reporter input pool PCR product was purified using SPRI beads (1.8× SPRI:DNA ratio) and sequenced on an Illumina MiSeq Instrument using 250-bp paired-end reads. Primer sequences are available in Supplemental Table 4.
Reporter output library construction
Population STARR-seq input libraries were combined in equimolar pools and transfected into T-150 flasks of HepG2 cells with Fugene (Promega) at a 5.5:1 ratio of Fugene:DNA. Eight replicate transfections were performed. Forty-eight hours after transfection, RNA was harvested as described next.
Cells were rinsed with PBS pH 7.4 and incubated for 3 min at 37°C with DNase I (5 mg DNase I in 1 mL buffer containing 10 mM Tris-HCl pH 7.5, 150 mM NaCl, and 1 mM MgCl in DEPC-treated water diluted to a total volume of 24 mL in PBS). Cells were rinsed again with PBS and then dissociated with Trypsin-EDTA 0.25% (Life Technologies). Trypsin was neutralized with HepG2 tissue culture medium, and cells were pelleted via centrifugation. Cell pellets were rinsed once with PBS and then lysed in 2 mL of RLT buffer (Qiagen) with 2-mercaptoethanol (Sigma).
Total RNA was prepared using the Qiagen RNeasy Midi kit including the on-column DNase I digestion step. Poly-A RNA was isolated from 70 μg total RNA by double selecting with Dynabead Oligo-dT25 beads (Life Technologies). The RNA was then treated with turboDNAse (4 U) for 30 min at 37°C (Life Technologies). DNase treated poly-A RNA was purified using the RNeasy Mini kit. cDNA was synthesized using the STARR-seq gene-specific primer using SuperScript III (Life Technologies). Reaction volumes were scaled to 50 μL. Reactions were incubated for 2.5 h at 55°C and inactivated by incubating for 15 min at 70°C. Following synthesis, cDNA was treated with RNase A (Sigma) for 30 min at 37°C. cDNA was purified with SPRI beads at a 1.5:1 bead:cDNA ratio (by volume).
The cDNA was then amplified using a two-stage PCR with a protocol similar to the published STARR-seq protocol (Arnold et al. 2013). The cDNA sample from each replicate was used as input into first-round reporter-specific PCR reactions using primers “reporter specific primer1” and “reporter specific primer2,” and Q5 high-fidelity polymerase (New England Biolabs) with GC buffer (denaturing for 45 sec at 98°C, amplification with 15 cycles of 15 sec at 98°C, 30 sec at 65°C, and 70 sec at 72°C; final extension for 7 min at 72°C). Samples were then purified using SPRI beads at 1.5× ratio of bead:PCR product and eluted in 15 μL nuclease-free water. The resulting products were used as template for a second round of PCR, which used a standard Illumina TruSeq indexing primer on the p5 end of the library and custom indexing primers (Supplemental Table 3) to barcode the samples for multiplexing prior to sequencing (Illumina). Final sequencing libraries were purified with SPRI beads at a 1.5× SPRI:PCR reaction ratio.
Identifying regulatory variants in population STARR-seq
Haplotype sequences were imputed using the phased VCF file by inserting phased variants into reference sequences from the hg19 genome assembly. Sequencing reads were aligned to these haplotypes using Bowtie 2 (Langmead and Salzberg 2012) with strict match parameters (mismatch, gap open, and gap extend penalties all set to 100) to ensure exact matching to individual haplotypes. Read counts at each SNP were tallied using SAMtools mpileup (Li et al. 2009). Replicates were pooled to increase statistical power. SNPs having fewer than two reads of either input DNA or pooled RNA were discarded from further analysis. Fisher's exact test was used to detect significant differences in minor allele frequency between input DNA and output RNA; a pseudocount of 1 was added to each table entry in Fisher's exact test. Two-tailed P-values were adjusted to control the false discovery rate (FDR) to <5% via procedure p.adjust() in the standard R package “stats” (R Core Team 2015), which implements the Benjamini-Hochberg procedure (Benjamini and Hochberg 1995). Of 283 SNPs tested, 36 were found significant at an FDR-adjusted level of 0.05. SNP effect sizes for each allele were computed as the ratio of normalized read counts between variants: (RNA0/DNA0)/(RNA1/DNA1) for DNA and pooled RNA read counts for alleles 0 and 1. Haplotype effect sizes were computed as normalized ratios for each haplotype versus all pooled haplotypes at a locus
Significance was assessed via Fisher's exact test as above.
Luciferase validation assays
Selected regions were amplified from the genomic DNA from individuals who were heterozygous for regulatory variants identified via the population STARR-seq assay. Primer sequences are available in Supplemental Table 4. The amplified regions were then cloned into a modified pGL4.13 luciferase expression vector containing a Supercore1 promoter as described (Arnold et al. 2013). The construct was then transformed into TOP-10 competent cells (Life Technologies) and plated onto LB agar plates with ampicillin and incubated overnight at 37°C. In order to capture both haplotypes from subjects who were heterozygous in those regions, multiple colonies were selected and grown individually in LB media overnight. Plasmids were extracted using the PureYield Plasmid Miniprep System (Promega). Constructs were sequenced using Sanger sequencing, and variants were confirmed in dbSNP31. HepG2 cells were plated into white flat-bottom 96-well plates at a density of 25,000 cells/well. After 48 h, 100 ng of plasmid/well (1:10 Renilla:firefly luciferase ratio) was transfected with Fugene HD (Promega) at a 5.5:1 Fugene:DNA ratio. Twelve biological replicates for each construct were transfected. After 24 h, firefly luciferase and Renilla luciferase signal were quantified using the Dual-glo Luciferase Assay (Promega) using a Victor3 1420 plate reader (PerkinElmer). Normalized luciferase signal was calculated by dividing the firefly luciferase signal by the Renilla luciferase signal. Statistical significance between the normalized luciferase signals for each allele was determined using a Student's t-test.
Geuvadis eQTL analysis
Expression-QTLs and gene expression measurements were obtained from the Geuvadis project (Lappalainen et al. 2013). The expression measurements used in this manuscript were from 462 measurements that passed Geuvadis quality control and that had been PEER-factor normalized (Stegle et al. 2010) and transformed to a standard normal distribution (Lappalainen et al. 2013). Associations between quantile-normalized gene expression levels and genotype were calculated in R via the lm() function.
Allele-specific H3K27ac analysis
Allele-specific analysis of H3K27ac ChIP-seq reads was completed by using Bowtie (Langmead and Salzberg 2012) to read to both possible alleles of and flanking regions for rs73170828 and rs62274098. Reads were required to align with no mismatches (Bowtie parameter “-v 0”), and any reads that aligned equally well to both possible alleles were discarded (Bowtie parameter “-m 1”). The approach follows a previously published method that was shown to eliminate alignment biases toward the reference allele (Reddy et al. 2012). To test for allele-specific H3K27ac, the number of unique reads aligning to each allele was tabulated, and the statistical tests described were performed using R.
Data visualization
Visualization for Figure 1B and rs4266144 case study analysis in Figure 3 was completed on the UCSC Genome Browser using the GRCh37/h19 release of the human genome (Kent et al. 2002).
Data access
Raw and aligned sequencing data from the input and output STARR-seq libraries have been submitted to the NCBI Gene Expression Omnibus (GEO; http://www.ncbi.nlm.nih.gov/geo/) under accession number GSE68331.
Supplementary Material
Acknowledgments
This work was funded by the National Institutes of Health (NIH) R01 grants DK099820 and DK097534. We thank Greg Crawford for helpful discussions about this research.
Author contributions: C.M.V., C.G., and T.E.R. conceived the study. C.M.V. designed and performed STARR-seq experiments and rs4266144 analysis. C.G. designed and performed custom capture sequencing and luciferase validation experiments. M.N., D.M.S., M.G.H., and C.G. performed the analysis to identify genetic variants in the captured regions. C.G., W.H.M., and T.E.R. designed and performed the analysis of the STARR-seq data. W.L.L. contributed DNA from the HAPO cohort. W.L.L. and T.E.R. funded the research. All authors contributed to the writing of the manuscript.
Footnotes
[Supplemental material is available for this article.]
Article published online before print. Article, supplemental material, and publication date are at http://www.genome.org/cgi/doi/10.1101/gr.190090.115.
References
- The 1000 Genomes Project Consortium. 2012. An integrated map of genetic variation from 1,092 human genomes. Nature 491: 56–65. [DOI] [PMC free article] [PubMed] [Google Scholar]
- Arnold CD, Gerlach D, Stelzer C, Boryn´ LM, Rath M, Stark A. 2013. Genome-wide quantitative enhancer activity maps identified by STARR-seq. Science 339: 1074–1077. [DOI] [PubMed] [Google Scholar]
- Battle A, Mostafavi S, Zhu X, Potash JB, Weissman MM, McCormick C, Haudenschild CD, Beckman KB, Shi J, Mei R, et al. 2014. Characterizing the genetic basis of transcriptome diversity through RNA-sequencing of 922 individuals. Genome Res 24: 14–24. [DOI] [PMC free article] [PubMed] [Google Scholar]
- Benjamini Y, Hochberg Y. 1995. Controlling the false discovery rate: a practical and powerful approach to multiple testing. J R Stat Soc Series B Stat Methodol 57: 289–300. [Google Scholar]
- Birney E, Lieb JD, Furey TS, Crawford GE, Iyer VR. 2010. Allele-specific and heritable chromatin signatures in humans. Hum Mol Genet 19: R204–R209. [DOI] [PMC free article] [PubMed] [Google Scholar]
- Blanchette M, Kent WJ, Riemer C, Elnitski L, Smit AF, Roskin KM, Baertsch R, Rosenbloom K, Clawson H, Green ED, et al. 2004. Aligning multiple genomic sequences with the threaded blockset aligner. Genome Res 14: 708–715. [DOI] [PMC free article] [PubMed] [Google Scholar]
- Cantor RM, Lange K, Sinsheimer JS. 2010. Prioritizing GWAS results: a review of statistical methods and recommendations for their application. Am J Hum Genet 86: 6–22. [DOI] [PMC free article] [PubMed] [Google Scholar]
- Choi Y, Sims GE, Murphy S, Miller JR, Chan AP. 2012. Predicting the functional effect of amino acid substitutions and indels. PLoS One 7: e46688. [DOI] [PMC free article] [PubMed] [Google Scholar]
- Corradin O, Saiakhova A, Akhtar-Zaidi B, Myeroff L, Willis J, Cowper-Sal-lari R, Lupien M, Markowitz S, Scacheri PC. 2014. Combinatorial effects of multiple enhancer variants in linkage disequilibrium dictate levels of gene expression to confer susceptibility to common traits. Genome Res 24: 1–13. [DOI] [PMC free article] [PubMed] [Google Scholar]
- Creyghton MP, Cheng AW, Welstead GG, Kooistra T, Carey BW, Steine EJ, Hanna J, Lodato MA, Frampton GM, Sharp PA, et al. 2010. Histone H3K27ac separates active from poised enhancers and predicts developmental state. Proc Natl Acad Sci 107: 21931–21936. [DOI] [PMC free article] [PubMed] [Google Scholar]
- Degner JF, Pai AA, Pique-Regi R, Veyrieras JB, Gaffney DJ, Pickrell JK, De Leon S, Michelini K, Lewellen N, Crawford GE, et al. 2012. DNase I sensitivity QTLs are a major determinant of human expression variation. Nature 482: 390–394. [DOI] [PMC free article] [PubMed] [Google Scholar]
- Delaneau O, Marchini J, Zagury JF. 2012. A linear complexity phasing method for thousands of genomes. Nat Methods 9: 179–181. [DOI] [PubMed] [Google Scholar]
- Delaneau O, Howie B, Cox AJ, Zagury JF, Marchini J. 2013a. Haplotype estimation using sequencing reads. Am J Hum Genet 93: 687–696. [DOI] [PMC free article] [PubMed] [Google Scholar]
- Delaneau O, Zagury JF, Marchini J. 2013b. Improved whole-chromosome phasing for disease and population genetic studies. Nat Methods 10: 5–6. [DOI] [PubMed] [Google Scholar]
- DePristo MA, Banks E, Poplin R, Garimella KV, Maguire JR, Hartl C, Philippakis AA, del Angel G, Rivas MA, Hanna M, et al. 2011. A framework for variation discovery and genotyping using next-generation DNA sequencing data. Nat Genet 43: 491–498. [DOI] [PMC free article] [PubMed] [Google Scholar]
- The ENCODE Project Consortium. 2012. An integrated encyclopedia of DNA elements in the human genome. Nature 489: 57–74. [DOI] [PMC free article] [PubMed] [Google Scholar]
- Ernst J, Kellis M. 2012. ChromHMM: automating chromatin-state discovery and characterization. Nat Methods 9: 215–216. [DOI] [PMC free article] [PubMed] [Google Scholar]
- Feng Q, Vickers KC, Anderson MP, Levin MG, Chen W, Harrison DG, Wilke RA. 2013. A common functional promoter variant links CNR1 gene expression to HDL cholesterol level. Nat Commun 4: 1973. [DOI] [PMC free article] [PubMed] [Google Scholar]
- Fogarty MP, Cannon ME, Vadlamudi S, Gaulton KJ, Mohlke KL. 2014. Identification of a regulatory variant that binds FOXA1 and FOXA2 at the CDC123/CAMK1D type 2 diabetes GWAS locus. PLoS Genet 10: e1004633. [DOI] [PMC free article] [PubMed] [Google Scholar]
- Gisselbrecht SS, Barrera LA, Porsch M, Aboukhalil A, Estep PW III, Vedenko A, Palagi A, Kim Y, Zhu X, Busser BW, et al. 2013. Highly parallel assays of tissue-specific enhancers in whole Drosophila embryos. Nat Methods 10: 774–780. [DOI] [PMC free article] [PubMed] [Google Scholar]
- Guo C, Ludvik AE, Arlotto ME, Hayes MG, Armstrong LL, Scholtens DM, Brown CD, Newgard CB, Becker TC, Layden BT, et al. 2015. Coordinated regulatory variation associated with gestational hyperglycaemia regulates expression of the novel hexokinase HKDC1. Nat Commun 6: 6069. [DOI] [PMC free article] [PubMed] [Google Scholar]
- Gusev A, Lee SH, Trynka G, Finucane H, Vilhjálmsson BJ, Xu H, Zang C, Ripke S, Bulik-Sullivan B, Stahl E, et al. 2014. Partitioning heritability of regulatory and cell-type-specific variants across 11 common diseases. Am J Hum Genet 95: 535–552. [DOI] [PMC free article] [PubMed] [Google Scholar]
- Hu H, Huff CD, Moore B, Flygare S, Reese MG, Yandell M. 2013. VAAST 2.0: improved variant classification and disease-gene identification using a conservation-controlled amino acid substitution matrix. Genet Epidemiol 37: 622–634. [DOI] [PMC free article] [PubMed] [Google Scholar]
- Kent WJ, Sugnet CW, Furey TS, Roskin KM, Pringle TH, Zahler AM, Haussler D. 2002. The human genome browser at UCSC. Genome Res 12: 996–1006. [DOI] [PMC free article] [PubMed] [Google Scholar]
- Kilpinen H, Waszak SM, Gschwind AR, Raghav SK, Witwicki RM, Orioli A, Migliavacca E, Wiederkehr M, Gutierrez-Arcelus M, Panousis NI, et al. 2013. Coordinated effects of sequence variation on DNA binding, chromatin structure, and transcription. Science 342: 744–747. [DOI] [PMC free article] [PubMed] [Google Scholar]
- Kwasnieski JC, Mogno I, Myers CA, Corbo JC, Cohen BA. 2012. Complex effects of nucleotide variants in a mammalian cis-regulatory element. Proc Natl Acad Sci 109: 19498–19503. [DOI] [PMC free article] [PubMed] [Google Scholar]
- Langmead B, Salzberg SL. 2012. Fast gapped-read alignment with Bowtie 2. Nat Methods 9: 357–359. [DOI] [PMC free article] [PubMed] [Google Scholar]
- Lappalainen T, Sammeth M, Friedländer MR, ‘t Hoen PA, Monlong J, Rivas MA, Gonzàlez-Porta M, Kurbatova N, Griebel T, Ferreira PG, et al. 2013. Transcriptome and genome sequencing uncovers functional variation in humans. Nature 501: 506–511. [DOI] [PMC free article] [PubMed] [Google Scholar]
- Li B, Leal SM. 2008. Methods for detecting associations with rare variants for common diseases: application to analysis of sequence data. Am J Hum Genet 83: 311–321. [DOI] [PMC free article] [PubMed] [Google Scholar]
- Li H, Handsaker B, Wysoker A, Fennell T, Ruan J, Homer N, Marth G, Abecasis G, Durbin R, Genome Project Data Processing S. 2009. The Sequence Alignment/Map format and SAMtools. Bioinformatics 25: 2078–2079. [DOI] [PMC free article] [PubMed] [Google Scholar]
- Maurano MT, Humbert R, Rynes E, Thurman RE, Haugen E, Wang H, Reynolds AP, Sandstrom R, Qu H, Brody J, et al. 2012. Systematic localization of common disease-associated variation in regulatory DNA. Science 337: 1190–1195. [DOI] [PMC free article] [PubMed] [Google Scholar]
- McDaniell R, Lee BK, Song L, Liu Z, Boyle AP, Erdos MR, Scott LJ, Morken MA, Kucera KS, Battenhouse A, et al. 2010. Heritable individual-specific and allele-specific chromatin signatures in humans. Science 328: 235–239. [DOI] [PMC free article] [PubMed] [Google Scholar]
- McKenna A, Hanna M, Banks E, Sivachenko A, Cibulskis K, Kernytsky A, Garimella K, Altshuler D, Gabriel S, Daly M, et al. 2010. The Genome Analysis Toolkit: a MapReduce framework for analyzing next-generation DNA sequencing data. Genome Res 20: 1297–1303. [DOI] [PMC free article] [PubMed] [Google Scholar]
- Melnikov A, Murugan A, Zhang X, Tesileanu T, Wang L, Rogov P, Feizi S, Gnirke A, Callan CG Jr, Kinney JB, et al. 2012. Systematic dissection and optimization of inducible enhancers in human cells using a massively parallel reporter assay. Nat Biotechnol 30: 271–277. [DOI] [PMC free article] [PubMed] [Google Scholar]
- Nicolae DL, Gamazon E, Zhang W, Duan S, Dolan ME, Cox NJ. 2010. Trait-associated SNPs are more likely to be eQTLs: annotation to enhance discovery from GWAS. PLoS Genet 6: e1000888. [DOI] [PMC free article] [PubMed] [Google Scholar]
- O'Connell J, Gurdasani D, Delaneau O, Pirastu N, Ulivi S, Cocca M, Traglia M, Huang J, Huffman JE, Rudan I, et al. 2014. A general approach for haplotype phasing across the full spectrum of relatedness. PLoS Genet 10: e1004234. [DOI] [PMC free article] [PubMed] [Google Scholar]
- Olansky L, Welling C, Giddings S, Adler S, Bourey R, Dowse G, Serjeantson S, Zimmet P, Permutt MA. 1992. A variant insulin promoter in non-insulin-dependent diabetes mellitus. J Clin Invest 89: 1596–1602. [DOI] [PMC free article] [PubMed] [Google Scholar]
- Patwardhan RP, Lee C, Litvin O, Young DL, Pe'er D, Shendure J. 2009. High-resolution analysis of DNA regulatory elements by synthetic saturation mutagenesis. Nat Biotechnol 27: 1173–1175. [DOI] [PMC free article] [PubMed] [Google Scholar]
- Patwardhan RP, Hiatt JB, Witten DM, Kim MJ, Smith RP, May D, Lee C, Andrie JM, Lee SI, Cooper GM, et al. 2012. Massively parallel functional dissection of mammalian enhancers in vivo. Nat Biotechnol 30: 265–270. [DOI] [PMC free article] [PubMed] [Google Scholar]
- Pennacchio LA, Ahituv N, Moses AM, Prabhakar S, Nobrega MA, Shoukry M, Minovitsky S, Dubchak I, Holt A, Lewis KD, et al. 2006. In vivo enhancer analysis of human conserved non-coding sequences. Nature 444: 499–502. [DOI] [PubMed] [Google Scholar]
- Quinlan AR, Hall IM. 2010. BEDTools: a flexible suite of utilities for comparing genomic features. Bioinformatics 26: 841–842. [DOI] [PMC free article] [PubMed] [Google Scholar]
- R Core Team. 2015. R: a language and environment for statistical computing. R Foundation for Statistical Computing, Vienna, Austria http://www.R-project.org/. [Google Scholar]
- Reddy TE, Gertz J, Pauli F, Kucera KS, Varley KE, Newberry KM, Marinov GK, Mortazavi A, Williams BA, Song L, et al. 2012. Effects of sequence variation on differential allelic transcription factor occupancy and gene expression. Genome Res 22: 860–869. [DOI] [PMC free article] [PubMed] [Google Scholar]
- Sherry ST, Ward MH, Kholodov M, Baker J, Phan L, Smigielski EM, Sirotkin K. 2001. dbSNP: the NCBI database of genetic variation. Nucleic Acids Res 29: 308–311. [DOI] [PMC free article] [PubMed] [Google Scholar]
- Shlyueva D, Stelzer C, Gerlach D, Yáñez-Cuna JO, Rath M, Boryn´ LM, Arnold CD, Stark A. 2014. Hormone-responsive enhancer-activity maps reveal predictive motifs, indirect repression, and targeting of closed chromatin. Mol Cell 54: 180–192. [DOI] [PubMed] [Google Scholar]
- Stadhouders R, Aktuna S, Thongjuea S, Aghajanirefah A, Pourfarzad F, van Ijcken W, Lenhard B, Rooks H, Best S, Menzel S, et al. 2014. HBS1L-MYB intergenic variants modulate fetal hemoglobin via long-range MYB enhancers. J Clin Invest 124: 1699–1710. [DOI] [PMC free article] [PubMed] [Google Scholar]
- Stegle O, Parts L, Durbin R, Winn J. 2010. A Bayesian framework to account for complex non-genetic factors in gene expression levels greatly increases power in eQTL studies. PLoS Comput Biol 6: e1000770. [DOI] [PMC free article] [PubMed] [Google Scholar]
- Stranger BE, Raj T. 2013. Genetics of human gene expression. Curr Opin Genet Dev 23: 627–634. [DOI] [PubMed] [Google Scholar]
- Urbanek M, Hayes MG, Armstrong LL, Morrison J, Lowe LP, Badon SE, Scheftner D, Pluzhnikov A, Levine D, Laurie CC, et al. 2013. The chromosome 3q25 genomic region is associated with measures of adiposity in newborns in a multi-ethnic genome-wide association study. Hum Mol Genet 22: 3583–3596. [DOI] [PMC free article] [PubMed] [Google Scholar]
- Van der Auwera GA, Carneiro MO, Hartl C, Poplin R, Del Angel G, Levy-Moonshine A, Jordan T, Shakir K, Roazen D, Thibault J, et al. 2013. From FastQ data to high confidence variant calls: the Genome Analysis Toolkit best practices pipeline. Curr Protoc Bioinformatics 11: 11 10 11–11 10 33. [DOI] [PMC free article] [PubMed] [Google Scholar]
- White MA, Myers CA, Corbo JC, Cohen BA. 2013. Massively parallel in vivo enhancer assay reveals that highly local features determine the cis-regulatory function of ChIP-seq peaks. Proc Natl Acad Sci 110: 11952–11957. [DOI] [PMC free article] [PubMed] [Google Scholar]
- Zabidi MA, Arnold CD, Schernhuber K, Pagani M, Rath M, Frank O, Stark A. 2015. Enhancer–core-promoter specificity separates developmental and housekeeping gene regulation. Nature 518: 556–559. [DOI] [PMC free article] [PubMed] [Google Scholar]
- Zawistowski M, Gopalakrishnan S, Ding J, Li Y, Grimm S, Zollner S. 2010. Extending rare-variant testing strategies: analysis of noncoding sequence and imputed genotypes. Am J Hum Genet 87: 604–617. [DOI] [PMC free article] [PubMed] [Google Scholar]
Associated Data
This section collects any data citations, data availability statements, or supplementary materials included in this article.