

Abstract
Patients with acute respiratory distress syndrome receiving mechanical ventilation typically experience repetitive closure (derecruitment) and subsequent reopening (recruitment) of airways and alveoli. This can lead, over time, to further ventilator-induced lung injury (VILI). Recruitment and derecruitment (R/D) thus reflect both the current level of lung injury and the risk for sustaining further injury. Accordingly, we investigated how the dynamics of R/D are altered as VILI develops following application of high tidal volume ventilation in initially healthy mice. R/D occurring on subsecond timescales was assessed from the shape of the pressure–volume (PV) loop measured during a single large breath. R/D occurring on a timescale of minutes was evaluated via a derecruitability test in which we tracked the progressive increases in lung elastance occurring during periods of mechanical ventilation immediately following a recruitment maneuver. The degrees of R/D occurring on these different times scales were strongly correlated. To interpret these findings in quantitative terms, we developed a computational model of the lung in which changes in lung volume occurred both via R/D and distention of already open lung units. Fitting this model to measured PV loops indicates that VILI causes R/D both to increase and to occur at progressively higher pressures, and that the lung tissue that remains open during the breath becomes progressively more overdistended. We conclude that the dynamic PV loop in conjunction with our computationalmodel can be used to assess the current injury state of the lung as well as its likelihood of sustaining further VILI.
Index Terms: Airway closure, computational model, lung elastance, mechanical ventilation, open lung
I. Introduction
Acute respiratory distress syndrome (ARDS) is characterized by ongoing derecruitment (closure) and recruitment (reopening) of airways and alveoli during mechanical ventilation. These are injurious events that may increase with, and contribute to, the subsequent development of ventilator-induced lung injury (VILI). Accordingly, the propensity for the lungs to derecruit during mechanical ventilation reflects both the current level of injury and the risk for sustaining further injury. Assessing the nature and extent of lung recruitment and derecruitment (R/D), however, is complicated by the fact that both phenomena are dynamic, meaning that the amount of open lung pertaining at any point in time during ventilation is a function not only of the current state of lung inflation but also of inflation history.
We have previously established a sensitive technique for assessing the dynamics of R/D in the lung by performing what we term a “derecruitability test.” This test begins with a recruitment maneuver that is immediately followed by several minutes of regular mechanical ventilation with a modest tidal volume Vt during which lung elastance is tracked. Repeating this maneuver at a variety of positive end-expiratory pressures (PEEP) [1]–[8] allows us to model the dynamics of airspace opening and closing as a function of pressure and time in a way that can be related to pathological changes in the biophysics of the air–liquid interface [1], [9]. This suggests that assessments of lung derecruitability might be useful in deciding how to treat the injured lung by, for example, adjusting the parameters of mechanical ventilation or administering surfactant therapy. However, our existing approach for assessing lung derecruitability is problematic in terms of potential clinical utility because it takes several minutes to complete, is somewhat cumbersome to administer, and may exacerbate VILI when PEEP is low. Nevertheless, the information it provides could potentially be extremely useful in determining how to ventilate a given injured lung.
We therefore sought to determine if the dynamic derecruitability of the lungs can be evaluated in a more rapid and less obtrusive manner, such as that might eventually suit clinical application. In particular, we focused on the possible use of the dynamic pressure–volume (PV) relationship for this purpose because it is well known that PV loop hysteresis is due in part to R/D [10]–[23]. Furthermore, a dynamic PV relationship can be obtained, in principle, during a single large breath. The question remains, however, as to whether such a PV relationship reflects the dynamic nature of R/D with sufficiently fidelity for monitoring the injury status of the lungs. In this study, we addressed this question in mice receiving injurious mechanical ventilation by following their changing PV relationships as VILI developed. We interpreted the experimental observations with the aid of a computational model of the lung that incorporates both nonlinear tissue properties and variable degrees of R/D.
II. Materials and Methods
A. Animal Procedures
Healthy 8–10 week old BALB/c mice (Jackson Laboratories, Bar Harbor, ME, USA) with an average weight of 21.9 g were anesthetized with 90 μg·kg−1 intraperitoneal (IP) sodium pentobarbital. An 18-gauge cannula was inserted into the trachea and connected to a flexiVent small animal ventilator (SCIREQ, Montreal, QC, Canada). Baseline ventilation (Vt = 0.25 mL, 200 breaths·min−1, PEEP = 3 cmH2O, FiO2 = 0.21) was applied for 20 min to stabilize the animal. During this period the delivered Vt was approximately 0.20 mL, or ≈9 mL/kg, which has been shown not to appreciably change lung function in healthy BALB/c mice [7]. To prevent any spontaneous breathing efforts, we administered 0.8 mg·kg−1 IP pancuronium bromide following cannulation. At the conclusion of the stabilization period, the ventilation protocol described below was applied to induce VILI. To ensure that adequate anesthesia was maintained, while the animals were paralyzed, we administered 5 μg·kg−1 IP sodium pentobarbital injections at 30-min intervals. Heart rate was also monitored via ECG as an autonomic indicator of depth of anesthesia. At the end of the experimental period of mechanical ventilation, the animals were euthanized with an IP injection of 150 μg·kg−1 pentobarbital followed by cervical dislocation. This protocol was approved by the Institutional Animal Care and Use Committee of the University of Vermont, and animal treatment was in compliance with the Animal Welfare Act.
B. Experimental Protocol
Note that we have reported the derecruitability data described below in a previous publication [24] that focused on a different scientific question.
At the conclusion of the 20-min stabilization period, we continued the baseline ventilation and applied a recruitment maneuver consisting of an inspiration delivered by ramping airway pressure up to 30 cmH2O over 3 s followed by a 3 s end-inspiratory pause. PEEP was then reduced to 0 cmH2O, a second recruitment maneuver was performed, and a 2-s multifrequency (0.5–20.5 Hz) volume perturbation was applied to the lungs for the measurement of respiratory input impedance from which we obtained a measure of respiratory elastance H via the constant-phase model [8] as previously described [2], [3], [7], [9], [25].
Immediately following the above steps, we began the protocol to develop and monitor VILI. This protocol consisted of two components. First, we conducted a 4.5-min derecruitability test with Vt = 0.25 mL at 200 breaths·min−1 and PEEP = 0 during which H was measured every 20 s. We then applied 16.5 min of continuous high Vt ventilation at 50 breaths·min−1 and PEEP = 0, where Vt = 1.0, 1.1, 1.2, or 1.3 mL depending on the experimental group. During this overventilation epoch, we recorded dynamic PV loops at 5.5-min intervals while lung volume was cycled with a frequency of 1 Hz at the same Vt as used during the high-Vt ventilation. The pressure P and volume V data recorded by the flexiVent during these cycles were corrected for gas compression in the ventilator cylinder so that they corresponded to pressure and volume at the tracheal cannula.
The procedure described earlier, consisting of a 4.5-min derecruitability test followed by a 16.5min epoch of damaging overventilation interspersed with dynamic PV loops recorded every 5.5 min, was repeated until either the animal expired or 4 h had elapsed.
C. Computational Model
Fig. 1 illustrates the computational model we developed to interpret the dynamic PV relationships observed in mice with VILI, and the model parameters and variables are defined in Table I. The model consists of a single alveolar compartment having two degrees of freedom; ε(t) represents expansion of the already open parenchymal tissue, and φ(t) represents the fraction of the total available tissue that is open, so that total volume is
Fig. 1.

Schematic representation of the computational model of the lung. See Table I and text for the definition of variables and parameters.
TABLE I.
Nomenclature
| Variable | Description |
|---|---|
| Vt [ml] | Ventilation tidal volume |
| V [ml] | Ventilation volume delivered at trachea |
| V̇ [ml/s] | Tracheal airflow rate |
| P [cmH2O] | Measured tracheal pressure |
| H [cmH2O·s·ml−1] | Measured elastance (constant phase model) |
| H1 [cmH2O·s·ml−1] | Elastance measured after 20 seconds of derecruitability test |
| DRate [cmH2O·s·ml−1] | Change in elastance per minute from first to last measurements in derecruitability test |
| H200μL [cmH2O·ml−1] | P/V at 0.2 ml on inspiration during high Vt ventilation |
| Raw [cmH2O·ml·s−1] | Airway resistance |
| ϕ(t) [cm2] | Predicted open fraction of the lung |
| ε(t) [cm] | Predicted level of distention of the open lung |
| R(ε) [cmH2O·cm·s] | Model damper resistance |
| ηc [s] | Model hysteresivity constant |
| E (ε) [cmH2O·cm] | Model spring stiffness |
| EBase [cmH2O·cm] | Linear component of model spring stiffness |
| EFac [cmH2O·cm−1] | Nonlinear factor in model spring stiffness |
| εCrit [cm] | Level of tissue distention at which model spring stiffness becomes nonlinear |
| Pmodel [cmH2O] | Computed tracheal pressure |
| (1) |
An increase in lung volume may thus be accommodated by a combination of recruitment of additional lung units (i.e., increasing φ) and distention of the units that are already open (i.e., increasing ε). φ(t) is computed as part of the solution process to match the observed pressure as described below. This, in turn, determines the recoil characteristics of the horizontal bellows in Fig. 1 that allows for variations in φ(t).
The mechanical properties of the parenchymal tissue are assumed to be both viscoelastic and nonlinear, and are represented by a Kelvin–Voigt model consisting of a spring and viscous damper in parallel, as shown in Fig. 1. The stiffness, E, of the spring is represented by the piecewise continuous function
| (2) |
where EBase and EFac define the intrinsic stiffness of the lung tissue and εCrit defines the level of tissue distension at which its elastic behavior transitions from linear to nonlinear. The damper is assumed to have a functionally equivalent nonlinear resistance given by
| (3) |
where ηC is a constant equivalent to hysteresivity [26]. The forces exerted by the spring and the dashpot are then
| (4) |
and
| (5) |
respectively. The pressure, Pmodel, at the entrance to the model airway is comprised of the elastic and viscous pressures across the tissue together with the resistive pressure drop across the airway thus
| (6) |
where Raw = 0.25 cmH2O·s·mL−1 to match experimental observations for a normal mouse, and V̇ (t) is flow. The distention of the aerated tissue is determined by integrating
| (7) |
with respect to t using the forward Euler method with a time step of 0.001 s.
The values of the constants EBase, EFac, εCrit, and ηC were determined for each mouse by fitting the model to its respective P and V data sets, obtained from the flexiVent, during high-Vt ventilation as described above. Prior to model fitting, these data sets were adjusted using cubic spline interpolation in order to satisfy the Neumann boundary conditions dV/dt = 0 and dP/dt = 0 at the beginning and end of each data epoch. V̇ was evaluated as dV/dt.
At each time step in the solution process φ(t) was computed by minimizing |P(t) – Pmodel(t)| using a golden section search and parabolic interpolation (MathWorks, Natick, MA, USA), while dφ/dt was calculated as a first-order backward difference. E and R [(2) and (3), respectively] were determined independently for each subject in the experimental trial using MATLAB’s pattern search optimization algorithm (MathWorks, Natick, MA, USA) to minimize the objective function
| (8) |
χ is thus a composite cost function consisting of the sum of three terms. The first and third terms are the root mean square errors between P and Pmodel over the first measured PV breath ( ) and the nth breath ( ). We found that including both of these terms in the cost function, rather than simply the error over the first breath, improved the quality of the fits at high injury levels. The second term in the cost function is , where nt is the number of time-steps in the breath. This term is evaluated only over the first PV measurement and has the effect of causing the optimization algorithm to seek solutions with minimal R/D in the uninjured lung. Finally, to discourage the model from predicting derecruitment during inspiration, a scenario which we consider unlikely, contributions to the cost function at time steps during inspiration when φ(t) < φ(t–dt) were scaled by a factor of 10.
III. Results
Fig. 2 shows a sequence of derecruitability tests in a representative mouse with developing VILI; injurious ventilation (Vt =1.2mL)was interrupted every 16.5min for the application of 4.5 min of low-Vt, PEEP = 0 ventilation during which H was measured every 20 s (see closed circles in Fig. 2). Linear fits to H during each derecruitment epoch provide DRate = dH/dt (gray lines in Fig. 2) as a measure of the rate of derecruitment occurring on a timescale of minutes [24].
Fig. 2.
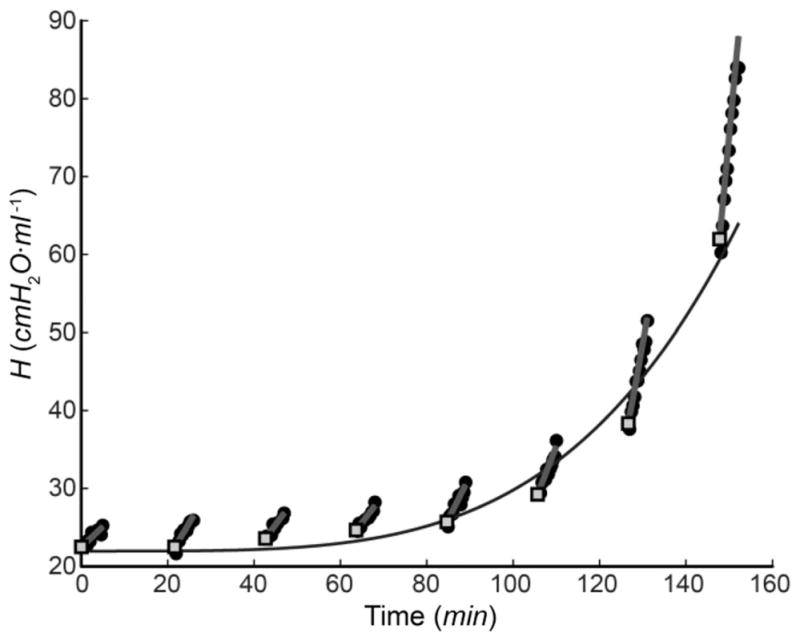
Measurements of lung elastance H during a sequence of derecruitability tests spaced 16.5 min apart for a representative mouse in the Vt = 1.2 mL group. Filled circles—experimental data; straight line segments—linear fits to each derecruitability test; open squares—H1 ; continuous curve—fit of (9) to the H1 values.
The earliest value of each of the fitted line segments, denoted H1 (see filled squares in Fig. 2), provides an estimate of the degree of airspace closure at the first measurement point in each 4.5-min period of low-Vt ventilation, which occurred 20 s after the interruption of high-Vt ventilation. The continuous black line in Fig. 2 shows the fit to the H1 values provided by the empirical equation
| (9) |
The parameter τH thus provides a measure of the rate of degradation in lung function, as we have described previously [24].
Fig. 3 shows dynamic PV loops measured at various time points throughout the period of mechanical ventilation from the same animal as shown in Fig. 2, and demonstrates that loop hysteresis and peak pressure PMax both increase progressively as injury worsens (dashed lines). We calculated a low-volume inspiratory elastance as the ratio H200μL = P/V for V = 200 μL on the ascending limbs of each of the PV loops (refer to the horizontal dotted line). Fig. 3 shows that H200μL increased progressively and markedly with injury. Also shown in Fig. 3 are the fits (solid lines) provided by the model in Fig. 1. These fits are visually virtually indistinguishable from the measured PV relationships.
Fig. 3.

Dynamic PV loops measured at the indicated times points overventilation from the representative mouse in Fig. 2 (dashed lines) together with the fits provided by the computational model in Fig. 1 (solid lines). Symbols indicate the location of corner points on the inspiratory limbs of selected curves.
Based on the assumption that the mice were perfectly normal (i.e., uninjured) at the beginning of the experiment, we assessed the degree of subsequent injury severity in two ways. The first injury measure was derived from the sequence of derecruitability tests (see Fig. 2), and was taken to be the change in H1 relative to baseline, i.e., ΔH1 (t) = H1 (t) – ΔH1 (0). The second injury measure was derived from the dynamic PV loops (see Fig. 3), and was taken to be the change in H200μL relative to baseline, i.e., ΔH200μL(t) = H200μL(t) – H200μL(0). These measures of VILI are strongly correlated and exhibit a sigmoidal relationship (see Fig. 4). We fit this sigmoidal relationship with the equation
Fig. 4.

Relationship between the increase in H1 caused by VILI and the corresponding increase in H200μL (symbols represent the data from all mice in all Vt groups). The fit provided by (10) is shown as the solid curve.
| (10) |
where ζ = ΔH1 (t). Fig. 5 shows that a quasi-sigmoidal relationship also exists between H200μL(t) and DRate (see (10), ζ = DRate ). The parameter values for the fits shown in Figs. 4 and 5 are given in Table II.
Fig. 5.
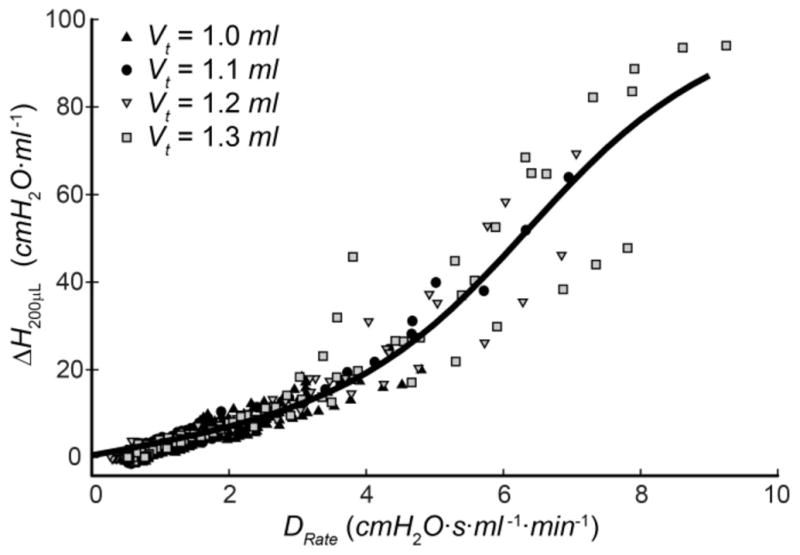
Relationship between the increase in DRate caused by VILI and the corresponding increase in H200μL (symbols represent the data from all mice in all Vt groups). The fit provided by (10) is shown as the solid curve.
TABLE II.
Parameter Values for H200μL Fits Using (10)
| ζ = ΔH1 | ζ = DRate | |
|---|---|---|
| a | 52.87 | 72.44 |
| b | 0.095 | 0.81 |
| c | 43.25 | 6.36 |
| d | 0.69 | 2.48 |
| R2 | 0.96 | 0.92 |
The computational model shown in Fig. 1 was fit simultaneously to two PV loops from each animal studied; the first loop and the loop corresponding to ΔH1 = 15. The mean ± SD of the resulting model parameter values are listed in Table III. One-way analysis of variance and the Tukey–Kramer multiple comparisons test were used to determine significant differences between parameter values (indicated with symbols in Table III). The corresponding average spring elastances in the model (E as functions of ε) for each group are plotted in Fig. 6, and show that intrinsic tissue stiffness decreases with increasing Vt.
TABLE III.
Mean ± SD Model Parameters
| Vt = 1.0 ml | Vt = 1.1 ml | Vt = 1.2 ml | Vt = 1.3 ml | |
|---|---|---|---|---|
| EBase [cmH2O cm] | 12.9 ± 1.4*† | 10.4 ± 1.5 | 9.3 ± 1.9* | 9.0 ± 1.3† |
| EFac [cmH2O/cm] | 163.9 ± 30.0† | 164.9 ± 37.6‡ | 159.2 ± 15.9* | 104.5 ± 21.9†‡* |
| εcrit [cm] | 0.49 ± 0.03†‡* | 0.57 ± 0.03† | 0.60 ± 0.004‡ | 0.60 ± 0.005* |
| ηc [sec] | 0.003 ± 0.004 | 0.004 ± 0.004 | 0.001 ± 0.0004 | 0.001 ± 0.0003 |
Symbols indicate a significant difference (p < 0.05) between groups.
Fig. 6.

Prediction of lung elastance provided by (2) for the four different Vt groups (curves show the average of the individual mice in each group).
Fig. 7 shows the average PV loops [see Fig. 7(a)] for the four Vt groups at baseline (prior to injury) along with their corresponding plots of φ versus V [see Fig. 7(b)] predicted by fitting the computational model to the PV loops. The four groups demonstrate similar qualitative behavior in both sets of curves, although different Vt produced different PMax. Note that the model was fit to each group separately, so φ is normalized to a maximum value of 1 (i.e., a fully open lung) in each case.
Fig. 7.

(a) PV loops under baseline (noninjured) conditions. (b) Fraction of open lung throughout the breath predicted by the computational model in Fig. 1. Curves show the average of the individual mice in each of the four different Vt groups.
Fig. 8 shows φ versus P for a variety of injury levels from the Vt = 1.2 mL group with the inspiratory and expiratory components reflecting R/D, respectively. Note that in order to produce each of the averaged data sets shown in Figs. 7, 8, and 9 the data from the individual mice were selected to have the same values of ΔH1 (9) and therefore presumably the same degree of VILI. This strategy was also used to select the nth time point used in the objective function [ in (8)] for which ΔH1 = 15. This term in (8) therefore represents a moderate level of injury.
Fig. 8.

Average fraction of open lung at selected levels of lung injury for the Vt = 1.2 mL group.
Fig. 9.

Distension of the open lung tissue during inspiration at selected levels of lung injury. Curves show the average of the individual mice in the Vt = 1.2 mL group.
Fig. 9 shows how the model predictions of ε versus V during inspiration evolve as VILI develops for the Vt = 1.2 mL group. The average value of εCrit for the mice in this group, determined to be 0.6, is indicated by the horizontal line in Fig. 9 and shows that the transition from linear to nonlinear elastic behavior in the tissue occurred at progressively lower V as injury developed. This occurred because injury caused an increasing amount of the lung to become derecruited, resulting in increasing overdistension of the remaining open lung.
IV. Discussion
ARDS is a relatively common condition with an incidence of 78.9/100 000 persons per year [27] and a pooled mortality rate of 43% [28]. Treatment involves supportive mechanical ventilation, which carries the risk of VILI and its associated increase in mortality [11], [29], [30]. Therefore, in patients with ARDS, appropriate ventilator management is of the utmost importance. Currently, the standard of care is a one-size-fits-all approach, and consists of administering a tidal volume of 6 mL/kg ideal body weight, based on the ARDSNet study [31]. This is very unlikely to be optimal in all patients. Indeed, it seems almost axiomatic that tidal volumes and other parameters of ventilation should be tailored to a patient’s particular physiology and injury severity. We do not yet know how to determine which ventilator regimen is optimal in any given case, but it is clear that a personalized approach to the management of ARDS is going to require rapid and continual feedback about the injury status of the lung. This more or less mandates that injury assessment be based on some aspect of the mechanical behavior of the lung because changes in this behavior are reflective of injury and can be determined on a breath-by-breath basis.
We have shown that a key feature of mechanical function relevant to the injured lung is the phenomenon we term derecruitability, which captures the way in which H increases over time during a period of low-Vt ventilation immediately following a recruitment maneuver [1]–[7], [24]. We have also shown, using both microcomputed tomography [9] and in vivo microscopy [1], that such increases in H are inversely related to the degree of lung derecruitment. Accordingly, derecruitability provides a sensitive reflection of the degree of lung injury, as illustrated in Fig. 2. Furthermore, the time-course of H during a derecruitability test can be conveniently encapsulated in terms of the two parameters H1 and DRate, which themselves are closely linked in mice with VILI [24]. This suggests that either parameter on its own ought to have utility as a measure of VILI. However, administering a derecruitability test takes several minutes during which PEEP should be as low as possible, or even zero, in order to elicit significant changes in H. In addition, a period of low or zero PEEP ventilation in ARDS/VILI patients would be potentially harmful. These features makes such a test unattractive for the assessment of lung injury in patients, which motivated us to undertake the current study in which we investigated the possibility that the PV relationship measured over a single large breath might contain the information necessary to assess derecruitability.
The use of the PV curve to evaluate lung injury has been investigated in a number of previous studies that often make reference to “inflection points” along the PV relationship. It should be pointed out that this term is not always appropriate since the mathematical definition of an inflection is a point where curvature changes sign [32] (see Fig. 3). In fact, what is usually of interest are sudden changes in slope, as these can indicate significant changes in the nature of R/D as one proceeds along the inspiratory or expiratory portion of the PV relationship, respectively. In this study, we refer to these features as “corner points.” In any case, it has been suggested that PEEP should be set above the lower corner point on the inspiratory limb of the PV relationship (corresponding to CP1 in Fig. 3) in order to minimize derecruitment at the end of expiration [18], [33]–[37]. Indeed, this practice has been shown to reduce VILI severity [38], improve patient survival [11], decrease atelectrauma [39], [40], and promote alveolar stability and recruitment [18]. Likewise, the location of the upper corner point (corresponding to CP2 in Fig. 3) has been postulated to signal the onset of tissue over distention [41], [42] and thus demarcate a maximum volume for ventilation [11], [41], [42]. Nevertheless, the use of corner points is complicated by the fact that they may change in number as injury progresses (see Fig. 3). For example, in both mild and severe injury the shape of the inspiratory limb of the PV relationship is sigmoidal, per the analysis of Venegas et al. [32], so only two corner points exist. However, at intermediate levels of VILI we found that three corner points are present (see Fig. 3), making their use as time-continuous markers of injury problematic.
This third corner point is evident in PV measurements in Wistar rats with small airway obstruction due to Ficoll solution instillation or edema resulting from high-volume ventilation [22], suggesting that this phenomena is not confined to the unique physiology of the mouse lung. We postulate that the three corner point behavior shown in Fig. 3 (t = 136.6 min) occurs due to the same mechanism proposed by Martin-Lefèvre et al. Recruitment occurring a low volumes increases compliance to yield CP1, additional inflation distends the open regions of the lung to the point where the nonlinear tissue elastance causes a decrease in compliance at CP2, and further increases in pressure recruit additional lung units at CP3, causing an increase in the organ-level compliance. The predicted open fraction at t = 158.6 min for the Vt = 1.2 mL group (see Fig. 8) demonstrates this biphasic recruitment.
Fig. 4 shows that ΔH200μL and ΔH1 are correlated even though these parameters reflect events occurring over rather different timescales; ΔH1 reflects the amount of derecruitment that occurs during the 20 s elapsing between the end of high-Vt ventilation and the first measurements of H made during a derecruitability test, while ΔH200μL reflects derecruitment over a duration of less than 1 s. Fig. 5 shows that ΔH200μL is also highly correlated with DRate, the latter reflecting derecruitment events taking place over a timescale of minutes. These findings thus suggest that PV loops recorded during a single large breath contain information about lung derecruitability that is related to events taking place over the longer timescales relevant to a derecruitability test.
This is not to say, however, that the actual events giving rise to the different timescales of R/D are identical. The very rapid (subsecond) events reflected in ΔH200μL, such as the rapid collapse and reopening of alveoli observed via in vivo microscopy by Pavone et al. [43], likely result from derangements in surfactant function caused by plasma proteins as well as simple flooding by fluid that has leaked in from the vasculature. These events may also contribute to ΔH1. By contrast, we have previously modeled the much slower changes in DRate in terms of closure of small airways due to instability of the liquid layer that lines their walls [6]. Nevertheless, while different events may be responsible for the changes in ΔH200μL, ΔH1, and DRate, all the involved events are directly affected by lung injury so a concordance between the three indices of R/D is not unexpected. However, further experimentation is necessary to determine if these relationships may be extended to other models of lung injury.
In contrast to ΔH1 and DRate, we found that the increases in PMax during overventilation did not unambiguously relate to ΔH200μL (data not shown). This finding is in agreement with our previous study of VILI development in mice [24] which showed that PMax rose linearly with time at a rate that was independent of Vt the despite accelerating, Vt-dependent increases in both ΔH1 and DRate. This suggests that the mechanism culpable for increased derecruitability may not pertain to the increases in PMax, meaning that PMax is not appropriate for assessing derecruitability.
Our findings thus strongly implicate R/D as playing the dominant role in determining how ΔH1, DRate, and H200μL change as VILI develops. In order to quantify the amount of R/D inherent in our data, we developed a simple computational model of the lung featuring both recruitment and tissue distension as joint mechanisms by which V increases during a ventilated breath. To achieve an adequate fit of the model predictions to experimental measurements of P and V we found it necessary to make the elastic behavior of the model substantially nonlinear, such that elastance was constant at low ε but then transitioned to a curvilinear function of tissue strain at a critical distention εCrit (see (2) and Fig. 6). This functional form for lung elastance is similar to the volume dependence of H measured in BALB/c mice by other investigators [44]–[46]. These studies also found that H increased when V fell below a certain rather low level, which was interpreted as reflecting derecruitment of lung units [46]. This supports our decision to keep E constant in the computational model at low V, and to account for the inverse dependence of elastance on V by decreasing φ.
We also found that the elastance of the model fell as Vt increased (see Fig. 6 and Table III). This behavior stems from the divergence in the inspiratory limb of the PV loops shown in Fig. 7(a). This might seem counterintuitive, since one normally expects tissue stiffness to increase with strain. On the other hand, Soutiere and Mitzner [47] have shown that if the mouse lung is inflated with sufficient care, it can be safely taken to pressures in excess of 80 cmH2O. This surprising result still begs definitive explanation, but one possibility is that even fully recruited alveoli are able to accommodate increased volume by recruiting alveolar wall material that is normally gathered into folds [47]. Zosky et al. [44] also invoked this explanation for their observation that H decreased with V in a manner that persisted over timescales far exceeding the interbreath period in our experiments. Thus, unfolding of alveolar walls could also be responsible for our finding that εCrit increased with increasing Vt (see Table III and Fig. 6). This complicates the situation because we now have two distinct recruitment processes to deal with, namely opening of alveoli and unfolding of alveolar walls, and we cannot be sure of their relative contributions to changes in lung elastance. Based on the findings of Zosky et al. [44], we assume that the R/D taking place within a breath is due to opening and closing of alveoli, while the unfolding of alveolar walls occurs on a significantly longer timescale and so affects only the intrinsic stiffness of the alveolar tissue for the purposes of our model fitting. This justifies our use of a single recruitment mechanism in our computational model (see Fig. 1). Nevertheless, our model predictions of φ are somewhat uncertain due to the fact that the model predicts the lungs to be fully recruited at end-inspiration in the uninjured lung for the four different Vt investigated (see Fig. 7).
Our computational model is also limited by the fact that it does not distinguish between changes in lung elastance due to R/D of alveolar walls versus changes in intrinsic tissue stiffness caused by, for example, the derangements in surfactant function that can accompany lung injury. Nevertheless, these various effects are all expected to contribute to changes in overall lung elastance and its dependence on V. Furthermore, the component of the PV relationship attributable to the dependence of elastance on V is determined by fitting the model to the PV data (2). The remainder of the intrabreath PV relationship is then attributed to changes in φ. Based on these assumptions, Fig. 8 demonstrates that R/D occurred over a wide range of pressures, as has been suggested by a number of other investigators [10]–[19]. Fig. 8 also shows that increasing severity of lung injury is associated with a progressive increase in the pressures at which R/D occurs, as we have previously hypothesized [7], [24]. These changes in R/D pressures are rather substantial. For example, most recruitment during inspiration in the normal lung occurs below about 12 cmH2O, whereas in the severely injured lung the majority of recruitment is predicted to occur above about 20 cmH2O. Similarly, derecruitment in the healthy lung occurs below the upper corner point on the expiratory limb of the PV loop [10], [18] corresponding to pressures below about 10 cmH2O (see Fig. 7). As injury becomes severe, however, we predict that derecruitment occurs increasingly over the entire Vt range.
From the perspective of managing the injured lung, perhaps the most important prediction of our computational model is the distension that occurs in the fraction of the lung that remains open during a breath. As injury worsens and derecruitment increases, continuing to drive a fixed volume of air into the lungs can unduly stress the open parenchymal tissues. Our model predicts essentially no important differences in overdistention at end-inspiration with the 4 Vt we investigated because the lung was presumed to be essentially fully open in all cases [see Fig. 7(b)]. However, the degree of overdistension during the course of inspiration increases considerably as VILI progresses (see Fig. 9). In particular, the model predicts in the Vt = 1.2 mL group that εCrit is achieved at V = 0.45 mL in the normal lung but drops to as low as V = 0.25 mL as the lung becomes injured. This means that an increasing fraction of inspiration is spent with the lung tissues distended into the nonlinear part of their PV relationship where stresses are high. This would be expected to exacerbate any injury that already exists. Of course, patients with injured lungs are never ventilated with large tidal volumes, but Fig. 9 shows that the degree of tissue overdistension increases dramatically with increasing injury when Vt is modest. Being able to determine, in a given patient, how close one is to εCrit could thus be useful in titrating Vt to a level that minimizes the chances of creating further VILI.
Finally, it must be pointed out that, while the mouse may provide a useful animal model of ARDS in many respects, its small size means it cannot recapitulate the topographical consequences of gravity in the human lung or larger animals [48], where substantial differences may exist in the degree of R/D taking place in dependent versus nondependent lung regions. This does not at all invalidate our theoretical modeling approach because the model in Fig. 1 makes no claim as to where R/D takes place, so the model applies equally well to any lung regardless of its size. However, it must be remembered that the details of R/D in the injured human lung may differ substantially from that taking place in the mouse lung.
In summary, we have shown that dynamic PV loops from mice with VILI contain features that are strongly correlated to parameters defining lung derecruitability, demonstrating links between events occurring on timescales from subseconds to minutes. Computational analysis of the PV measurements indicates that R/D occur over an increasingly wide range of applied pressures as lung injury worsens, leading to increased overdistention of the remaining open fraction of the lung. We suggest that this model might eventually prove useful in the monitoring of overdistension in patients with injured lungs and for helping with the choice of a minimally injurious Vt.
Acknowledgments
This work was supported by NIH under Grant P30 GM103532 and under Grant T32 HL076122.
Contributor Information
Bradford J. Smith, Email: bradford.smith@med.uvm.edu, Vermont Lung Center, University of Vermont College of Medicine, Burlington, VT 05405 USA
Jason H. T. Bates, Email: jason.h.bates@uvm.edu, Vermont Lung Center, University of Vermont College of Medicine, Burlington, VT05405 USA.
References
- 1.Albert SP, DiRocco J, Allen GB, Bates JHT, Lafollette R, Kubiak BD, Fischer J, Maroney S, Nieman GF. The role of time and pressure on alveolar recruitment. J Appl Physiol. 2009;106:757–765. doi: 10.1152/japplphysiol.90735.2008. [DOI] [PMC free article] [PubMed] [Google Scholar]
- 2.Allen G, Bates JH. Dynamic mechanical consequences of deep inflation in mice depend on type and degree of lung injury. J Appl Physiol. 2004 Jan;96:293–300. doi: 10.1152/japplphysiol.00270.2003. [DOI] [PubMed] [Google Scholar]
- 3.Allen G, Lundblad LK, Parsons P, Bates JH. Transient mechanical benefits of a deep inflation in the injured mouse lung. J Appl Physiol. 2002 Nov;93:1709–15. doi: 10.1152/japplphysiol.00473.2002. [DOI] [PubMed] [Google Scholar]
- 4.Bates JHT, Irvin CG. Time dependence of recruitment and derecruitment in the lung: A theoretical model. J Appl Physiol. 2002;93:705–713. doi: 10.1152/japplphysiol.01274.2001. [DOI] [PubMed] [Google Scholar]
- 5.Ma B, Bates JHT. Modeling the complex dynamics of derecruitment in the lung. Ann Biomed Eng. 2010;38:3466–3477. doi: 10.1007/s10439-010-0095-2. [DOI] [PubMed] [Google Scholar]
- 6.Massa CB, Allen GB, Bates JHT. Modeling the dynamics of recruitment and derecruitment in mice with acute lung injury. J Appl Physiol. 2008;105:1813–1821. doi: 10.1152/japplphysiol.90806.2008. [DOI] [PMC free article] [PubMed] [Google Scholar]
- 7.Seah AS, Grant KA, Aliyeva M, Allen GB, Bates JHT. Quantifying the roles of tidal volume and PEEP in the pathogenesis of ventilator-induced lung injury. Ann Biomed Eng. 2011;39:1505–1516. doi: 10.1007/s10439-010-0237-6. [DOI] [PubMed] [Google Scholar]
- 8.Hantos Z, Daroczy B, Suki B, Nagy S, Fredberg JJ. Input impedance and peripheral inhomogeneity of dog lungs. J Appl Physiol. 1992;72:168–178. doi: 10.1152/jappl.1992.72.1.168. [DOI] [PubMed] [Google Scholar]
- 9.Allen GB, Leclair T, Cloutier M, Thompson-Figueroa J, Bates JH. The response to recruitment worsens with progression of lung injury and fibrin accumulation in a mouse model of acid aspiration. Amer J Physiol Lung Cellular Molecular Physiol. 2007 Jun;292:L1580–9. doi: 10.1152/ajplung.00483.2006. [DOI] [PubMed] [Google Scholar]
- 10.DiRocco JD, Carney DE, Nieman GF. Correlation between alveolar recruitment/derecruitment and inflection points on the pressure-volume curve. Intensive Care Med. 2007 Jul;33:1204–11. doi: 10.1007/s00134-007-0629-8. [DOI] [PubMed] [Google Scholar]
- 11.Amato MB, Barbas CS, Medeiros DM, Magaldi RB, Schettino GP, Lorenzi-Filho G, Kairalla RA, Deheinzelin D, Munoz C, Oliveira R, Takagaki TY, Carvalho CR. Effect of a protective-ventilation strategy on mortality in the acute respiratory distress syndrome. The New Engl J Med. 1998 Feb;338:347–54. doi: 10.1056/NEJM199802053380602. [DOI] [PubMed] [Google Scholar]
- 12.Hickling KG. Best compliance during a decremental, but not incremental, positive end-expiratory pressure trial is related to open-lung positive end-expiratory pressure: A mathematical model of acute respiratory distress syndrome lungs. Amer J Respir Crit Care Med. 2001;163:69–78. doi: 10.1164/ajrccm.163.1.9905084. [DOI] [PubMed] [Google Scholar]
- 13.Frazer DG, Lindsley WG, Rosenberry K, McKinney W, Goldsmith WT, Reynolds JS, Tomblyn S, Afshari A. Model predictions of the recruitment of lung units and the lung surface area-volume relationship during inflation. Ann Biomed Eng. 2004 May;32:756–63. doi: 10.1023/b:abme.0000030240.83381.63. [DOI] [PubMed] [Google Scholar]
- 14.Jonson B, Richard JC, Straus C, Mancebo J, Lemaire F, Brochard L. Pressure-volume curves and compliance in acute lung injury: Evidence of recruitment above the lower inflection point. Amer J Respir Crit Care Med. 1999 Apr;159:1172–8. doi: 10.1164/ajrccm.159.4.9801088. [DOI] [PubMed] [Google Scholar]
- 15.Schiller HJ, Steinberg J, Halter J, McCann U, DaSilva M, Gatto LA, Carney D, Nieman G. Alveolar inflation during generation of a quasi-static pressure/volume curve in the acutely injured lung. Crit Care Med. 2003 Apr;31:1126–33. doi: 10.1097/01.CCM.0000059997.90832.29. [DOI] [PubMed] [Google Scholar]
- 16.Pelosi P, Goldner M, McKibben A, Adams A, Eccher G, Caironi P, Losappio S, Gattinoni L, Marini JJ. Recruitment and derecruitment during acute respiratory failure: An experimental study. Amer J Respir Crit Care Med. 2001 Jul;164:122–30. doi: 10.1164/ajrccm.164.1.2007010. [DOI] [PubMed] [Google Scholar]
- 17.Crotti S, Mascheroni D, Caironi P, Pelosi P, Ronzoni G, Mondino M, Marini JJ, Gattinoni L. Recruitment and derecruitment during acute respiratory failure: A clinical study. Amer J Respir Crit Care Med. 2001 Jul;164:131–40. doi: 10.1164/ajrccm.164.1.2007011. [DOI] [PubMed] [Google Scholar]
- 18.Albaiceta GM, Taboada F, Parra D, Luyando LH, Calvo J, Menendez R, Otero J. Tomographic study of the inflection points of the pressure-volume curve in acute lung injury. Amer J Respir Crit Care Med. 2004 Nov;170:1066–72. doi: 10.1164/rccm.200312-1644OC. [DOI] [PubMed] [Google Scholar]
- 19.Hickling KG. The pressure-volume curve is greatly modified by recruitment. A mathematical model of ARDS lungs. Amer J Respir Crit Care Med. 1998;158:194–202. doi: 10.1164/ajrccm.158.1.9708049. [DOI] [PubMed] [Google Scholar]
- 20.Ranieri VM, Giuliani R, Fiore T, Dambrosio M, Milicemili J. Volume-pressure curve of the respiratory system predicts effects of PEEP in ARDS—occlusion versus constant flow technique. Amer J Respir Crit Care Med. 1994 Jan;149:19–27. doi: 10.1164/ajrccm.149.1.8111581. [DOI] [PubMed] [Google Scholar]
- 21.Cheng W, DeLong DS, Franz GN, Petsonk EL, Frazer DG. Contribution of opening and closing of lung units to lung hysteresis. Respir Physiol. 1995 Dec;102:205–15. doi: 10.1016/0034-5687(95)00055-0. [DOI] [PubMed] [Google Scholar]
- 22.Martin-Lefèvre L, Ricard JD, Roupie E, Dreyfuss D, Saumon G. Significance of the changes in the respiratory system pressure-volume curve during acute lung injury in rats. Amer J Respir Crit Care Med. 2001;164:627–632. doi: 10.1164/ajrccm.164.4.2008018. [DOI] [PubMed] [Google Scholar]
- 23.Rouby JJ, Lu Q, Vieira S. Pressure/volume curves and lung computed tomography in acute respiratory distress syndrome. Eur Respir J Suppl. 2003 Aug;42:27s–36s. doi: 10.1183/09031936.03.00420503. [DOI] [PubMed] [Google Scholar]
- 24.Smith BJ, Grant KA, Bates JH. Linking the development of ventilator-induced lung injury to mechanical function in the lung. Ann Biomed Eng. 2013;41:527–536. doi: 10.1007/s10439-012-0693-2. [DOI] [PMC free article] [PubMed] [Google Scholar]
- 25.Schuessler TF, Bates JH. A computer-controlled research ventilator for small animals: Design and evaluation. IEEE Trans Biomed Eng. 1995 Sep;42(9):860–6. doi: 10.1109/10.412653. [DOI] [PubMed] [Google Scholar]
- 26.Fredberg JJ, Stamenovic D. On the imperfect elasticity of lung tissue. J Appl Physiology. 1989 Dec;67:2408–19. doi: 10.1152/jappl.1989.67.6.2408. [DOI] [PubMed] [Google Scholar]
- 27.Rubenfeld GD, Caldwell E, Peabody E, Weaver J, Martin DP, Neff M, Stern EJ, Hudson LD. Incidence and outcomes of acute lung injury. New Engl J Med. 2005 Oct 20;353:1685–1693. doi: 10.1056/NEJMoa050333. [DOI] [PubMed] [Google Scholar]
- 28.Zambon M, Vincent JL. Mortality rates for patients with acute lung injury/ARDS have decreased over time. Chest. 2008 May;133:1120–1127. doi: 10.1378/chest.07-2134. [DOI] [PubMed] [Google Scholar]
- 29.International consensus conferences in intensive care medicine: Ventilator-associated lung injury in ARDS. This official conference report was cosponsored by the American thoracic society, the European society of intensive care medicine, and the societe de reanimation de langue francaise, and was approved by the ATS board of directors, Jul. 1999. Amer J Respir Crit Care Med. 1999 Dec;160:2118–24. doi: 10.1164/ajrccm.160.6.ats16060. [DOI] [PubMed] [Google Scholar]
- 30.Ranieri VM, Suter PM, Tortorella C, De Tullio R, Dayer JM, Brienza A, Bruno F, Slutsky AS. Effect of mechanical ventilation on inflammatory mediators in patients with acute respiratory distress syndrome: a randomized controlled trial. J Amer Med Assoc. 1999 Jul;282:54–61. doi: 10.1001/jama.282.1.54. [DOI] [PubMed] [Google Scholar]
- 31.Acute Respiratory Distress Syndrome Network. Ventilation with lower tidal volumes compared with traditional tidal volumes for acute lung injury, and the acute respiratory distress syndrome. The Acute Respiratory Distress Syndrome Network. N Engl J Med. 2000;342:1301–1308. doi: 10.1056/NEJM200005043421801. [DOI] [PubMed] [Google Scholar]
- 32.Venegas JG, Harris RS, Simon BA. A comprehensive equation for the pulmonary pressure-volume curve. J Appl Physiol. 1998 Jan;84:389–95. doi: 10.1152/jappl.1998.84.1.389. [DOI] [PubMed] [Google Scholar]
- 33.Suter PM, Fairley B, Isenberg MD. Optimum end-expiratory airway pressure in patients with acute pulmonary failure. N Engl J Med. 1975;292:284–289. doi: 10.1056/NEJM197502062920604. [DOI] [PubMed] [Google Scholar]
- 34.Matamis D, Lemaire F, Harf A, Brun-Buisson C, Ansquer JC, Atlan G. Total respiratory pressure-volume curves in the adult respiratory distress syndrome. Chest. 1984;86:58–66. doi: 10.1378/chest.86.1.58. [DOI] [PubMed] [Google Scholar]
- 35.Falke KJ, Pontoppidan H, Kumar A, Leith DE, Geffin B, Laver MB. Ventilation with end-expiratory pressure in acute lung disease. J Clin Invest. 1972 Sep;51:2315–23. doi: 10.1172/JCI107042. [DOI] [PMC free article] [PubMed] [Google Scholar]
- 36.Medoff BD, Harris RS, Kesselman H, Venegas J, Amato MBP, Hess D. Use of recruitment maneuvers and high positive end-expiratory pressure in a patient with acute respiratory distress syndrome. Crit Care Med. 2000 Apr;28:1210–1216. doi: 10.1097/00003246-200004000-00051. [DOI] [PubMed] [Google Scholar]
- 37.Gattinoni L, Carlesso E, Valenza F, Chiumello D, Caspani ML. Acute respiratory distress syndrome, the critical care paradigm: What we learned and what we forgot. Curr Opin Crit Care. 2004 Aug;10:272–8. doi: 10.1097/01.ccx.0000135511.75998.22. [DOI] [PubMed] [Google Scholar]
- 38.Dreyfuss D, Soler P, Basset G, Saumon G. High inflation pressure pulmonary edema. Respective effects of high airway pressure, high tidal volume, and positive end-expiratory pressure. Amer Rev Respir Disease. 1988 May;137:1159–64. doi: 10.1164/ajrccm/137.5.1159. [DOI] [PubMed] [Google Scholar]
- 39.Argiras EP, Blakeley CR, Dunnill MS, Otremski S, Sykes MK. High PEEP decreases hyalinemembrane formation in surfactant deficient lungs. Brit J Anaesthesia. 1987 Oct;59:1278–85. doi: 10.1093/bja/59.10.1278. [DOI] [PubMed] [Google Scholar]
- 40.Muscedere JG, Mullen JBM, Gan K, Slutsky AS. Tidal ventilation at low airway pressures can augment lung injury. Amer J Respir Crit Care Med. 1994 May;149:1327–1334. doi: 10.1164/ajrccm.149.5.8173774. [DOI] [PubMed] [Google Scholar]
- 41.Roupie E, Dambrosio M, Servillo G, Mentec H, el Atrous S, Beydon L, Brun-Buisson C, Lemaire F, Brochard L. Titration of tidal volume and induced hypercapnia in acute respiratory distress syndrome. Amer J Respir Crit Care Med. 1995 Jul;152:121–8. doi: 10.1164/ajrccm.152.1.7599810. [DOI] [PubMed] [Google Scholar]
- 42.Dambrosio M, Roupie E, Mollet JJ, Anglade MC, Vasile N, Lemaire F, Brochard L. Effects of positive end-expiratory pressure and different tidal volumes on alveolar recruitment and hyperinflation. Anesthesiology. 1997 Sep;87:495–503. doi: 10.1097/00000542-199709000-00007. [DOI] [PubMed] [Google Scholar]
- 43.Pavone L, Albert S, DiRocco J, Gatto L, Nieman G. Alveolar instability caused by mechanical ventilation initially damages the nondependent normal lung. Crit Care. 2007;11:R104. doi: 10.1186/cc6122. [DOI] [PMC free article] [PubMed] [Google Scholar]
- 44.Zosky GR, Janosi TZ, Adamicza A, Bozanich EM, Cannizzaro V, Larcombe AN, Turner DJ, Sly PD, Hantos Z. The bimodal quasi-static and dynamic elastance of the murine lung. J Appl Physiol. 2008 Aug;105:685–692. doi: 10.1152/japplphysiol.90328.2008. [DOI] [PubMed] [Google Scholar]
- 45.Sly PD, Collins RA, Thamrin C, Turner DJ, Hantos Z. Volume dependence of airway and tissue impedances in mice. J Appl Physiol. 2003 Apr;94:1460–6. doi: 10.1152/japplphysiol.00596.2002. [DOI] [PubMed] [Google Scholar]
- 46.Hantos Z, Collins RA, Turner DJ, Janosi TZ, Sly PD. Tracking of airway and tissue mechanics during TLC maneuvers in mice. J Appl Physiol. 2003 Oct;95:1695–705. doi: 10.1152/japplphysiol.00104.2003. [DOI] [PubMed] [Google Scholar]
- 47.Soutiere SE, Mitzner W. On defining total lung capacity in the mouse. J Appl Physiol. 2004 May;96:1658–64. doi: 10.1152/japplphysiol.01098.2003. [DOI] [PubMed] [Google Scholar]
- 48.Tucci MR, Costa EL, Wellman TJ, Musch G, Winkler T, Harris RS, Venegas JG, Amato MB, Vidal Melo MF. Regional lung derecruitment and inflammation during 16 hours of mechanical ventilation in supine healthy sheep. Anesthesiology. 2013 Mar; doi: 10.1097/ALN.0b013e31829083b8. [DOI] [PMC free article] [PubMed] [Google Scholar]