

Abstract
Objective
Reduced testosterone, a recognized comorbidity of reduced insulin sensitivity (IS) and type 2 diabetes (T2D), has also been reported in adult males with type 1 diabetes (T1D). However, there are limited data on how early reduced testosterone occurs, and whether it is related to the reduced IS in T1D. Leptin, a modulator of the HPG-axis, may also influence testosterone in T1D. We hypothesized that IS and leptin would be associated with total testosterone (TT), and free androgen index (FAI) in adolescent males with T1D.
Methods
T1D (n=35), T2D (n=13), lean (n=13) and obese (n=9) adolescent males had IS measured by hyperinsulinemic-euglycemic clamps (glucose infusion rate [GIR]), in addition to leptin, SHBG, TT, and FAI. The cohort was stratified into those with T1D (n=35) and those without (n=35).
Results
TT and SHBG were lower in T2D boys vs. lean controls, and GIR and leptin correlated with FAI and TT in non-T1D participants. However, despite being insulin resistant, adolescent males with T1D had normal TT and FAI, unrelated to GIR. In T1D, leptin was inversely associated with TT (p=0.005) and FAI (p=0.01), independent of puberty, HbA1c, diabetes duration, BMI z-score and GIR.
Conclusion
Leptin accounted for a significant proportion of the variability of testosterone in T1D. However, despite reduced IS, there was no association between IS and testosterone in T1D adolescents. These observations suggest that the mechanisms affecting testosterone may differ between adolescent males with and without T1D.
Keywords: Type 1 diabetes, insulin sensitivity, leptin, testosterone, puberty
Introduction
Reduced testosterone is associated with reduced insulin sensitivity (IS) and type 2 diabetes (T2D) in adult males (1-3). We have also previously reported a relationship between IS and total testosterone (TT) in young males with obesity and T2D (3). In type 1 diabetes (T1D), female puberty and reproduction have received considerable attention, but there are limited data regarding testosterone concentrations and pubertal development in young males. In adult studies, men with T1D are reported to have similar TT, higher sex hormone binding globulin (SHBG) and slightly lower free testosterone compared with controls, suggesting relative hypogonadism (4). In addition, using data from the Diabetes-Patienten-Verlaufsdaten (DPV) study, Rohrer et al recently demonstrated a delay in the mean age of onset of genital development and pubarche in boys with T1D (5).
Multiple hypotheses have been proposed to explain the mechanisms underlying gonadal dysfunction in T2D. These hypotheses primarily focus on a potential role for reduced IS. For example, knockout mice lacking the neuronal insulin receptor experience central hypogonadism (6). Reduced IS has also been proposed to cause hypogonadism via its relationship with leptin, an adipocyte-derived hormone and recognized modulator of hypothalamic-pituitary gonadal axis (7).
Adult and adolescent males with T1D are reported to have lower IS, independent of obesity-status, than normal controls (8-12). Moreover, puberty is characterized by endocrine changes associated with deterioration in metabolic control and worsening IS (13, 14). However, it is unknown whether this reduced IS affects testosterone in T1D. Leptin was shown to be negatively associated with testosterone concentrations in a study of adult males with T1D, and the relationship appears to be influenced by adiposity, but the investigators did not have data on insulin sensitivity (15).
Accordingly, the aim of this study was to evaluate whether young males with T1D, who are known to have reduced IS, have similarly decreased testosterone to their insulin-resistant obese counterparts. The second goal was to examine the relationships among IS, as measured by hyperinsulinemic euglycemic clamp studies, leptin, and testosterone. Our hypothesis was that young males with T1D would have decreased testosterone concentrations when compared with lean counterparts but similar to obese boys, and that testosterone would be related to both leptin concentration and IS.
Methods
i. Subjects
A total of 70 pubertal males between the ages of 12 and 19 years were recruited for a study of obesity and insulin resistance in youth, and had IS assessed by hyperinsulinemic-euglycemic clamp, in addition to leptin, TT, and SHBG. Of the 70 males, 35 had T1D, 13 had T2D, 9 were obese (BMI≥95th percentile) without diabetes, and 13 were normal weight controls (BMI≥5th percentile and <85th percentile). By design, obese and T2D participants had similar BMI. The cohort was also stratified into those with T1D (n=35) and all others (n=35) for comparison and analyses. The study was approved by the University of Colorado Denver (UCD) Institutional Review Board, and appropriate consent and assent were obtained.
Height and weight were measured for determination of BMI. BMI z-score was calculated using BMI, sex, and age. Absence of diabetes was confirmed in the nondiabetic groups by a 2-hour, 75-gram oral glucose tolerance test. T1D was defined by American Diabetes Association (ADA) criteria plus the presence of glutamic acid decarboxylase, islet cell, or insulin autoantibodies, as well as insulin requirement. Similarly, T2D was defined by ADA criteria and the absence of glutamic acid decarboxylase, islet cell or insulin autoantibodies, insulin requirement, or secondary causes of diabetes. Participants with T2D were managed with metformin ± insulin; metformin was discontinued 24 hours prior to the overnight inpatient admission and blood glucose was controlled with IV insulin on the night prior to the euglycemic clamp. Pubertal development was assessed by a single pediatric endocrinologist by testicular volume estimation using a Prader orchidometer, and categorized as early (4-6 mL), mid (6-12 mL) and late (>12 mL) for analyses.
ii. Laboratory measures
IS was calculated from a 3-hour hyperinsulinemic euglycemic clamp (80mU*m-2*min-1 insulin) following 3 days of limited physical activity and a 3-day fixed-macronutrient, weight-maintenance diet, using the GIR (16) as in our previous studies (17). SHBG, dehydroepiandrosterone sulfate (DHEA-S), estradiol and TT were measured on a morning fasting sample, drawn prior to the insulin clamp, by chemiluminescence using the Beckman-Coulter Immunoassay Access System. Vermeulen's FAI (100*testosterone / SHBG) was used to estimate free testosterone in participants who had data available on SHBG (n=37) (18). Leptin was measured on a morning fasting sample, drawn prior to the insulin clamp, with the leptin radioimmunoassay Kit from Milipore. Serum glucose was measured using a Cobas Mira Plus Chemistry Analyzer with intra- and inter-assay CV of 0.66 –1.24% and 3.9 – 4.6%, respectively. Serum insulin was measured by competitive radioimmunoassay (Diagnostic Systems Laboratories, Inc; DSL-1600) with intra- and inter-assay CV of 5.2 and 9.8%, respectively.
iii. Statistical analysis
Variables were checked for the distributional assumption of normality using normal plots and the Shapiro-Wilk's test. Since the distribution of leptin was skewed, a natural log transformation was applied. ANOVA with a Tukey-Kramer p-value adjustment was used for comparison of continuous variables across the 4 groups; T1D, T2D, obese and lean. Chi-Square Test of Independence or Fisher's Exact was used to test categorical variables. Univariate and multivariable linear regressions were employed to test for associations of HbA1c, diabetes duration, BMI Z-score, GIR and lnleptin with TT and FAI within T1D participants and within the combined non-T1D group, all adjusted for puberty. P < 0.05 was considered significant. Data presented are LSM ± SE unless otherwise stated. All analyses were performed using SAS 9.3 (Cary, NC).
Results
Descriptive characteristics
Group characteristics are shown in Table 1. Allgroups were similar for age and the majority of participants were in mid or late puberty. The obese and T2D groups were similar for BMI, whereas the T1D group was similar to the lean boys. These lean males with T1D had similar IS to obese males without diabetes despite no differences in steady-state insulin values (Figure 1A). Biochemical characteristics adjusted for pubertal status are shown in Table 2. TT and SHBG were significantly lower in males with T2D than lean males, whereas these measurements were intermediate in the obese males without diabetes (Figure 1B). Participants with T1D had similar TT, SHBG, and FAI to lean males (Figure 1C). Leptin was similar in lean males with and without T1D, but significantly higher in obese males with and without T2D (Figure 1D).
Table 1. Group Characteristics.
| Variable | Obese (N = 9) |
T1D (N = 35) |
T2D (N = 13) |
Lean (N = 13) |
P-value |
|---|---|---|---|---|---|
| Age (years) | 14.2 ± 2.3 | 15.3 ± 1.9 | 14.8 ± 2.0 | 14.6 ± 2.1 | 0.42 |
| Hispanic (n/%) | 5 (55.6%) | 3 (8.6%) | 8 (61.5%) | 2 (15.4%) | 0.001 |
| NHW (n/%) | 3 (33.3%) | 28 (80%) | 4 (30.8%) | 10 (76.9%) | -- |
| Other (n/%) | 1 (11.1%) | 4 (11.4%) | 1 (7.7%) | 1 (7.7%) | -- |
| Early puberty (n/%) | 1 (11%) | 2 (6%) | 1 (8%) | 4 (31%) | 0.18 |
| Mid puberty (n/%) | 5 (56%) | 18 (53%) | 4 (31%) | 7 (54%) | |
| Late puberty (n/%) | 3 (33%) | 14 (41%) | 8 (61%) | 2 (15%) | |
| Height (cm) | 171.3 ± 9.0 | 171.4 ± 9.2 | 171.1 ± 10.5 | 166.6 ± 13.4 | 0.52 |
| Weight (kg) | 95.1 ± 33.6** | 66.6 ± 17.1 | 102.6 ± 25.0** | 53.7 ± 13.6 | < 0.0001 |
| BMI z-score | 2.1 ± 0.5** | 0.46 ± 1.0 | 2.3 ± 0.4** | -0.31 ± 0.73 | < 0.0001 |
| Waist to Hip | 0.92 ± 0.07 | 0.91 ± 0.08 | 1.02 ± 0.06** | 0.86 ± 0.07 | < 0.0001 |
| Waist Circumference (cm) | 102.3 ± 15.3** | 79.7 ± 12.2 | 111.9 ± 14.8** | 70.6 ± 7.2 | < 0.0001 |
| Steady state insulin | 125 ± 55 | 134 ± 72 | 158 ± 62 | 135 ± 69 | 0.74 |
| Glucose Infusion Rate (GIR) (mg/kg/min) | 14.0 ± 6.4a | 11.2 ± 3.4a | 7.1 ± 3.2 | 20.3 ± 5.0ab | < 0.0001 |
P < 0.01 Compared to T1D and T2D.
P < 0.01 Compared to T1D and Lean.
P < 0.01 Compared to T2D
P < 0.01 for all pair-wise comparisons.
Figures 1A-D.


A. Insulin sensitivity among T1D, T2D, obese and lean participants
* Mean values are represented by hollow diamonds, and median by the horizontal lines in the boxes. The heights of the boxes represent the 25th to 75th ranges. The upper and lower fences represent the maximum and minimum values respectively.
B. Total testosterone concentrations among T1D, T2D, obese and lean participants
* Mean values are represented by hollow diamonds, and median by the horizontal lines in the boxes. The heights of the boxes represent the 25th to 75th ranges. The upper and lower fences represent the maximum and minimum values respectively.
C. Free androgen index concentrations among T1D, T2D, obese and lean participants
* Mean values are represented by hollow diamonds, and median by the horizontal lines in the boxes. The heights of the boxes represent the 25th to 75th ranges. The upper and lower fences represent the maximum and minimum values respectively.
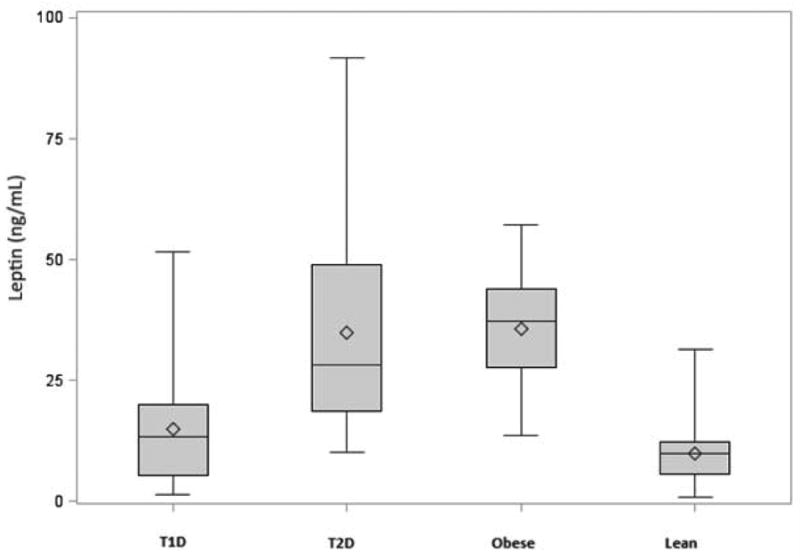
D. Leptin concentrations among T1D, T2D, obese and lean participants
* Mean values are represented by hollow diamonds, and median by the horizontal lines in the boxes. The heights of the boxes represent the 25th to 75th ranges. The upper and lower fences represent the maximum and minimum values respectively.
Table 2. Biochemical profiles adjusted for pubertal status.
| Variable | Obese (N = 9) |
T1D (N = 35) |
T2D (N = 13) |
Lean (N = 13) |
ANOVA P-value |
|---|---|---|---|---|---|
| TT (ng/dL) | 199.8 ± 57.5 | 350.9 ± 33.7a | 131.8 ± 49.9 | 381.5 ± 47.0 a | 0.0003 |
| FAI (ng/dL) | 30.7 ± 11.3 a | 40.2 ± 6.5 a | 88.2 ± 13.1 | 25.9 ± 96 a | 0.0005 |
| DHEAS (μg/dL) | 197.7 ± 25.1 | 118.5 ± 14.7* | 142.2 ± 21.8 | 143.7 ± 21.2 | 0.0437 |
| SHBG (nmol/L) | 33.7 ± 10.6c | 50.4 ± 6.1 | 22.7 ± 12.3c | 72.9 ± 9.0 | 0.0092 |
| Estradiol | 24.2 ± 3.9 | 18.8 ± 1.9 | 25.4 ± 3.1 | 25.2 ± 3.5 | 0.20 |
| Leptin (ng/mL) | 33.5 ± 3.2** | 11.1 ± 1.9 | 25.0 ± 2.8** | 4.1 ± 2.8 | < 0.0001 |
| GIR (mg/kg/min) | 14.2 ± 1.6 ac | 11.5 ± 0.9ac | 7.4 ± 1.3 c | 19.8 ± 1.5 | < 0.0001 |
Data are presented as least square mean ± SE.
P < 0.05 compared to T2D.
P < 0.05 versus Obese.
P < 0.05 compared to Lean.
P < 0.01 Compared to T1D and Lean.
Associations among testosterone, leptin, and IS
After adjusting for puberty, the natural log of leptin (lnleptin) was negatively associated with TT in T1D males (p = 0.008); together lnleptin and pubertal stage accounted for 33% of the variability of TT (Table 3). Lnleptin was not significantly associated with FAI, adjusted for pubertal stage (p = 0.91, Table 3). In a multivariable model including pubertal stage, HbA1c, diabetes duration, BMI Z-score, GIR and lnleptin, lnleptin was inversely associated with both TT (β±SE: -133.6±43.4, p = 0.005) and FAI (β±SE: -14.1±5.1, p=0.01) in participants with T1D. No significant relationships were found between GIR and FAI (p=0.06), or GIR and TT (p=0.35) in multivariable analyses in participants with T1D.
Table 3. Puberty Adjusted Associations with FAI and TT.
| Variable | T1D | |
|---|---|---|
| β ± SE | P-Value | |
| TT | ||
| HbA1c | 0.77 ± 26 | 0.98 |
| Duration | 0.76 ± 0.63 | 0.24 |
| BMI Z-Score | -25 ± 33 | 0.46 |
| Ln leptin | -98 ± 35 | 0.008a |
| GIR | -4.9 ± 11 | 0.66 |
| SHBG | -0.7 ± 1.5 | 0.64 |
| FAI | ||
| HbA1c | -4.2 ± 3 | 0.23 |
| Duration | -0.12 ± 0.09 | 0.19 |
| BMI Z-Score | 12.2 ± 4 | 0.005 |
| Ln leptin | -0.61 ± 5 | 0.91 |
| GIR | -2.8 ± 1.5 | 0.07 |
| SHBG | -0.8 ± 0.1 | < 0.0001 |
R2 = 20% (32% with pubertal status)
Discussion
T1D and gonadal function
In adolescent boys with T1D, FAI and TT concentrations were not different from lean controls when adjusting for pubertal stage. Historically, patients with inadequately controlled T1D displayed a high prevalence of pubertal delay. However, recent studies evaluating gonadal function in T1D males have shown conflicting results. Chandel et al. found FAI and TT concentrations in young males (26.5±0.9 years) with T1D to be significantly higher than those in patients (27.9±1.0 years) with T2D, and comparable with those observed in non-diabetic control subjects (19). In contrast, Van Dam et al demonstrated lower FAI in the presence of normal TT but higher SHBG concentrations in adult men with fairly well controlled T1D (4). Our data suggest that adolescent males with reasonably well controlled T1D have similar testosterone, SHBG, and FAI to lean control males. We do not have data regarding pubertal onset in our group, but those with T1D were similar in age and pubertal status to lean controls.
Testosterone and insulin sensitivity in T1D
In recent times, considerable attention has been given to the association of gonadal dysfunction with reduced IS, T2D, and obesity (20). As expected from adult data, our obese adolescent males with and without T2D displayed lower TT and IS than lean males with and without T1D, and reduced IS correlated with TT in non-T1D males. Reduced IS also plays a larger role in T1D pathogenesis than previously recognized, and as we and others have shown is not simply explained by obesity or poor glycemic control (8, 9, 21). However, despite the fact that these lean T1D males in our cohort were similarly insulin resistant to the obese males, TT and FAI in T1D were not decreased and did not correlate with IS. As the lower TT is likely mediated by the effect of IS on SHBG in the non-T1D group (22, 23), it is interesting that this effect is not seen in adolescent males with T1D, who have similarly reduced IS to obese non-diabetic males. These observations may suggest different mechanisms affecting SHBG, FAI and TT in insulin resistant T1D males with T1D.
Testosterone and leptin in T1D
Leptin was inversely associated with both FAI and TT in males with T1D; however, despite the presence of higher leptin concentrations in the obese and T2D subjects, this association was not seen in the non-T1D group. Leptin is synthesized and released from adipose tissue. It conveys information about the body's energy stores to the brain, and regulates body fat by modulating food intake and energy metabolism (24). Leptin also plays an important role in the hypothalamic–pituitary–gonadal (HPG) axis and is particularly critical in regulating the onset of puberty (25-29). It remains unclear whether leptin is affected by T1D status, as increased (30-33), decreased (34), and unchanged (35) leptin concentrations have been reported in T1D. An inverse relationship between leptin and testosterone is however well documented in adult men without T1D (15). Moreover, leptin concentrations in males are lower than in females, and decline about the time TT increases during puberty (36, 37).
The direction and magnitude of the leptin–testosterone relationship appear to be indirectly dependent on adiposity, as leptin concentrations are known to parallel adiposity (38, 39). Small increases in leptin increase GnRH release, whereas higher concentrations are associated with a decrease in GnRH (40, 41). Furthermore, elevated leptin and leptin resistance are recognized as characteristic of obesity and T2D (42-44). As expected, in our study, obese and T2D males had significantly higher leptin concentrations than our normal weight T1D group, but the association between leptin and TT was lost in the non-T1D -group, possibly secondary to leptin resistance in the obese and T2D subsets. Furthermore, based on testosterone concentrations, the T1D males do not show evidence of hypogonadism.
Strengths and limitations
Measurement of leptin in relation to testosterone and IS in young males with and without T1D, have to our knowledge never previously been reported, which is a strength of our study. A second strength is the direct measurement of IS by hyperinsulinemic-euglycemic clamp, accepted as the gold standard method. Limitations to the present study include the cross-sectional design and the size of the cohort. Due to the cross-sectional design, causality cannot be determined, i.e. whether leptin and IS directly influence FAI and TT, or vice versa. However, recent research in adults strongly suggests that abnormally elevated leptin reduces testosterone production at multiple levels of the HPG axis (45). Ideally, testosterone would have been measured by tandem mass spectrometry. However, this measurement was not widely available at study initiation. Furthermore, this is a secondary analysis and testosterone was not a primary outcome of the original study. Because the non-T1D comparison group contains lean and obese boys with and without T2D, it is much more heterogeneous than the T1D group. The non-T1D group is also more heterogeneous in terms of ethnicity. However, these differences are unavoidable given the demographic in Colorado.
Conclusion
Normal-weight young males with T1D in our study did not have reduced TT, and we report an independent and inverse relationship between leptin and TT in these T1D males. In contrast to our previous findings in obese insulin resistant males with and without T2D, where IS was significantly associated with TT (3), there was no significant association between IS and TT in normal-weight males with T1D, despite decreased IS in this group. Taken together, these data suggest that the mechanisms influencing testosterone may differ in T1D vs. T2D/obese, and also adds further evidence to the hypothesis that the phenotypes of insulin resistance in T1D and T2D/obese may differ. Further research and in particular longitudinal studies are required to better understand the roles of leptin and IS in puberty and gonadal function in young males with T1D and how that might differ in obese T1D.
Acknowledgments
Support for this study was provided by NIH BIRCWH K12 5K12HD057022-04, ADA 7-11-CD-08, JDRF Award #11-2010-343, R56 DK088971, ADA 1-11-JF-23 and NIH/NCATS Colorado CTSI UL1 TR000154.
Drs. Nadeau, McFann, Kelsey and Bjornstad are guarantors of this work and, as such, had full access to all the data in the study and take responsibility for the integrity of the data and the accuracy of the data analysis
Abbreviations
- T1D
type 1 diabetes
- T2D
type 2 diabetes
- IS
insulin sensitivity
- GIR
glucose infusion rate
- TT
total testosterone
- FAI
free androgen index
- SHBG
sex hormone binding globulin
- BMI
body mass index
- HPG
hypothalamic-pituitary-gonadal axis
Footnotes
Author Contributions: PB researched, wrote, contributed to discussion, and reviewed/edited the manuscript; MMK researched, wrote, contributed to discussion, and reviewed/edited the manuscript; KM formulated the analytic plan, performed analyses and contributed to the discussion, reviewed/edited the manuscript; KN researched, wrote, contributed to the discussion, and reviewed/edited the manuscript.
Duality of interest: Drs. Bjornstad, Kelsey, McFann and Nadeau have no conflict of interest to disclose.
References
- 1.Dhindsa S, Prabhakar S, Sethi M, Bandyopadhyay A, Chaudhuri A, Dandona P. Frequent occurrence of hypogonadotropic hypogonadism in type 2 diabetes. The Journal of clinical endocrinology and metabolism. 2004;89(11):5462–8. doi: 10.1210/jc.2004-0804. Epub 2004/11/09. [DOI] [PubMed] [Google Scholar]
- 2.Kapoor D, Aldred H, Clark S, Channer KS, Jones TH. Clinical and biochemical assessment of hypogonadism in men with type 2 diabetes: correlations with bioavailable testosterone and visceral adiposity. Diabetes Care. 2007;30(4):911–7. doi: 10.2337/dc06-1426. Epub 2007/03/30. [DOI] [PubMed] [Google Scholar]
- 3.Moriarty-Kelsey M, Harwood JE, Travers SH, Zeitler PS, Nadeau KJ. Testosterone, obesity and insulin resistance in young males: evidence for an association between gonadal dysfunction and insulin resistance during puberty. Journal of pediatric endocrinology & metabolism : JPEM. 2010;23(12):1281–7. doi: 10.1515/jpem.2010.202. Epub 2011/07/01. [DOI] [PMC free article] [PubMed] [Google Scholar]
- 4.van Dam EW, Dekker JM, Lentjes EG, Romijn FP, Smulders YM, Post WJ, et al. Steroids in adult men with type 1 diabetes: a tendency to hypogonadism. Diabetes Care. 2003;26(6):1812–8. doi: 10.2337/diacare.26.6.1812. Epub 2003/05/27. [DOI] [PubMed] [Google Scholar]
- 5.Rohrer T, Stierkorb E, Heger S, Karges B, Raile K, Schwab KO, et al. Delayed pubertal onset and development in German children and adolescents with type 1 diabetes: cross-sectional analysis of recent data from the DPV diabetes documentation and quality management system. European journal of endocrinology / European Federation of Endocrine Societies. 2007;157(5):647–53. doi: 10.1530/EJE-07-0150. Epub 2007/11/07. [DOI] [PubMed] [Google Scholar]
- 6.Burcelin R, Thorens B, Glauser M, Gaillard RC, Pralong FP. Gonadotropin-releasing hormone secretion from hypothalamic neurons: stimulation by insulin and potentiation by leptin. Endocrinology. 2003;144(10):4484–91. doi: 10.1210/en.2003-0457. Epub 2003/09/10. [DOI] [PubMed] [Google Scholar]
- 7.Schoeller EL, Schon S, Moley KH. The effects of type 1 diabetes on the hypothalamic, pituitary and testes axis. Cell and tissue research. 2012;349(3):839–47. doi: 10.1007/s00441-012-1387-7. Epub 2012/04/25. [DOI] [PMC free article] [PubMed] [Google Scholar]
- 8.Nadeau KJ, Regensteiner JG, Bauer TA, Brown MS, Dorosz JL, Hull A, et al. Insulin resistance in adolescents with type 1 diabetes and its relationship to cardiovascular function. The Journal of clinical endocrinology and metabolism. 2010;95(2):513–21. doi: 10.1210/jc.2009-1756. Epub 2009/11/17. [DOI] [PMC free article] [PubMed] [Google Scholar]
- 9.Schauer IE, Snell-Bergeon JK, Bergman BC, Maahs DM, Kretowski A, Eckel RH, et al. Insulin resistance, defective insulin-mediated fatty acid suppression, and coronary artery calcification in subjects with and without type 1 diabetes: The CACTI study. Diabetes. 2011;60(1):306–14. doi: 10.2337/db10-0328. Epub 2010/10/28. [DOI] [PMC free article] [PubMed] [Google Scholar]
- 10.Bjornstad P, Snell-Bergeon JK, McFann K, Wadwa RP, Rewers M, Rivard CJ, et al. Serum uric acid and insulin sensitivity in adolescents and adults with and without type 1 diabetes. Journal of diabetes and its complications. 2014;28(3):298–304. doi: 10.1016/j.jdiacomp.2013.12.007. Epub 2014/01/28. [DOI] [PMC free article] [PubMed] [Google Scholar]
- 11.Bjornstad P, Snell-Bergeon JK, Rewers M, Jalal D, Chonchol MB, Johnson RJ, et al. Early Diabetic Nephropathy: A complication of reduced insulin sensitivity in type 1 diabetes. Diabetes Care. 2013 doi: 10.2337/dc13-0631. Epub 2013/09/13. [DOI] [PMC free article] [PubMed] [Google Scholar]
- 12.Rocha A, Iniguez G, Godoy C, Gaete X, Lopez P, Loreti N, et al. Testicular function during adolescence in boys with type 1 diabetes mellitus (T1D): absence of hypogonadism and differences in endocrine profile at the beginning and end of puberty. Pediatric diabetes. 2014;15(3):198–205. doi: 10.1111/pedi.12078. Epub 2013/10/15. [DOI] [PubMed] [Google Scholar]
- 13.Cameron FJ, Amin R, de Beaufort C, Codner E, Acerini CL. Diabetes in adolescence. Pediatric diabetes. 2014;15(Suppl 20):245–56. doi: 10.1111/pedi.12169. Epub 2014/07/22. [DOI] [PubMed] [Google Scholar]
- 14.Cho YH, Craig ME, Donaghue KC. Puberty as an accelerator for diabetes complications. Pediatric diabetes. 2014;15(1):18–26. doi: 10.1111/pedi.12112. Epub 2014/01/22. [DOI] [PubMed] [Google Scholar]
- 15.Soderberg S, Olsson T, Eliasson M, Johnson O, Brismar K, Carlstrom K, et al. A strong association between biologically active testosterone and leptin in non-obese men and women is lost with increasing (central) adiposity. International journal of obesity and related metabolic disorders : journal of the International Association for the Study of Obesity. 2001;25(1):98–105. doi: 10.1038/sj.ijo.0801467. Epub 2001/03/13. [DOI] [PubMed] [Google Scholar]
- 16.DeFronzo RA, Tobin JD, Andres R. Glucose clamp technique: a method for quantifying insulin secretion and resistance. The American journal of physiology. 1979;237(3):E214–23. doi: 10.1152/ajpendo.1979.237.3.E214. Epub 1979/09/01. [DOI] [PubMed] [Google Scholar]
- 17.Nadeau KJ, Zeitler PS, Bauer TA, Brown MS, Dorosz JL, Draznin B, et al. Insulin Resistance in Adolescents with Type 2 Diabetes Is Associated with Impaired Exercise Capacity. Journal of Clinical Endocrinology & Metabolism. 2009;94(10):3687–95. doi: 10.1210/jc.2008-2844. [DOI] [PMC free article] [PubMed] [Google Scholar]
- 18.Vermeulen A, Verdonck L, Kaufman JM. A critical evaluation of simple methods for the estimation of free testosterone in serum. The Journal of clinical endocrinology and metabolism. 1999;84(10):3666–72. doi: 10.1210/jcem.84.10.6079. Epub 1999/10/16. [DOI] [PubMed] [Google Scholar]
- 19.Chandel A, Dhindsa S, Topiwala S, Chaudhuri A, Dandona P. Testosterone concentration in young patients with diabetes. Diabetes Care. 2008;31(10):2013–7. doi: 10.2337/dc08-0851. Epub 2008/07/25. [DOI] [PMC free article] [PubMed] [Google Scholar]
- 20.Dandona P, Dhindsa S. Update: Hypogonadotropic hypogonadism in type 2 diabetes and obesity. The Journal of clinical endocrinology and metabolism. 2011;96(9):2643–51. doi: 10.1210/jc.2010-2724. Epub 2011/09/08. [DOI] [PMC free article] [PubMed] [Google Scholar]
- 21.Brown RJ, Yanovski JA. Estimation of insulin sensitivity in children: methods, measures and controversies. Pediatric diabetes. 2014;15(3):151–61. doi: 10.1111/pedi.12146. Epub 2014/04/24. [DOI] [PMC free article] [PubMed] [Google Scholar]
- 22.Bhasin S, Jasjua GK, Pencina M, D'Agostino R, Sr, Coviello AD, Vasan RS, et al. Sex hormone-binding globulin, but not testosterone, is associated prospectively and independently with incident metabolic syndrome in men: the framingham heart study. Diabetes Care. 2011;34(11):2464–70. doi: 10.2337/dc11-0888. Epub 2011/09/20. [DOI] [PMC free article] [PubMed] [Google Scholar]
- 23.Brand JS, van der Tweel I, Grobbee DE, Emmelot-Vonk MH, van der Schouw YT. Testosterone, sex hormone-binding globulin and the metabolic syndrome: a systematic review and meta-analysis of observational studies. International journal of epidemiology. 2011;40(1):189–207. doi: 10.1093/ije/dyq158. Epub 2010/09/28. [DOI] [PubMed] [Google Scholar]
- 24.Mantzoros CS, Magkos F, Brinkoetter M, Sienkiewicz E, Dardeno TA, Kim SY, et al. Leptin in human physiology and pathophysiology. American journal of physiology Endocrinology and metabolism. 2011;301(4):E567–84. doi: 10.1152/ajpendo.00315.2011. Epub 2011/07/28. [DOI] [PMC free article] [PubMed] [Google Scholar]
- 25.Watanobe H. Leptin directly acts within the hypothalamus to stimulate gonadotropin-releasing hormone secretion in vivo in rats. The Journal of physiology. 2002;545(Pt 1):255–68. doi: 10.1113/jphysiol.2002.023895. Epub 2002/11/16. [DOI] [PMC free article] [PubMed] [Google Scholar]
- 26.Smith JT, Acohido BV, Clifton DK, Steiner RA. KiSS-1 neurones are direct targets for leptin in the ob/ob mouse. Journal of neuroendocrinology. 2006;18(4):298–303. doi: 10.1111/j.1365-2826.2006.01417.x. Epub 2006/03/01. [DOI] [PubMed] [Google Scholar]
- 27.Zamorano PL, Mahesh VB, De Sevilla LM, Chorich LP, Bhat GK, Brann DW. Expression and localization of the leptin receptor in endocrine and neuroendocrine tissues of the rat. Neuroendocrinology. 1997;65(3):223–8. doi: 10.1159/000127276. Epub 1997/03/01. [DOI] [PubMed] [Google Scholar]
- 28.Caprio M, Isidori AM, Carta AR, Moretti C, Dufau ML, Fabbri A. Expression of functional leptin receptors in rodent Leydig cells. Endocrinology. 1999;140(11):4939–47. doi: 10.1210/endo.140.11.7088. Epub 1999/10/28. [DOI] [PubMed] [Google Scholar]
- 29.Garcia-Mayor RV, Andrade MA, Rios M, Lage M, Dieguez C, Casanueva FF. Serum leptin levels in normal children: relationship to age, gender, body mass index, pituitary-gonadal hormones, and pubertal stage. The Journal of clinical endocrinology and metabolism. 1997;82(9):2849–55. doi: 10.1210/jcem.82.9.4235. Epub 1997/09/01. [DOI] [PubMed] [Google Scholar]
- 30.Soliman AT, Omar M, Assem HM, Nasr IS, Rizk MM, El Matary W, et al. Serum leptin concentrations in children with type 1 diabetes mellitus: relationship to body mass index, insulin dose, and glycemic control. Metabolism: clinical and experimental. 2002;51(3):292–6. doi: 10.1053/meta.2002.30502. Epub 2002/03/12. [DOI] [PubMed] [Google Scholar]
- 31.Morales A, Wasserfall C, Brusko T, Carter C, Schatz D, Silverstein J, et al. Adiponectin and leptin concentrations may aid in discriminating disease forms in children and adolescents with type 1 and type 2 diabetes. Diabetes Care. 2004;27(8):2010–4. doi: 10.2337/diacare.27.8.2010. Epub 2004/07/28. [DOI] [PubMed] [Google Scholar]
- 32.McCormick KL, Mick GJ, Butterfield L, Ross H, Parton E, Totka J. Leptin in children with newly diagnosed type 1 diabetes: effect of insulin therapy. International journal of experimental diabetes research. 2001;2(2):121–7. doi: 10.1155/EDR.2001.121. Epub 2002/10/09. [DOI] [PMC free article] [PubMed] [Google Scholar]
- 33.Luna R, Garcia-Mayor RV, Lage M, Andrade MA, Barreiro J, Pombo M, et al. High serum leptin levels in children with type 1 diabetes mellitus: contribution of age, BMI, pubertal development and metabolic status. Clinical endocrinology. 1999;51(5):603–10. doi: 10.1046/j.1365-2265.1999.00848.x. Epub 1999/12/14. [DOI] [PubMed] [Google Scholar]
- 34.Hanaki K, Becker DJ, Arslanian SA. Leptin before and after insulin therapy in children with new-onset type 1 diabetes. The Journal of clinical endocrinology and metabolism. 1999;84(5):1524–6. doi: 10.1210/jcem.84.5.5653. Epub 1999/05/14. [DOI] [PubMed] [Google Scholar]
- 35.Myers SE, Albert SG, Haas MJ, Clifton D, Mooradian AD. Pubertal changes in serum leptin levels in adolescents with type 1 diabetes mellitus: a controlled longitudinal study. Journal of pediatric endocrinology & metabolism : JPEM. 2004;17(12):1653–62. doi: 10.1515/jpem.2004.17.12.1653. Epub 2005/01/14. [DOI] [PubMed] [Google Scholar]
- 36.Azar ST, Zalloua PA, Zantout MS, Shahine CH, Salti I. Leptin levels in patients with type 1 diabetes receiving intensive insulin therapy compared with those in patients receiving conventional insulin therapy. Journal of endocrinological investigation. 2002;25(8):724–6. doi: 10.1007/BF03345107. Epub 2002/09/21. [DOI] [PubMed] [Google Scholar]
- 37.Azar ST, Salti I, Zantout MS, Shahine CH, Zalloua PA. Higher serum leptin level in women than in men with type 1 diabetes. The American journal of the medical sciences. 2002;323(4):206–9. doi: 10.1097/00000441-200204000-00007. Epub 2002/05/11. [DOI] [PubMed] [Google Scholar]
- 38.Shimizu H, Shimomura Y, Hayashi R, Ohtani K, Sato N, Futawatari T, et al. Serum leptin concentration is associated with total body fat mass, but not abdominal fat distribution. International journal of obesity and related metabolic disorders : journal of the International Association for the Study of Obesity. 1997;21(7):536–41. doi: 10.1038/sj.ijo.0800437. Epub 1997/07/01. [DOI] [PubMed] [Google Scholar]
- 39.McGregor GP, Desaga JF, Ehlenz K, Fischer A, Heese F, Hegele A, et al. Radiommunological measurement of leptin in plasma of obese and diabetic human subjects. Endocrinology. 1996;137(4):1501–4. doi: 10.1210/endo.137.4.8625930. Epub 1996/04/01. [DOI] [PubMed] [Google Scholar]
- 40.Yu WH, Kimura M, Walczewska A, Karanth S, McCann SM. Role of leptin in hypothalamic-pituitary function. Proceedings of the National Academy of Sciences of the United States of America. 1997;94(3):1023–8. doi: 10.1073/pnas.94.3.1023. Epub 1997/02/04. [DOI] [PMC free article] [PubMed] [Google Scholar]
- 41.Yu WH, Walczewska A, Karanth S, McCann SM. Nitric oxide mediates leptin-induced luteinizing hormone-releasing hormone (LHRH) and LHRH and leptin-induced LH release from the pituitary gland. Endocrinology. 1997;138(11):5055–8. doi: 10.1210/endo.138.11.5649. Epub 1997/11/05. [DOI] [PubMed] [Google Scholar]
- 42.Shimizu H, Oh IS, Okada S, Mori M. Leptin resistance and obesity. Endocrine journal. 2007;54(1):17–26. doi: 10.1507/endocrj.kr-85. Epub 2006/10/21. [DOI] [PubMed] [Google Scholar]
- 43.Chen H, Charlat O, Tartaglia LA, Woolf EA, Weng X, Ellis SJ, et al. Evidence that the diabetes gene encodes the leptin receptor: identification of a mutation in the leptin receptor gene in db/db mice. Cell. 1996;84(3):491–5. doi: 10.1016/s0092-8674(00)81294-5. Epub 1996/02/09. [DOI] [PubMed] [Google Scholar]
- 44.Myers MG, Jr, Leibel RL, Seeley RJ, Schwartz MW. Obesity and leptin resistance: distinguishing cause from effect. Trends in endocrinology and metabolism: TEM. 2010;21(11):643–51. doi: 10.1016/j.tem.2010.08.002. Epub 2010/09/18. [DOI] [PMC free article] [PubMed] [Google Scholar]
- 45.George JT, Millar RP, Anderson RA. Hypothesis: kisspeptin mediates male hypogonadism in obesity and type 2 diabetes. Neuroendocrinology. 2010;91(4):302–7. doi: 10.1159/000299767. Epub 2010/07/16. [DOI] [PubMed] [Google Scholar]