Abstract
Background
Selecting the most efficient vaccination schedule is an important issue.
Objective
To assess the beneficial and harmful effects of accelerated hepatitis B vaccination schedules in high-risk healthy adults.
Methods
We searched controlled trial registers of The Cochrane Library as well as MEDLINE, EMBASE, VIP Database for Chinese Technical Periodicals, and the Chinese National Knowledge Infrastructure databases for randomized controlled trials published up to December 2013 that compared accelerated hepatitis B vaccine schedules to the standard schedule in adults. The results were presented as relative risk with 95% confidence intervals. Fixed or random effect models were used for analysis.
Results
We identified 10 randomized trials, all with one or more methodological weaknesses. Compared to the standard schedule, most accelerated schedules resulted in higher proportions of healthy vaccines more rapidly reaching anti-hepatitis B antibody levels >10 IU/L (P<0.05) initially and maintaining similar seroprotection rates after 6 months (P>0.05). Although accelerated schedules produced anti-hepatitis B levels higher than the standard schedule for the first month after the initial vaccine dose, they were significantly lower than the standard schedule after 6 months, except for an accelerated schedule that called for a fourth booster injection 12 months after the initial dose. Subjects administered accelerated vaccine schedules had similar compliance rate as those administered the standard schedule over the first 6 months of vaccination (relative risk = 1.00, 95% confidence interval: 0.84–1.21).
Conclusion
For rapid seroconversion and almost immediate short-term protection, accelerated vaccination schedules could be useful for at-risk groups. However, additional studies on the long-term protection and effectiveness of the primary doses of accelerated schedules are necessary.
Introduction
Hepatitis B is a globally distributed acute and chronic communicable disease associated with cancers and major hepatic diseases. Chronic hepatitis B virus (HBV) infections can lead to hepatocellular carcinoma (HCC), cirrhosis, and death [1]. Although hepatitis B vaccination offers high safety, cost-effectiveness and has resulted in a significant worldwide decline in hepatitis B incidence in children and adolescents, the vaccine has not been sufficiently utilized in adults, especially high-risk groups, leaving them susceptible to HBV-related complications [2, 3].
Worldwide, the standard hepatitis B vaccination schedule for adults consists of three doses administered on a 0–1–6 month schedule, which typically results in at least 85% seroprotection in target groups [4]. Unfortunately, despite longstanding recommendations, it remains difficult to reach at-risk groups due to some factors including lack of self-protection cognition and limited healthcare programs targeting certain high-risk groups such as injection drug users and prisoners. Furthermore, even when they can be reached, those who engage in high-risk behaviors often fail to comply with the required hepatitis B vaccination regimen.
The need for accelerated hepatitis B vaccination schedules for specific at-risk groups is well recognized. An accelerated vaccination schedule in a small group of healthy individuals has been shown to rapidly induce protective antibody titers [5], and accelerated post-exposure prophylaxis alone without hepatitis B immune globulin (HBIG) has been suggested to offer equally effective protection [6]. However, one major concern with accelerated vaccination schedules is whether the protection persists similarly to standard vaccination schedules. Moreover, various short schedules, such as 0–1–2 months [7–14], 0–1–2–6 months [15, 16], 0–1–2–12 months [15, 17–22], 0–1–12 months [20, 23], 0–1–4 months [24, 25], 0–14–42 days [26], 0–7–21 days [27–31], 0–7–28–56 days [4], and 0–7–21–360 days [32], administered to medical students, health-care workers, prisoners, drug users, dialysis patients, and patients with HIV complicate determination of the optimal choice of an accelerated schedule.
Several schedules [24, 32, 33] have been investigated to enhance compliance or more quickly induce protective antibody levels without reducing the hepatitis B vaccination immunogenicity. Herck et al. [32] found that accelerated (0–1–2–12 months) or super-accelerated schedules (0–7–21–360 days) resulted in higher proportions of vaccines reaching anti-hepatitis B antibody (anti-HM) levels >10 IU/L more rapidly. A fourth dose at month 12 is still required due to lack of the long-term protection data of these accelerated schedules. However, completing the schedule with a fourth dose is more difficult to ensure the compliance of hard-to-reach populations than completing a standard 0–1–6 month schedule.
When hepatitis B immunization programs targeting at-risk groups are implemented or evaluated, selecting the most efficient vaccination schedule is an important issue. It is beyond doubt that any adaptations should aim to optimize immunization program compliance while maintaining the vaccine’s immunogenicity and efficacy. Since people in these at-risk populations most often continue to be at risk, long-term protection against hepatitis B is important. This paper reviews available RCT evidence on accelerated hepatitis B vaccination schedules vs. the standard schedule for high-risk groups to assess beneficial and harmful effects.
Material and Methods
Search strategy
We searched MEDLINE, EMBASE, The Cochrane Library, Chinese National Knowledge Infrastructure (CNKI), and the VIP Database for Chinese Technical Periodicals databases without language restrictions for relevant randomized controlled trials (RCTs) published between January 1980 and December 2013. The search terms included (“vaccine” or “vaccination”) and (“hepatitis B” or “HBV” or “hepatitis B virus”) and “schedule”. The bibliographies of the original studies, reviews, and relevant conference abstracts were manually searched.
Inclusion and exclusion criteria
We included studies with randomized controlled trials (RCTs) in their design or epidemiologic methods. High-risk healthy subjects more than 15 years of age without previous hepatitis B infections and negative for serum hepatitis B markers, including hepatitis B surface antigen (HBsAg), anti-HBs, or hepatitis B core antibody (HBcAb), were included. High risk adult meant those who were in contact with blood or blood products, blood contaminated instruments, stained body fluids, or tissues, including medical students, health-care workers, prisoners, drug users, etc. Only comparisons of accelerated schedules (≥3 doses) to the standard schedule (0–1–6 months) were assessed. Antibody levels or protective rates between the groups were compared at the same elapsed time after the initial dose.
We excluded quasi-randomized trials and observational studies. Only the most recent or detailed study was chosen for repeated published studies.
Data extraction and outcome definitions
Two researchers (HJ and ZT) independently selected relevant studies and made post-hoc assessments of methodological quality using The Cochrane Library study quality evaluation tool [34]. We extracted the following characteristics from each RCT: primary author, publication year, number of randomized subjects, methodological quality, intervention regimens, doses and vaccine types, routes of vaccine injection, vaccination schedules, mean age, proportion of males, duration of follow-up, outcome measures, and number and type of adverse events in both intervention and control groups.
The primary outcome measures were hepatitis B protective events at follow-up. A hepatitis B protective event was defined as two or more consecutive patient blood specimens positive for anti-HB levels above 10 IU/L, a level considered protective against HBV infection, several months after initial vaccine dose or at maximum follow-up. Secondary outcome measures were: (1) Anti-HB antibody levels, either expressed as geometric mean titers (GMT) or mean titers; (2) Compliance rates defined as the proportion of participants in each group who completed the full vaccination course according to each protocol; and (3) Any localized or systemic adverse events.
Quality assessment
Study quality was evaluated using standards recommended by the Cochrane Handbook for Systematic Reviews of Interventions version 5.1.0, including random sequence generation, allocation concealment, blinding, incomplete outcome data, selective reporting, and other biases. The risk of bias was considered high when high bias existed in any domain, low if all key domains (all domains except random sequence generation and allocation concealment) were low bias, and unclear in all other cases. Two authors, HJ and ZT, assessed bias risks independently; disagreements were resolved with the help of a third author (PL). The Preferred Reporting Items for Systematic Reviews (PRISMA) checklist is shown in S1 Data.
Statistical analysis
Analyses for binary outcomes included all patients, irrespective of compliance or follow-up (intention-to-treat, ITT). Per-protocol (PP) analysis was also considered for seroprotection rates. Estimated pooled relative risk (RR) and 95% confidence interval (95% CI) were determined using the Mantel–Haenszel fixed effects model. We used a random-effects inverse variance model when we detected substantial statistical heterogeneity. For anti-HB level analysis, we log transformed data for all included studies and performed a meta-analysis on the log-scale mean differences. We tested heterogeneity using the chi-square test and I2. I2 scores of 25%, 50%, and 75%, indicated low, moderate, and high degrees of heterogeneity, respectively. P values <0.10 in the chi-square test indicated heterogeneity between studies.
We planned the following subgroup analyses: (1) Methodological quality. We planned to divide trials into high quality (i.e., trials with low risk of bias) and low quality (i.e., trials with higher risk of bias); (2) Hepatitis B events in relation to follow-up duration; (3) Different types of accelerated schedules. We tested for differences between estimates of intervention effects with best interactions. Funnel plots were used to check for publication bias. For all tests, 95% CIs in RR not including “1” or 95% CIs in mean difference not including “0” indicated statistical significance. We used RevMan 5.0 (Copenhagen: Nordic Cochrane Centre, The Cochrane Collaboration, 2011) for statistical analysis.
Results
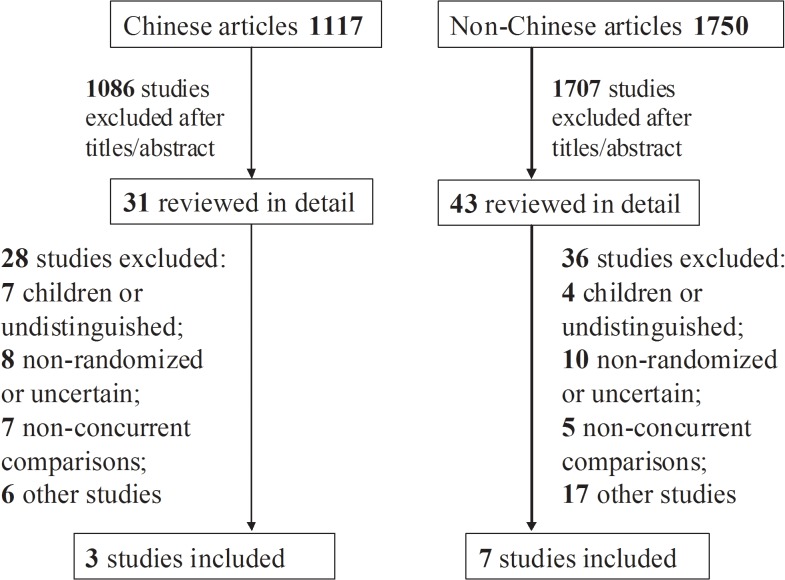
A total of 2,867 titles and abstracts were screened and 74 full articles retrieved (Fig 1). The retrieved articles included three trials in Chinese [29–31], six in English [4, 13, 18, 19, 22, 26], and one in Italian [21]. Excluded studies and the reasons for their exclusion are listed in S2 Data. The characteristics of the studies included in our analyses are shown in Tables 1 and 2. Most study subjects were healthy medical students [22, 26, 29] and healthy adults [13, 18, 19, 21, 22, 30, 31], and only one study included male prisoners [4].
Fig 1. Flow chart of included studies.
Table 1. Overview of studies according to vaccination schedule in different at-risk populations.
| Ref. | Vaccine | Subjects | Age (male/female) | Schedule | Group | Sample size | Adverse events |
|---|---|---|---|---|---|---|---|
| Yuan2004[31] | RV | Military men a | 15–20 y (100/0) | 0–7–21 days | T | 50 | Unclear |
| 10 ug/dose | 0–1–6 months | C | 50 | ||||
| Chen2006[29] | RV | Medical students a | 15–21 y | 0–7–21 days | T | 100 | Fever and injection |
| 10 ug/dose | (65/135) | 0–1–6 months | C | 100 | site pain | ||
| Yuan2006[30] | RV | Military men a | 18–50 y (300/0) | 0–7–21 days | T | 150 | Fever and injection |
| 10 ug/dose | 0–1–6 months | C | 150 | site pain | |||
| Wahl1988[26] | RV | Non-pregnant medical students a | 18–40 y (0/53) | 0–14–42 days | T | 27 | Unclear |
| 10 ug/dose | 0–1–6 months | C | 26 | ||||
| Ricciardi1990[21] | RV | Health care workers | NR (35/80) | 0–1–2–12 months | T | 50 | Unclear |
| 20 ug/dose | 0–1–6 months | C | 65 | ||||
| Hess1992[22] | RV | Medical students | 18–73 y | 0–1–2–12 months | T | 143 | Headache, diarrhea |
| 20 ug/dose | and workers a | (118/166) | 0–1–6 months | C | 141 | and mild fever. | |
| Gizaris1993[19] | RV | Healthy adults | 17–22 y | 0–1–2–12 months | T | 100 | local pain, headache, |
| 20 ug/dose | (100/100) | 0–1–6 months | C | 100 | mild fever | ||
| Winter1994[18] | RV | Healthy adults | NR (35/80) | 0–1–2–12 months | T | 59 | Unclear |
| 20 ug/dose | 0–1–6 months | C | 56 | ||||
| Marsano1996[13] | RV | Healthy adults a | 19–62 y | 0–1–2 months | T | 113 | Unclear |
| 20 ug/dose | (83/147) | 0–1–6 months | C | 117 | |||
| Asli2011[4] | RV | Male Prisoners a | Mean age 34 y | 0–7–28–56 days | T | 85 | Unclear |
| 20 ug/dose | (169/0) | 0–1–6 months | C | 84 |
T = accelerated schedule, C = standard schedule.
aAll HBsAg, HBsAb, and HBcAb tests were negative. RV = recombinant vaccine; NR = not reported.
Table 2. Overview of hepatitis B vaccine uptake according to vaccination schedule in different at-risk populations.
| Ref. | Group | Sample | HBsAb positive rate after the initial dose | anti-HB antibody levels after initial dose (1:) (95%CI or median) | ||||||||
|---|---|---|---|---|---|---|---|---|---|---|---|---|
| size | 1st | 3rd | 7th | 12th | others | 1st | 3rd | 7th | 12th | others | ||
| Yuan2004[31] | T | 50 | 32/50 | 38/50 | 46/50 | 44/50 | NR | 108.6 | 104.3 | 56.2 | 68.3 | NR |
| C | 50 | 13/50 | 37/50 | 47/50 | 45/49 | NR | 59.4 | 74.5 | 107.6 | 84.2 | NR | |
| Chen2006[29] | T | 100 | 63/99 | NR | 87/97 | NR | 70/96 a | 97(69–125) | NR | 107(77–137) | NR | 37(26–47) a |
| C | 100 | 27/100 | NR | 91/98 | NR | 75/95 a | 15(11–19) | NR | 213(152–273) | NR | 89(63–114) a | |
| Yuan2006[30] | T | 150 | 91/148 | NR | NR | 113/146 | 86/139 b | 63(53–72) | NR | NR | 74(62–85) | 25(21–29) b |
| C | 150 | 34/149 | NR | NR | 117/145 | 94/141 b | 12(10–14) | NR | NR | 115(98–132) | 67(56–77) b | |
| Wahl1988[26] | T | 27 | 13/27 | 23/27 | 27/27 | NR | NR | NR | NR | 83 | NR | NR |
| C | 26 | 1/26 | 11/26 | 25/25 | NR | NR | NR | NR | 430 | NR | NR | |
| Ricciardi1990[21] | T | 50 | NR | NR | 42/50 | NR | NR | NR | NR | 383 | NR | NR |
| C | 65 | NR | NR | 63/65 | NR | NR | NR | NR | 704 | NR | NR | |
| Hess1992[22] | T | 143 | 44/138 | 102/125 | 112/125 | 103/121 | NR | 11.6 | 160 | 173 | 5608 | NR |
| C | 141 | 25/137 | 86/123 | 108/113 | 111/119 | NR | 8.3 | 40.0 | 2877 | 442 | NR | |
| Gizaris1993[19] | T | 100 | 34/94 | NR | NR | 93/94 | NR | 2.2 | NR | NR | 16269.7 | NR |
| C | 100 | 33/98 | NR | NR | 97/98 | NR | 2.1 | NR | NR | 1188.0 | NR | |
| Winter1994[18] | T | 59 | NR | 47/54 | 47/53 | 52/54 | NR | NR | NR | NR | NR | NR |
| C | 56 | NR | 39/56 | 52/55 | 42/50 | NR | NR | NR | NR | NR | NR | |
| Marsano1996[13] | T | 113 | 70/112 | 101/105 | 95/98 | NR | NR | NR | 132.7 | 346.7 | NR | NR |
| C | 117 | 60/114 | 82/112 | 106/107 | NR | NR | NR | 23.9 | 4263.8 | NR | NR | |
| Asli2011[4] | T | 85 | 19/85 | NR | 67/85 | NR | NR | 21.6(63) | NR | 141.24(110.15) | NR | NR |
| C | 84 | 4/84 | NR | 71/76 | NR | NR | 5.08(29.8) | NR | 194.3(91.73) | NR | NR | |
T = accelerated schedule, C = standard schedule.
aafter 22 months
bafter 36 months.
CI = confidence interval; NR = not reported.
Quality Assessment
Among included studies (S1 and S2 Figs), four applied a random table [4, 22, 26, 31], but the remainder did not report any details of random-sequence generation. Concealment of allocation was an undefined risk in the included studies because it was not reported. Six studies had low attrition bias [4, 13, 19, 21–22, 26], and the others were unclear. Reporting, performance, and detection biases were low.
Comparison of seroprotection rates
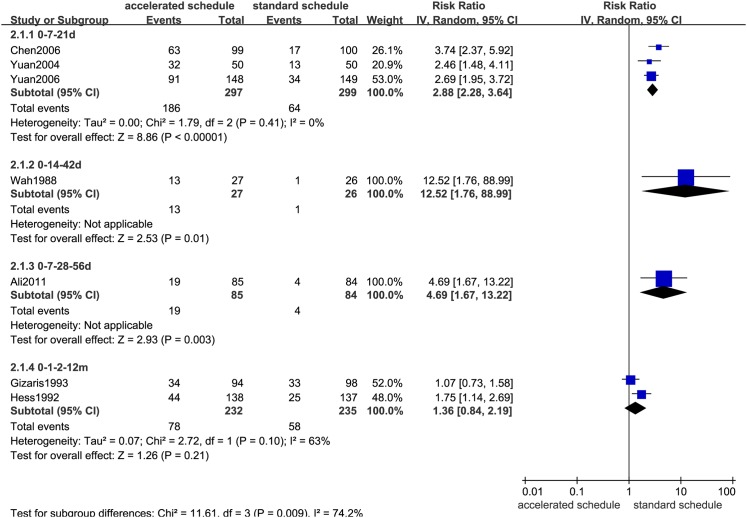
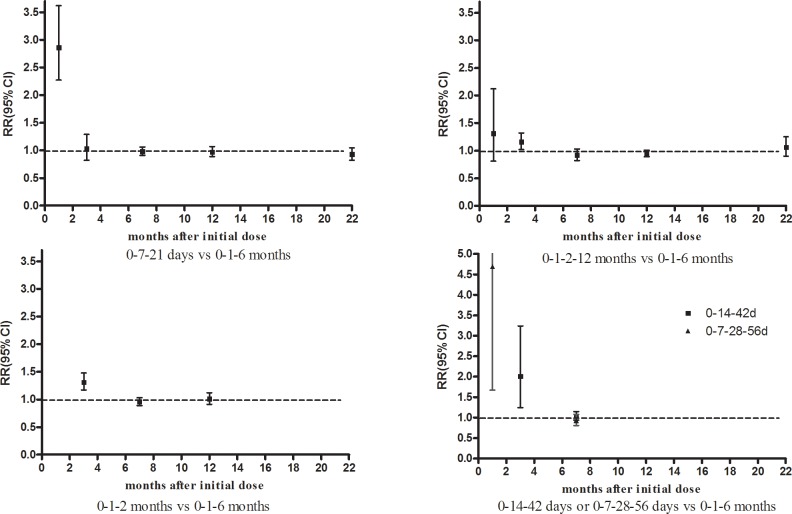
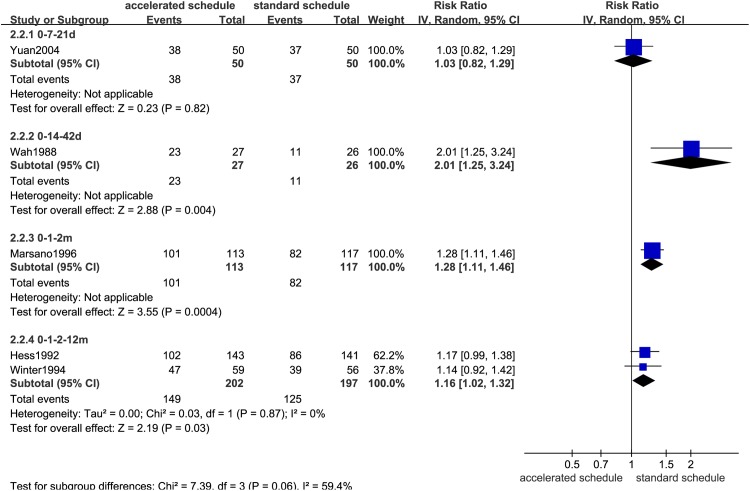
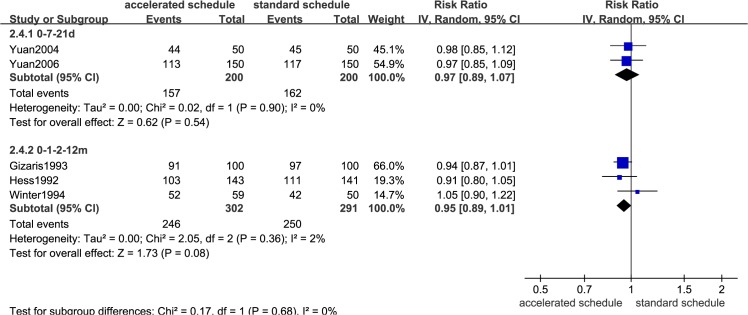
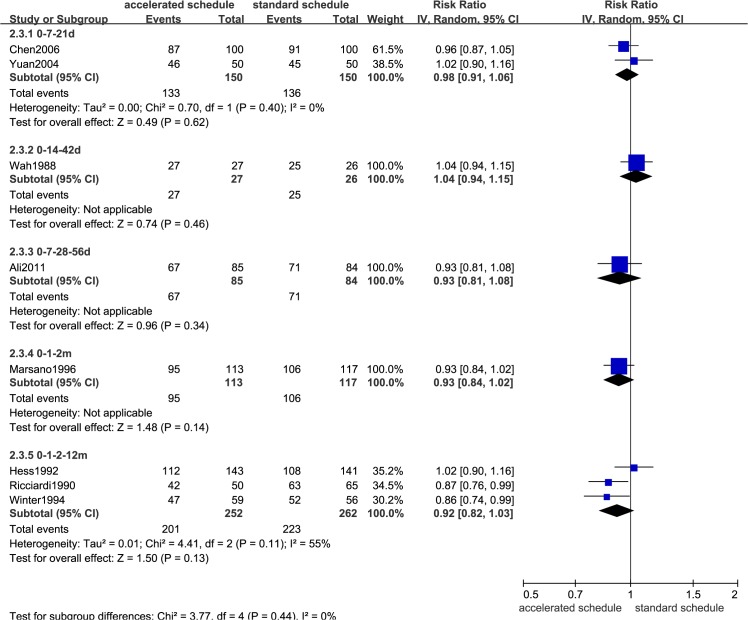
Dose timing and protective response to vaccine differed between subjects vaccinated according to accelerated (accelerated group) and standard schedules (standard group) (Figs 2–7, S3–S7 Figs, and Table 3). Due to the heterogeneity of many types of accelerated schedules, each type of accelerated group was independently analyzed in meta-analysis to evaluate meta-RR. Generally, higher seroprotection rates were detected in the accelerated group compared with the standard group at the first or third month after the initial dose, including accelerated schedules of 0–7–21 days, 0–7–28–56 days, 0–14–42 days, 0–1–2 months, and 0–1–2–12 months (Table 3), according to ITT analysis or PP analysis.
Fig 2. Forest plots showing protective rate comparisons between accelerated and standard schedules for intention-to-treat analysis at 1 month after initial dose.
Fig 7. Seroprotection rate changes for different vaccination schedules according to months after initial dose.
Table 3. Comparison of protective rates according to vaccination schedule in different at-risk populations.
| Accelerated | Ref. | Sample | RR (95%CI) (IV, Random) | |
|---|---|---|---|---|
| schedule | size (ITT/PP) | ITT | PP | |
| 1st month after initial dose | ||||
| 0–7–21 days | 3 | 600/596 | 2.86(2.27,3.62) | 2.88(2.28,3.64) |
| 0–14–42 days | 1 | 53/53 | 12.52(1.76,88.99) | 12.52(1.76,88.99) |
| 0–7–28–56 days | 1 | 169/169 | 4.69(1.67,13.22) | 4.69(1.67,13.22) |
| 0–1–2–12 months | 2 | 480/467 | 1.31(0.81,2.12) | 1.36(0.84,2.19) |
| 3rd month after initial dose | ||||
| 0–7–21 days | 1 | 100/100 | 1.03(0.82,1.29) | 1.03(0.82,1.29) |
| 0–14–42 days | 1 | 53/53 | 2.01(1.25,3.24) | 2.01(1.25,3.24) |
| 0–1–2 months | 1 | 230/217 | 1.28(1.11,1.46) | 1.31(1.17,1.48) |
| 0–1–2–12 months | 2 | 399/358 | 1.16(1.02,1.32) | 1.19(1.06,1.34) |
| 7th month after initial dose | ||||
| 0–7–21 days | 2 | 300/295 | 0.98(0.91,1.06) | 0.98(0.92,1.06) |
| 0–14–42 days | 1 | 53/52 | 1.04(0.94,1.15) | 1.00(0.93,1.08) |
| 0–7–28–56 days | 1 | 169/161 | 0.93(0.81,1.08) | 0.84(0.74,0.96) |
| 0–1–2 months | 1 | 230/205 | 0.93(0.84,1.02) | 0.98(0.94,1.02) |
| 0–1–2–12 months | 3 | 514/461 | 0.92(0.82,1.03) | 0.92(0.87,0.98) |
| 12th month after initial dose | ||||
| 0–7–21 days | 2 | 400/390 | 0.97(0.89,1.07) | 0.96(0.88,1.05) |
| 0–1–2–12 months | 3 | 593/525 | 0.95(0.89,1.01) a | 1.02(0.97,1.07) a |
| >22 months after initial dose | ||||
| 0–7–21 days | 2 | 500/471 | 0.92(0.82,1.05) | 0.93(0.82,1.04) |
a13 month for the trial group. RR = relative risk; CI = confidence interval; IV = inverse variance; ITT = intention-to-treat; PP = per-protocol. Bold fonts indicate statistical significance (P<0.05).
Fig 3. Forest plots showing protective rate comparisons between accelerated and standard schedules for intention-to-treat analysis at 3 month after initial dose.
Fig 5. Forest plots showing protective rate comparisons between accelerated and standard schedules for intention-to-treat analysis at 12 month after initial dose.
Fig 6. Forest plots showing protective rate comparisons between accelerated and standard schedules for intention-to-treat analysis at 22 month after initial dose.

However, there were no statistically significant differences in seroprotection rates between the accelerated and standard groups at ≥7 months after the initial dose, except that PP analysis (S5 and S7 Figs) showed that the 0–7–28–56 day (RR = 0.84, 95%CI: 0.74–0.96) and 0–1–2–12 month (RR = 0.92, 95%CI: 0.87–0.98) accelerated schedules had lower seroprotection rates than the standard group at 7 months after the initial dose.
Comparison of anti-HBs levels
Forest plots comparing anti-HB levels are not shown because very few studies could be included in the analysis. Table 4 and Fig 8 show changes in anti-HB levels in accelerated and standard groups at different time intervals after the initial dose. Anti-HB levels in the accelerated group with 0–7–21 day and 0–7–28–56 day schedules were higher than the standard group 1 month after the initial vaccine dose. However, at 7, 12, 24, and 36 months after the initial dose, anti-HB levels in the 0–7–21 day accelerated group were statistically lower than the standard group (Table 4).
Table 4. Comparison of anti-hepatitis B antibody levels according to vaccination schedule in different at-risk populations.
| Months after initial | Accelerated | Ref | Sample | Mean log10 (95%CI) difference b | |
|---|---|---|---|---|---|
| dose | schedule | size | M-H, Fixed model | IV, Random model | |
| 1st month | 0–7–21 days | 2 | 397 | 1.71(1.54,1.89) | 1.71(1.54,1.89) |
| 0–7–28–56 days | 1 | 169 | 1.44(0.30,2.58) | 1.44(0.30,2.58) | |
| 7th month | 0–7–21 days | 1 | 195 | -0.69(-1.05,-0.34) | -0.69(-1.05,-0.34) |
| 0–7–28–56 days a | 1 | 161 | -0.31(-1.71,1.07) | -0.31(-1.71,1.07) | |
| 12th month | 0–7–21 days | 1 | 291 | -0.44(-0.64,-0.24) | -0.44(-0.64,-0.24) |
| 24th month | 0–7–21 days | 1 | 191 | -0.88(-1.23,-0.53) | -0.88(-1.23,-0.53) |
| 36th month | 0–7–21 days | 1 | 280 | -0.98(-1.10,-0.86) | -0.98(-1.10,-0.86) |
a8 months for the trial group.
b per-protocol (PP) analysis. CI = confidence interval; MH = Mantel–Haenszel; IV = inverse variance. Bold fonts indicate statistical significance (P<0.05).
Fig 8. Log10 antibody titer changes for different vaccination schedules according to months after initial dose.

Fig 8 summarizes anti-HB levels from all included studies and shows that the standard group had higher log antibody titers than the accelerated 0–7–21 day schedule from the 7th to the 36th month after the initial dose. The accelerated 0–1–2–12 month schedule group had higher anti-HB levels than the standard group at 12 months after the initial vaccine dose.
Compliance comparison
Only two studies considered compliance rate as an endpoint [4, 22]. Asli et al. [4] found a significantly higher rate of compliance (100%) among male prisoners in the 0–7–28–56 day accelerated group compared to the standard group (90.5%) after a full course of vaccination. However, Hess et al. [22] showed a significantly lower compliance rate (90%) in the 0–1–2–12 month accelerated group than the standard group (99%); notably, the standard group compliance rate was remained higher than the accelerated group even at the third scheduled vaccination (91%).
Meta-analysis of the two studies demonstrated similar compliance rates between accelerated and standard groups when compliance of the 12th month vaccination was not considered (RR = 1.00, 95%CI: 0.84–1.21).
Sensitivity, subgroup, and funnel plot analyses
Due to the limited number of trials and the low methodological quality in each comparison group, we were unable to perform sensitivity and subgroup analyses or generate funnel plot as anticipated.
Safety analysis
The most common symptoms, such as mild fever, local pain, diarrhea, and other discomforts, were reported in the included studies, but serious adverse events were not described.
Discussion
This study used meta-analysis to investigate the beneficial and harmful effects of different hepatitis B vaccination schedules in adults. The main findings of our study are discussed below.
The accelerated schedule is generally appealing because it may increase participant compliance and provide earlier protection for people at high risk of hepatitis B infection [35]. However, it has not been widely used due to concerns that anti-HB seroconversion rates and protection duration may be inferior to the standard schedule [21, 35]. Similarly, our meta-analysis revealed that most accelerated schedules had higher seroprotection rates than the standard schedule the first month, including 0–7–21 day, 0–7–28–56 day, 0–14–42 day, 0–1–2 month, and 0–1–2–12 month schedules. However, there were no statistically significant seroprotection rate differences between individual accelerated schedules and the standard schedule after 6 months, except for PP analysis of 0–7–28–56 day and 0–1–2–12 month schedules (Table 3). These findings were similar to other study results [4, 7], suggesting that longer efficacy follow-ups of accelerated 0–7–21 day [29, 30] or 0–1–2 month [7] schedules could provide additional evidence for seroprotection rates similar to the standard schedule.
Our meta-analysis showed that mean HBsAg antibody titers were significantly higher in the standard group than in the accelerated group after the 6th month, nevertheless GMT values for both schedules were all well above the minimal protection threshold. Moreover, anti-HB titers in accelerated group increased and reached seroprotective levels more rapidly than the standard group [18, 19, 21, 22]. Although fourth booster dose for the 0–1–2 month schedule (Fig 4) has been recommended to decelerate rapidly declining antibody levels [18, 19, 21, 22], completing the schedule with an additional booster is more difficult to ensure the compliance of hard-to-reach populations than completing a standard 0–1–6 month schedule [22].
Fig 4. Forest plots showing protective rate comparisons between accelerated and standard schedules for intention-to-treat analysis at 7 month after initial dose.
The effectiveness and suitability of vaccination protocols should not be based entirely on seroprotection rates. Individual compliance to receive the full vaccine course should also be taken into account when evaluating protocol efficacy. In this analysis, only two studies considered compliance rates as endpoints [4, 22]. Meta-analysis of these studies demonstrated that, when compliance rates in the 12th month were not considered, the accelerated and standard groups had similar compliance rates (RR = 1.00, 95%CI: 0.84–1.21). In fact, the two studies had diametrically opposed conclusions. Asli et al. [4] found a significantly higher rate of compliance (100%) in the accelerated group schedule of 0–7–28–56 days compared to the standard schedule (90.5%) among male prison inmates who completed the full course of vaccination, while Hess et al. [22] showed that medical students and health-care workers had a significantly lower compliance rate (91%) in the accelerated group (0–1–2 months) compared to the standard group (99%). One possible explanation is that the study by Asli, et al. included male prisoners as subjects, while the study by Hess, et al. recruited healthy people [27, 28]. This finding suggests that higher compliance rates were closely related to short-term centralized management of risk groups rather than accelerated vaccination schedules.
This meta-analysis had several limitations, most significantly the number of included studies and the variety of shortened schedules. These limitations could have impacted heterogeneity and sensitivity analyses and restricted our interpretation of the results as evidence for future practice. Therefore, we were not able to perform sensitivity/subgroup and funnel plot analyses as planned. Some factors, such as male dominance (57.03%, 1026/1799) limit the generalizability of the results. Second, long-term effects were difficult to obtain using RCTs, especially for certain time points. Third, compliance rate calculations were based on the included RCT studies; the numerator depended on the number of study participants lost to follow-up as well as shedding cases and might be different from studies that include follow-ups of the natural population. Finally, insufficient information would bias results such as allocation concealment [10, 20], lab results [23], and compliance at some time points.
Conclusions
The standard vaccination program appears to be more efficient in terms of sustained antibody levels compared to accelerated schedules without booster doses. Rapid seroconversion and immediate protection in the short term can make it possible for high-risk groups to use accelerated schedules, but the long-term protection and effectiveness of the primary accelerated schedule doses should be recognized in the future.
Supporting Information
(DOC)
(DOC)
(TIF)
(TIF)
(TIF)
(TIF)
(TIF)
(TIF)
(TIF)
Data Availability
All relevant data are within the paper and its Supporting Information files.
Funding Statement
This work was supported in part by National Science and Technology Major Project of China (2009ZX10004-904), Social development fund of Jiangsu Province (7725000014), and Department of health of Jiangsu Province (Y2012070). The funders had no role in study design, data collection and analysis, decision to publish, or preparation of the manuscript.
References
- 1. Perz JF, Armstrong GL, Farrington LA, Hutin YJ, Bell BP. The contributions of hepatitis B virus and hepatitis C virus infections to cirrhosis and primary liver cancer worldwide. 2006. J Hepatol; 45(4):529–38. [DOI] [PubMed] [Google Scholar]
- 2. Rich JD, Ching CG, Lally MA, Gaitanis MM, Schwartzapfel B, Charuvastra A, et al. A review of the case for hepatitis B vaccination of high-risk adults. Am J Med. 2003; 114(4):316–8. [DOI] [PubMed] [Google Scholar]
- 3. Goldstein ST, Alter MJ, Williams IT, Moyer LA, Judson FN, Mottram K, et al. Incidence and risk factors for acute hepatitis B in the United States, 1982–1998: implications for vaccination programs. J Infect Dis. 2002; 185(6):713–9. [DOI] [PubMed] [Google Scholar]
- 4. Asli AA, Moghadami M, Zamiri N, Tolide-Ei HR, Heydari ST, Alavian SM, et al. Vaccination against hepatitis B among prisoners in Iran: accelerated vs. classic vaccination. Health Policy. 2011; 100(2–3):297–304. 10.1016/j.healthpol.2010.12.007 [DOI] [PubMed] [Google Scholar]
- 5. Wahl M, Hermodsson S, Iwarson S. Hepatitis B vaccination with short dose intervals—a possible alternative for post-exposure prophylaxis? Infection. 1988; 16(4):229–32. [DOI] [PubMed] [Google Scholar]
- 6. Iwarson S. Post-exposure prophylaxis for hepatitis B: active or passive? Lancet. 1989; 2(8655):146–8. [DOI] [PubMed] [Google Scholar]
- 7. Tran TQ, Grimes CZ, Lai D, Troisi CL, Hwang LY. Effect of age and frequency of injections on immune response to hepatitis B vaccination in drug users. Vaccine. 2012; 30(2):342–9. 10.1016/j.vaccine.2011.10.084 [DOI] [PMC free article] [PubMed] [Google Scholar]
- 8. Hwang LY, Grimes CZ, Tran TQ, Clark A, Xia R, Lai D, et al. Accelerated hepatitis B vaccination schedule among drug users: a randomized controlled trial. J Infect Dis. 2010; 202(10):1500–9. 10.1086/656776 [DOI] [PMC free article] [PubMed] [Google Scholar]
- 9. Giammanco G, De Grandi V, Pignato S, Dolci C, Congia M, Pisu C, et al. Yeast-derived hepatitis B vaccine in thalassaemic patients: a preliminary report. Postgrad Med J. 1987; 63 Suppl 2:151–4. [PubMed] [Google Scholar]
- 10. Bruguera M, Cremades M, Mayor A, Sanchez TJ, Rodes J. Immunogenicity of a recombinant hepatitis B vaccine in haemodialysis patients. Postgrad Med J. 1987; 63 Suppl 2:155–8. [PubMed] [Google Scholar]
- 11. Scheiermann N, Gesemann M, Maurer C, Just M, Berger R. Persistence of antibodies after immunization with a recombinant yeast-derived hepatitis B vaccine following two different schedules. Vaccine. 1990; 8 Suppl:S44–6, S60-2. [DOI] [PubMed] [Google Scholar]
- 12. Asboe D, Rice P, de Ruiter A, Bingham JS. Hepatitis B vaccination schedules in genitourinary medicine clinics. Genitourin Med. 1996; 72(3):210–2. [DOI] [PMC free article] [PubMed] [Google Scholar]
- 13. Marsano LS, Greenberg RN, Kirkpatrick RB, Zetterman RK, Christiansen A, Smith DJ, et al. Comparison of a rapid hepatitis B immunization schedule to the standard schedule for adults. Am J Gastroenterol. 1996; 91(1):111–5. [PubMed] [Google Scholar]
- 14. Hussain Z, Ali SS, Husain SA, Raish M, Sharma DR, Kar P. Evaluation of immunogenicity and reactogenicity of recombinant DNA hepatitis B vaccine produced in India. World J Gastroenterol. 2005; 11(45):7165–8. [DOI] [PMC free article] [PubMed] [Google Scholar]
- 15. Bruguera M, Rodicio JL, Alcazar JM, Oliver A, Del RG, Esteban-Mur R. Effects of different dose levels and vaccination schedules on immune response to a recombinant DNA hepatitis B vaccine in haemodialysis patients. Vaccine. 1990; 8 Suppl:S47–9, S60-2. [DOI] [PubMed] [Google Scholar]
- 16. El-Reshaid K, Al-Mufti S, Johny KV, Sugathan TN. Comparison of two immunization schedules with recombinant hepatitis B vaccine and natural immunity acquired by hepatitis B infection in dialysis patients. Vaccine. 1994; 12(3):223–34. [DOI] [PubMed] [Google Scholar]
- 17. Rustgi VK, Schleupner CJ, Krause DS. Comparative study of the immunogenicity and safety of Engerix-B administered at 0, 1, 2 and 12 months and Recombivax HB administered at 0, 1, and 6 months in healthy adults. Vaccine. 1995; 13(17):1665–8. [DOI] [PubMed] [Google Scholar]
- 18. Winter AP, Follett EA, McIntyre J, Stewart J, Symington IS. Influence of smoking on immunological responses to hepatitis B vaccine. Vaccine. 1994; 12(9):771–2. [DOI] [PubMed] [Google Scholar]
- 19. Gizaris V, Roumeliotou A, Ktenas E, Papoutsakis G, Papaevangelou G. Evaluation of the immunogenicity of a recombinant vaccine against hepatitis B containing S and pre-S2 sequences using two different schedules. Vaccine. 1993; 11(14):1445–7. [DOI] [PubMed] [Google Scholar]
- 20. Jilg W, Schmidt M, Deinhardt F. Vaccination against hepatitis B: comparison of three different vaccination schedules. J Infect Dis. 1989; 160:766–9. [DOI] [PubMed] [Google Scholar]
- 21. Ricciardi G, Graziano G. Safety and immunogenicity of an anti-hepatitis-B vaccine obtained using the recombinant DNA technique: results of a longitudinal study in hospital personnel. Boll Ist Sieroter Milan. 1990; 69(2):385–90. [PubMed] [Google Scholar]
- 22. Hess G, Hingst V, Cseke J, Bock HL, Clemens R. Influence of vaccination schedules and host factors on antibody response following hepatitis B vaccination. Eur J Clin Microbiol Infect Dis. 1992; 11(4):334–40. [DOI] [PubMed] [Google Scholar]
- 23. Bryan JP, Sjogren MH, Macarthy P, Cox B, Kao TC, Perine PL. Dosing schedule for recombinant hepatitis B vaccine. J Infect Dis. 1991; 163(6):1384–5. [DOI] [PubMed] [Google Scholar]
- 24. Wouters K, Leuridan E, Van Herck K, Van Ardenne N, Roelofs I, Mak R, et al. Compliance and immunogenicity of two hepatitis B vaccination schedules in sex workers in Belgium. Vaccine. 2007; 25(10):1893–900. [DOI] [PubMed] [Google Scholar]
- 25. Sheffield JS, Hickman A, Tang J, Moss K, Kourosh A, Crawford NM, et al. Efficacy of an accelerated hepatitis B vaccination program during pregnancy. Obstet Gynecol. 2011; 117(5):1130–5. 10.1097/AOG.0b013e3182148efe [DOI] [PubMed] [Google Scholar]
- 26. Wahl M, Hermodsson S, Iwarson S. Hepatitis B vaccination with short dose intervals—a possible alternative for post-exposure prophylaxis? Infection. 1988; 16(4):229–32. [DOI] [PubMed] [Google Scholar]
- 27. Wright NM, Campbell TL, Tompkins CN. Comparison of conventional and accelerated hepatitis B immunisation schedules for homeless drug users. Commun Dis Public Health. 2002; 5(4):324–6. [PubMed] [Google Scholar]
- 28. Christensen PB, Fisker N, Krarup HB, Liebert E, Jaroslavtsev N, Christensen K, et al. Hepatitis B vaccination in prison with a 3-week schedule is more efficient than the standard 6-month schedule. Vaccine. 2004; 22(29–30):3897–901. [DOI] [PubMed] [Google Scholar]
- 29. Chen HY. Study on immunogenicity and safety of hepatitis B vaccine by accelerated schedule for two years. Chin Hepatol. 2006; 1:63–4. [Google Scholar]
- 30. Yuan YB, Wang ZM, Yu SZ. Study on immunogenicity and safety of hepatitis B vaccine by accelerated schedule for three years. Chin Prev Med. 2006; 7(3):207–8. [Google Scholar]
- 31. Yuan YB, Zhu JG, Duan XK, Wang ZQ. Study on immunogenicity of hepatitis B vaccine by accelerated schedule or by two-dose schedule. J Fourth Mil Med Univ. 2004; 25(11):1042–4. [Google Scholar]
- 32. Van Herck K, Leuridan E, Van Damme P. Schedules for hepatitis B vaccination of risk groups: balancing immunogenicity and compliance. Sex Transm Infect. 2007; 83(6):426–32. [DOI] [PMC free article] [PubMed] [Google Scholar]
- 33. Nyamathi AM, Sinha K, Saab S, Marfisee M, Greengold B, Leake B, et al. Feasibility of completing an accelerated vaccine series for homeless adults. J Viral Hepat. 2009; 16(9):666–73. 10.1111/j.1365-2893.2009.01114.x [DOI] [PMC free article] [PubMed] [Google Scholar]
- 34. Higgins JPT, Altman DG, Gøtzsche PC, Jüni P, Moher D, Oxman AD, et al. The Cochrane Collaboration's tool for assessing risk of bias in randomised trials. BMJ. 2011; 343:d5928 10.1136/bmj.d5928 [DOI] [PMC free article] [PubMed] [Google Scholar]
- 35. Chen W, Gluud C. Vaccines for preventing hepatitis B in health-care workers. Cochrane Database Syst Rev. 2005; 4:D100. [DOI] [PubMed] [Google Scholar]
Associated Data
This section collects any data citations, data availability statements, or supplementary materials included in this article.
Supplementary Materials
(DOC)
(DOC)
(TIF)
(TIF)
(TIF)
(TIF)
(TIF)
(TIF)
(TIF)
Data Availability Statement
All relevant data are within the paper and its Supporting Information files.


