

Abstract
The dorsal lateral geniculate nucleus (dLGN) is a model system for understanding thalamic organization and the classification of inputs as “drivers” or “modulators.” Retinogeniculate terminals provide the primary excitatory drive for the relay of information to visual cortex (V1), while nonretinal inputs act in concert to modulate the gain of retinogeniculate signal transmission. How do inputs from the superior colliculus, a visuomotor structure, fit into this schema? Using a variety of anatomical, optogenetic, and in vitro physiological techniques in mice, we show that dLGN inputs from the superior colliculus (tectogeniculate) possess many of the ultrastructural and synaptic properties that define drivers. Tectogeniculate and retinogeniculate terminals converge to innervate one class of dLGN neurons within the dorsolateral shell, the primary terminal domain of direction-selective retinal ganglion cells. These dLGN neurons project to layer I of V1 to form synaptic contacts with dendrites of deeper-layer neurons. We suggest that tectogeniculate inputs act as “backseat drivers,” which may alert shell neurons to movement commands generated by the superior colliculus.
SIGNIFICANCE STATEMENT The conventional view of the dorsal lateral geniculate nucleus (dLGN) is that of a simple relay of visual information between the retina and cortex. Here we show that the dLGN receives strong excitatory input from both the retina and the superior colliculus. Thus, the dLGN is part of a specialized visual channel that provides cortex with convergent information about stimulus motion and eye movement and positioning.
Keywords: corticogeniculate, frequency dependent depression, optogenetics, retinogeniculate, tectogeniculate, ultrastructure
Introduction
The concept of defining afferents as “drivers” or “modulators” has reshaped our current view of thalamic function. The dorsal lateral geniculate nucleus (dLGN), the principal relay of retinal information to the visual cortex, is widely accepted as a prototype for delineating the structural and functional organization of these two classes of inputs (Sherman and Guillery, 1998; Guillery and Sherman, 2002). While retinal inputs provide the primary excitatory drive onto thalamocortical (relay) cells in the dLGN, they comprise only about 10% of all synapses in this nucleus. Instead, the vast majority of synapses arise from nonretinal sources, such as projections from the visual cortex, brainstem, and thalamic reticular nucleus. These nonretinal inputs have been characterized as modulators because they have little impact on the receptive field structure of relay cells, but provide a powerful substrate for modulating the gain of retinogeniculate (RG) signal transmission in a state-dependent manner.
A projection from the superior colliculus (SC), or tectum, to the dLGN has been identified in a number of mammalian species (Harting et al., 1991), but remarkably, an understanding of how tectogeniculate (TG) input fits within the framework of thalamic function is lacking. In rodents, TG projections are confined to the dorsolateral shell, a thin lamina that resides just beneath the optic tract (OT; Reese, 1988; Grubb and Thompson, 2004). This region is innervated by retinal ganglion cells that are sensitive to the direction of visual motion [direction-selective ganglion cells (DSGCs); Huberman et al., 2009; Kay et al., 2011; Rivlin-Etzion et al., 2011; Dhande et al., 2013; Cruz-Martín et al., 2014] and also contains dLGN cells that exhibit direction-selective responses (Marshel et al., 2012; Piscopo et al., 2013; Scholl et al., 2013; Zhao et al., 2013). Such convergence suggests that TG projections participate in coding the direction of visual stimulus movement. This idea is further supported by the fact that TG cells are located in the most superficial regions of the SC stratum griseum superficiale (SGS; Mooney et al., 1988; Diamond et al., 1991). Like the dorsolateral shell of the dLGN, the SGS is innervated by DSGCs (Huberman et al., 2009; Kay et al., 2011; Rivlin-Etzion et al., 2011; Dhande et al., 2013) and contains neurons that respond selectively to visual motion, some of which have been identified as TG cells (Mooney et al., 1985, 1988; Waleszczyk et al., 2004; Wang et al., 2010; Gale and Murphy, 2014; Inayat et al., 2015). Thus, the dorsolateral shell of the dLGN appears to receive two distinct sources of direction-selective signals, one from the retina and one from the SC. Surprisingly, we found that TG inputs display the signature characteristics of driver synapses. Moreover, TG and retinal inputs converge to innervate a distinct class of relay cells that project to layer 1 of V1. Together our results provide further evidence for structurally and functionally distinct parallel visual channels within the mouse dLGN.
Materials and Methods
Animals.
All breeding and experimental procedures were approved by the University of Louisville and Virginia Commonwealth University Institutional Animal Care and Use Committees. Experiments were performed using mice, of either sex, of the following lines: C57/BLK6; mice that the express green fluorescent protein (GFP) in thyrotropin-releasing hormone receptor (TRHR)-expressing ganglion cells (Rivlin-Etzion et al., 2011); the Cre driver line GAD2-ires-Cre (Jackson Labs, stock #010802); Gad2tm2(cre)Zjh/J (Taniguchi et al., 2011); and the GAD2-ires-Cre mice crossed with the Ai9 reporter line [Jackson Labs, stock #007900, strain B6.Cg-Gt(ROSA)26Sortm9(CAG-tdTomato)Hze/J].
Biotinylated dextran amine injections.
To label TG or geniculocortical (GC) projections via anterograde transport, mice ranging in age between postnatal day 30 (P30) and P60 were deeply anesthetized with a mixture of ketamine (120–140 mg/kg) and xylazine (12–14 mg/kg) and placed in a stereotaxic apparatus (Angle Two Stereotaxic, Leica). An incision was made along the scalp, and a small hole was drilled in the skull above the SC or dLGN. A glass pipette (10 μm tip diameter) containing a 5% solution of biotinylated dextran amine (BDA; Invitrogen) in saline was lowered into the SC or dLGN, and BDA was iontophoretically ejected using 3 μA continuous positive current for 20 min. After removal of the pipette, the scalp skin was sealed with tissue adhesive (n-butyl cyanoacrylate), and the animals were placed on a heating pad until mobile. After surgery, animals were carefully monitored for proper wound healing, and the analgesic buprenorphine (0.02 mg/kg) was administered every 12 h for 48 h.
Cholera toxin subunit B injections.
To label TG cells via retrograde transport, P30–P60 wild-type or GAD2-cre-Ai9 mice were prepared as described above. A glass pipette (10–20 μm tip diameter) containing a 0.2% solution of cholera toxin subunit B (CTB) conjugated to Alexa Fluor 488 (CTB-488) in PBS [0.01 m phosphate buffer (PB) with 0.9% NaCl] was lowered into the dLGN, and CTB was iontophoretically ejected using 3 μA continuous positive current for 15 min. After removal of the pipette, the wound was closed and the animals were treated during recovery as described above.
Adeno-associated virus and CTB injections.
An adeno-associated virus (AAV; serotype 2/1) carrying a vector for the Channelrhodopsin variant Chimera EF with I170 mutation (ChIEF) fused to the red fluorescent protein, tdTomato, was injected into the SC of wild-type mice to label TG terminal arbors in the dLGN for light and electron microscopic analysis as well as to photoactivate TG terminals during in vitro physiology experiments (for production details, see Jurgens et al., 2012). For virus delivery, mice ranging in age between P22 and P24 were deeply anesthetized with a mixture of ketamine and xylazine. An incision was made along the scalp, and a small hole created in the skull above the SC. Virus was delivered via a 34 gauge needle attached to a Nanofil syringe inserted in an UltraMicroPump. Volumes of 100–200 nl were injected at a rate of 10 nl/min.
In some animals, following virus injections in the SC, an additional hole was drilled in the skull above V1. The dura was carefully removed, and a small piece of filter paper that had been immersed in a 0.1% solution of CTB-488 in PBS was placed on the cortex surface to label geniculocortical cells by retrograde transport. The wound was then closed and the animal monitored during recovery as described above.
Cre-dependent AAV injections in GAD2-cre mice.
Flex-rev-oChIEF-tdTomato (plasmid 30541, Addgene) was packaged using AAV serotype 9. This viral vector was injected into the SC of GAD2-cre mice to examine GABAergic projections from this structure. For virus delivery, mice ranging in age between P25 and P36 were deeply anesthetized with a mixture of ketamine and xylazine. An incision was made along the scalp, and a small hole created in the skull above the SC. Virus was delivered via a 34 gauge needle attached to a Nanofil syringe inserted in an UltraMicroPump. Volumes of 60–75 nl were injected at a rate of 10–20 nl/min.
Slice preparation and in vitro recording.
At 8 to 12 d following injection of the AAV serotype 2/1, mice were deeply anesthetized with Avertin (0.5 mg/gm), rapidly decapitated, and brains were placed into cold (4°C), oxygenated (95% O2/5% CO2) slicing solution containing the following (in mm): 2.5 KCl, 26 NaHCO3, 2.5 KCl, 1.25 NaH2PO4, 10 MgCl2, 2 CaCl2, 234 sucrose, and 11 glucose. Coronal slices (300 μm) were cut at the level of dLGN and SC using a vibrating tissue slicer (Leica). Then slices were incubated in oxygenated (95% O2/5% CO2) artificial CSF (ACSF) [containing (in mm) 126 NaCl, 26 NaHCO3, 2.5 KCl, 1.25 NaH2PO4, 2 MgCl2, 2 CaCl2, and 10 glucose] at 32°C for 30 min and later maintained at room temperature.
Whole-cell recordings were obtained from dLGN neurons as described previously with minor modifications (Govindaiah et al., 2012). Briefly, individual brain slices were transferred to a recording chamber that was maintained at 32°C and continuously perfused with oxygenated ACSF (2.5 ml/min, 95% O2/5% CO2). Neurons were visualized on an upright microscope (Olympus BX51WI) equipped with both differential interference contrast optics and filter sets for visualizing CTB-488 (Chroma 49002) or tdTomato (Chroma 49005) using a 10× or 60× water-immersion objective (Olympus) and a CCD camera. Recording pipettes were pulled from borosilicate glass capillaries using a vertical puller (Narishige) and filled with an intracellular solution containing the following (in mm): 117 K-gluconate, 13.0 KCl, 1 MgCl2, 0.07 CaCl2, 0.1 EGTA, 10 HEPES, 2 Na-ATP, and 0.4 Na-GTP. The pH and osmolality of internal solution were adjusted to 7.3 and 290 mOsm, respectively. Whole-cell recordings were obtained using a Multiclamp 700B amplifier (Molecular Devices). Data were filtered at 2.5 kHz, digitized at 10 kHz, and analyzed using pClamp 10 (Molecular Devices). In some experiments, data acquisition and analysis were accomplished using Strathclyde Electrophysiology Software (Whole Cell Analysis Program, version 3.8.2), and digitized at 10–100 kHz through an analog-to-digital board (National Instruments, PCI-6221). A 10 mV junction potential was subtracted for all voltage recordings. For voltage measurements, recordings were made from cells with a resting membrane potential between −55 and −75 mV, whereas membrane currents were obtained at −70 mV. Pipette capacitance, series resistance, and whole-cell capacitance were carefully monitored and compensated electronically during the recording. Only experiments in which series resistance remained relatively stable (20% change) were included for analysis.
For photoactivation of tectogeniculate terminals, light from a blue light emitting diode (Prizmatix UHP 460) was reflected into a 4× or 60× objective. This produced a spot of blue light onto the submerged slice with an approximate diameter of 2.2 or 0.45 mm, respectively. Pulse duration and frequency were under computer control. For repetitive stimulation, pulse duration was between 2 and 7 ms.
For electrical activation of retinogeniculate terminals, a monopolar electrode was placed in the OT. Synaptic responses were evoked with various intensities (25–150 μA) and frequencies (1–100 Hz) at 10 s interstimulus intervals. EPSCs were evoked at a holding potential of −70 mV in the presence of the GABAA receptor (GABAAR) antagonist SR95531 (4-[6-imino-3-(4-methoxyphenyl) pyridazin-1-yl] butanoic acid hydrobromide; 10 μm).
The peak amplitude of synaptic responses was measured from baseline values for three to five traces for each condition using pClamp 10 software (Molecular Devices). To quantify the degree of facilitation in responses evoked by repetitive trains of light or electrical stimulation, the amplitude of the second to tenth responses was divided by the amplitude of the initial response. The paired-pulse ratio (PPR) was determined by dividing the amplitude of the second EPSC by the amplitude of the first EPSC.
Histology.
At the conclusion of in vitro recordings, dLGN slices were placed in a fixative solution of 4% paraformaldehyde in 0.1 m PB. Slices were kept in this solution overnight at 4°C and then washed in PB. For labeling, slices were treated with 0.1% Triton X-100 and Alexa Fluor 633 conjugated to strepavidin (1:1000; Invitrogen, catalog no. S21374) in PBS for 24 h. Slices were then rinsed with PBS, mounted with Prolong Gold (Invitrogen, catalog no. P36930), and coverslipped. Images of filled cells were collected using a confocal microscope (Olympus, model no. FV1200BX61).
Two days following injection of CTB-488, 7 d following injection of BDA, 10 d following the injection of AAV 2/1 or AAV 2/1 and CTB-488, or 10–16 d after the injection of cre-dependent AAV9, mice were deeply anesthetized with Avertin (0.5 mg/gm) and transcardially perfused with a fixative solution of 4% paraformaldehyde in 0.1 m PB, 2% paraformaldehyde and 2% glutaraldehyde in 0.1 m PB, or 4% paraformaldehyde and 2.5% glutaraldehyde in 0.1 m cacodylate buffer. Brains were removed from the skulls and 70-μm-thick coronal sections of cortex and thalamus were cut using a vibratome (Leica). Sections that contained tdTomato and/or CTB-488 were mounted on slides and imaged using a confocal microscope (Olympus FV1200BX61).
Sections that contained CTB-488 injections in the dLGN and CTB-488-labeled TG cells were incubated overnight in a rabbit anti-CTB antibody (Sigma, catalog #C3062; 1:10,000). For wild-type animals that received CTB injections, the following day, the sections were incubated in a 1:100 dilution of a biotinylated goat-anti-rabbit antibody (1 h) followed by a 1:100 dilution of avidin and biotinylated horseradish peroxidase (ABC solution, Vector Laboratories; 1 h) and reacted with nickel-enhanced diaminobenzidine (DAB). The sections were then mounted on slides, and a Neurolucida system (MBF Bioscience) was used to plot the distribution of the CTB-labeled TG cells. The MBF Bioscience solid modeling extension module was then used to reconstruct the SC and view the distribution of TG cells across its dorsal surface. For GAD2-cre-Ai9 animals that received CTB injections, sections were incubated overnight in the rabbit anti-CTB antibody (1:10,000), and the following day the sections were incubated in a 1:100 dilution of a biotinylated goat-anti-rabbit antibody (1 h), followed by a 1:100 dilution of avidin conjugated to Alexa Fluor 488 (Vector Laboratories). The sections were then mounted on slides and imaged using a confocal microscope.
For ultrastructural analysis of tdTomato-labeled terminals following virus injections, the sections were incubated in a 1:1000 dilution of a rabbit-anti-DsRed antibody (Clonetech, catalog #632496) overnight. The following day, the sections were incubated in a biotinylated goat-anti-rabbit antibody, ABC solution, and reacted with DAB (as described above). To reveal the location of BDA, sections were incubated overnight in ABC solution and reacted the next day with DAB.
For electron microscopy, sections that contained DAB-labeled terminals were postfixed in 2% osmium tetroxide, dehydrated in an ethyl alcohol series, and flat embedded in Durcupan resin between two sheets of Aclar plastic (Ladd Research). Durcupan-embedded sections were first examined with a light microscope to select areas for electron microscopic analysis. Selected areas were mounted on blocks, ultrathin sections were cut using a diamond knife, and sections were collected on Formvar-coated nickel slot grids. Selected sections were stained for the presence of GABA, as described previously (Chomsung et al., 2010). Briefly, we used a rabbit polyclonal antibody against GABA (Sigma, catalog #A2052; used at a dilution of 1:1000–1:2000) that was tagged with a goat-anti-rabbit antibody conjugated to 15 nm gold particles (GE Healthcare). The sections were air dried and stained with a 10% solution of uranyl acetate in methanol for 30 min before examination with an electron microscope.
Results
Organization of the dorsolateral shell
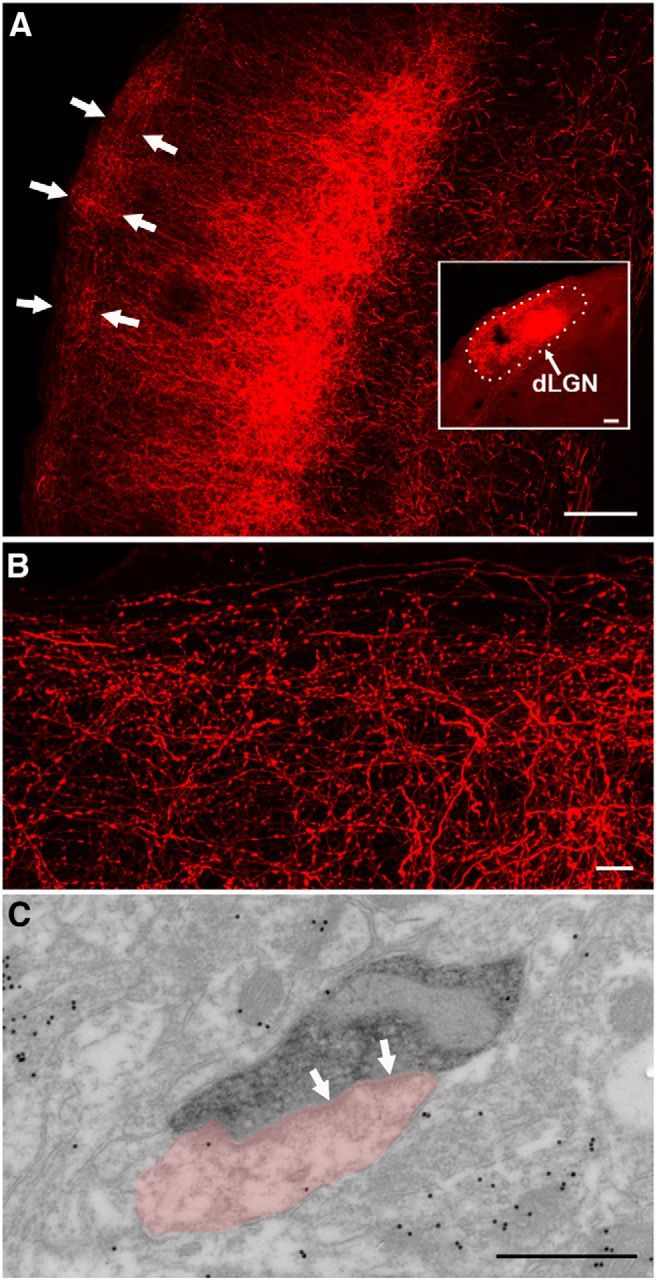
Figure 1 depicts the structural composition of the dorsolateral shell of the dLGN in a mouse line (TRHR) that expresses GFP in DSGCs that respond to posterior motion (Rivlin-Etzion et al., 2011). GFP-labeled retinogeniculate projections in these mice terminate in a thin band that corresponds to the dorsolateral shell (Fig. 1A–F, green). To examine the relationship between DSGC terminal domains and TG input, virus injections were placed in the SC (Fig. 1C, inset) to induce the expression of TdTomato (Fig. 1A–D, red) in TG terminals (n = 2). As expected, TG projections terminate in the dorsolateral shell and overlap with DSGC projections throughout the rostrocaudal extent of the dLGN (Fig. 1A–C). To quantify the distribution of TG terminals relative to TRHR terminals, we calculated the number of red pixels contained within the region of GFP-labeled terminals and divided this by the number of red pixels within the borders of the dLGN (n = 5 sections). This analysis revealed that 95.67 ± 3.7% of labeled tectogeniculate terminals were located in the dorsolateral shell, as defined by the presence of GFP-labeled TRHR terminals.
Figure 1.
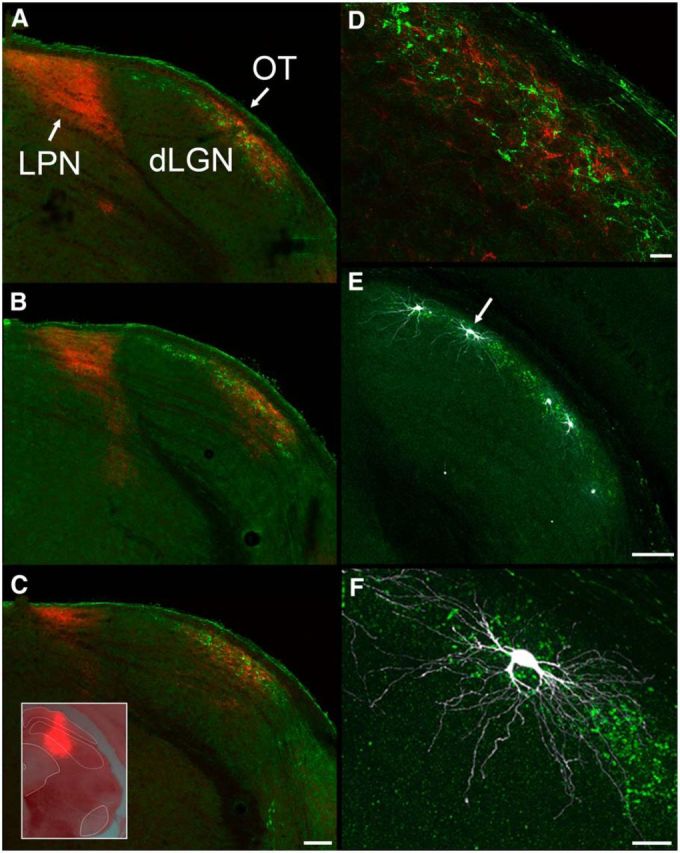
A–F, Components of the dLGN dorsolateral shell. In TRHR mice, in which GFP is expressed in direction-selective retinogeniculate terminals (green), virus injections were placed in the SC (C, inset) to induce the expression of TdTomato in tectothalamic terminals (red). A caudal (A) to rostral (C) series of sections illustrates the overlap of tectogeniculate and TRHR retinogeniculate terminals in the dorsolateral shell of the dLGN (also shown at higher magnification in D). Cells filled with biocytin in TRHR animals exhibit W-cell morphology (E; arrow indicates cell shown at higher magnification in F). Scale bars: C (for A–C), E, 100 μm; D, 20 μm; F, 25 μm.
To examine the type of dLGN cells that receive input from these two sources, we made in vitro whole-cell recordings in the dorsolateral shell of TRHR mice and filled recorded cells with biocytin (Fig. 1E,F). Confocal reconstructions of biocytin-filled cells revealed that relay neurons residing in GFP-labeled terminal domains (n = 12) had a hemispheric dendritic architecture resembling “W-like” cells (Krahe et al., 2011). In fact, recordings restricted to this region in wild-type mice, showed that all filled cells (n = 32) were W-like (Figs. 1, 4, 7). Using our previously reported Scholl ring analysis (Krahe et al., 2011), all filled cells in the dorsolateral shell (n = 12 in TRHR and n = 32 in wild type) exhibited direction of orientation index values of 0.5–0.79. The overlap of tectal terminals and W-like cells in the mouse is consistent with the pattern seen in the carnivore C laminae and the primate koniocellular layers of the dLGN (Stanford et al., 1981; Harting et al., 1991; Lachica and Casagrande, 1993), suggesting that across species, the tectogeniculate pathway is a component of a distinct visual channel.
Figure 4.
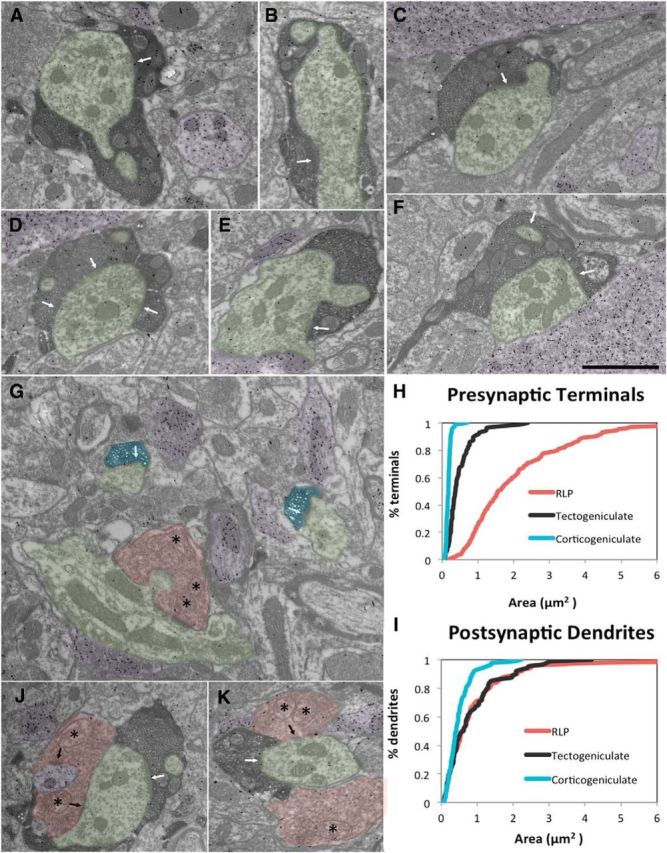
A–K, Ultrastructure of TG terminals. TG terminals (dark reaction product, A–F, J, K) are significantly larger than CG terminals (G, blue) and significantly smaller than retinogeniculate terminals (G, J, K, red), identified by their pale mitochondria (asterisks) as RLP profiles. The cumulative distribution of terminals sizes is illustrated in H. RLP, TG, and CG terminals primarily contact (arrows) non-GABAergic relay cell dendrites (green). GABAergic profiles are identified by a high density of overlying gold particles (purple; A, C–K). The cumulative distribution of postsynaptic dendrite sizes is illustrated in I. CG terminals contact dendrites that are significantly smaller than the dendrites contacted by TG and RLP terminals. RLP and TG converge to innervate larger caliber dendrites (J, K). Scale bar: (in F) A–G, J, K, 1 μm.
Figure 7.
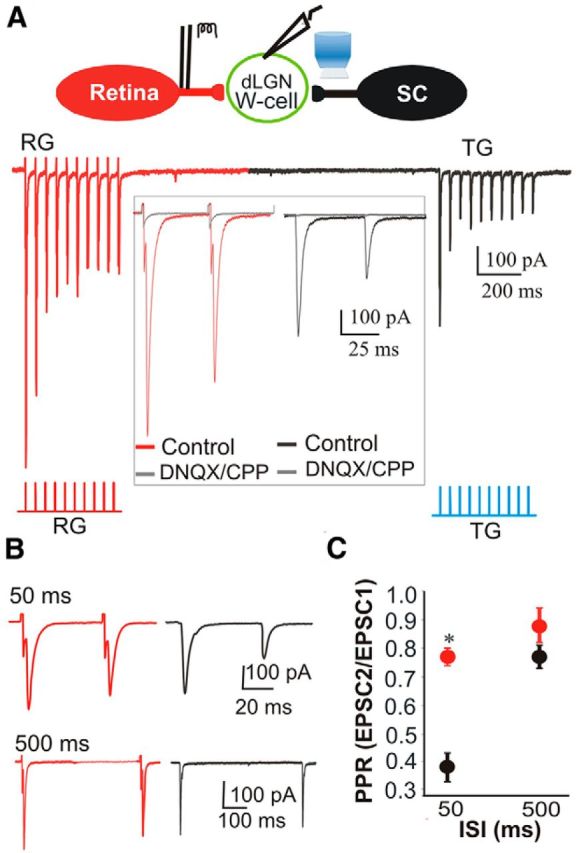
Functional convergence of TG and RG inputs. A, Top, Schematic diagram showing whole-cell recordings from a dLGN relay neuron following electrical stimulation of RG axons in the optic tract and photostimulation of TG terminals in the dorsolateral shell. Beneath are EPSCs recorded in a single cell evoked by repetitive activation (20 Hz) of RG (red traces) and TG (black traces) inputs. Both sets of responses showed synaptic depression. Red and blue ticks indicate corresponding stimulus protocols. Inset, Expanded traces of the first two RG (red) and TG (black) responses under control conditions. Superimposed gray traces depict responses following bath application of DNQX and CPP; these glutamate receptor antagonists abolished both sets of responses. B, Example RG (red) and TG (black) EPSCs evoked by paired-pulse stimuli (50 and 500 ms interstimulus intervals). C, Summary plot showing the mean and SEM (n = 6) of PPRs for RG (red) and TG (black) EPSCs at 50 and 500 ms interstimulus intervals. At 50 ms, the TG PPR was smaller, indicating greater synaptic depression. *p < 0.001.
Tectogeniculate topography
To examine the distribution of TG cells, small iontophoretic injections of the retrograde tracer CTB were confined to different regions of the dLGN in wild types (n = 8). These injections labeled cells in restricted regions of V1 and the SGS of the SC. Following injections in the lateral dLGN (Fig. 2A, injection site photo; F, injection site reconstructed in red), corticogeniculate (CG) cells were labeled in rostral V1 (A), and TG cells were confined to lateral regions of the SGS (D, labeled TG cells, red arrow; G, full distribution of TG cells, red dots), whereas injections in the medial dLGN (C, injection site photo; F, injection site reconstructed in green) labeled CG cells in caudal V1 (B) and TG cells in the medial regions of the SGS (E, labeled cells, green arrow; G, full distribution of TG cells, green dots). These results indicate that TG projections are organized in a topographic manner. Comparison of the distribution of TG cells labeled by retrograde transport to the organization of visual receptive fields in the mouse SGS (Dräger and Hubel, 1976) suggests that TG projections to the medial or lateral dLGN represent the upper/nasal and lower/temporal visual fields, respectively (Fig. 2G). Together, these results indicate that CG and TG projections are in register with the visual field representation in V1 (Dräger, 1975) and the dLGN (Piscopo et al., 2013).
Figure 2.
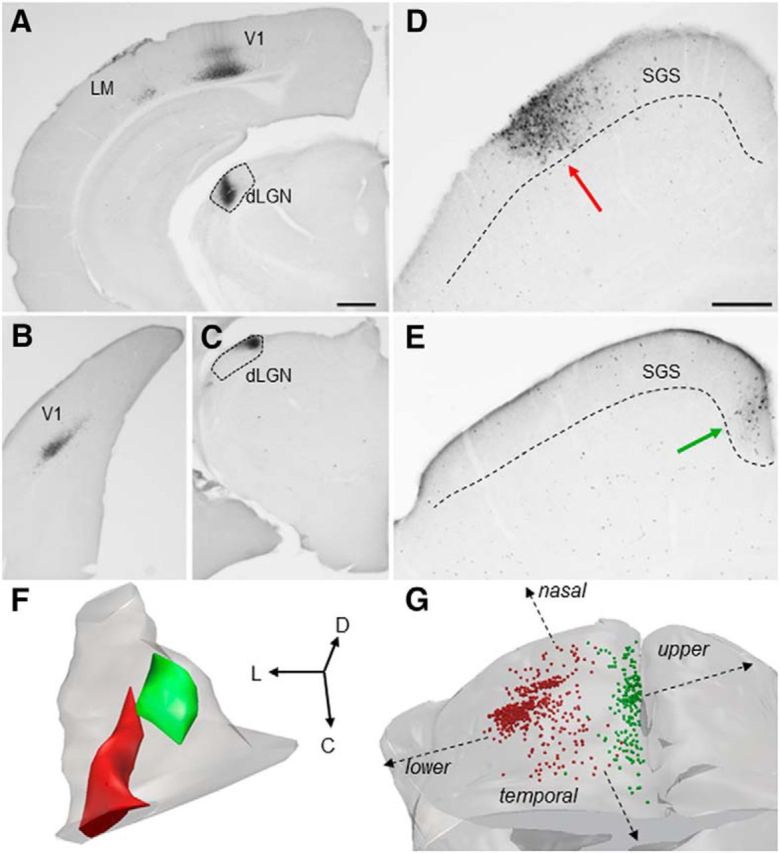
A–G, TG topography. Small iontophoretic injections of CTB in the lateral dLGN (A, coronal section; F, 3D reconstruction of dLGN, red) labeled corticogeniculate cells in layer VI of rostral V1 and the lateromedial (LM) cortex (A) and TG cells in the lateral SGS of the SC (D, coronal section, red arrow; G, 3D distribution, red dots). Small iontophoretic injections of CTB in the medial dLGN (C, coronal section; F, 3D reconstruction of dLGN, green) labeled corticogeniculate cells in layer VI of caudal V1 (B) and TG cells in the medial SGS (E, coronal section, green arrow; G, 3D distribution, green dots). Based on the SC receptive field positions mapped by Dräger and Hubel (1976), TG projections to the medial and lateral dLGN likely represent upper and visual fields, respectively (schematically indicated in G). Scale bars: (in A) A–C, 500 μm; (in D) D, E, 250 μm Orientation of 3D reconstructions in F and G is indicated by arrows. D, Dorsal; L, lateral; C, caudal.
The vast majority of tectogeniculate projections are non-GABAergic
To determine whether TG projections contain GABA, we performed two different experiments. First, we iontophoretically injected CTB-488 into the dLGN of GAD2-cre-Ai9 mice (in which tdTomato is expressed in GABAergic neurons) to label TG cells by retrograde transport, as described and illustrated above (n = 3). A one in two series of sections from each case was mounted on slides, and all SC sections that contained CTB-labeled cells were imaged using a confocal microscope using 2 μm optical sections (Fig. 3A). In each imaged section, the number of CTB-labeled cells within the SGS that did (Fig. 3B,C, arrow) or did not (asterisks) contain TdTomato were counted. This analysis revealed that very few TG cells contained TdTomato (case 1, 19 of 497 TG cells, or 3.82%; case 2, 36 of 629 TG cells, or 5.72%; case 3, 9 of 226 TG cells, or 3.98%; three cases combined, 64 of 1352 TG cells, or 4.73%), indicating that 95% of TG cells are non-GABAergic cells.
Figure 3.

A–E, Tectogeniculate projections are primarily non-GABAergic. Injections of CTB-488 were inotophoretically injected into the dLGN of GAD2-cre mice crossed with Ai9 reporter mice. These injections labeled cells in the SGS (A, confocal 6 μm optical image) by retrograde transport (green cells) that were largely nonoverlapping with the population of GABAergic neurons labeled with tdTomato (red cells). The rectangle in A indicates the region shown in 2 μm optical images at higher magnification in B (CTB and tdTomato-labeled cells) and C (tdTomato only). Most CTB-labeled neurons did not contain tdTomato (asterisks), but tdTomato could be detected in 5% of CTB-labeled cells (e.g., cell indicated by the arrows). Large injections of cre-dependent virus into the SC of GAD2-cre mice (D, pseudocolored green) labeled sparse projections in the dLGN (E, green). Scale bars: A, 50 μm; (in B) B, C, 25 μm; (in D) D, E, 100 μm.
Next, we injected a cre-dependent virus in the SC of GAD2-cre mice (n = 8; Fig. 3D) to label GABAergic cells in the SC and their axons projections with the red fluorescent protein tdTomato. The tdTomato-labeled axon projections of GABAergic SC neurons were densely distributed within the ventral lateral geniculate nucleus and pretectum. Sparse projections could also be detected in the dLGN (Fig. 3E), as described previously (Gale and Murphy, 2014). Together, these experiments demonstrate that a small population of TG cells are GABAergic and sparsely innervate the dLGN.
TG terminals: a new class of dLGN synaptic profile
The majority of cells in the mouse SGS prefer relatively small stimuli (6–10°), although this varies widely with cell type (Wang et al., 2010; Gale and Murphy, 2014). In the dLGN, direction-selective cells prefer larger spot sizes (17.2 ± 3.66°; Piscopo et al., 2013), potentially due to convergence of retinogeniculate and/or TG inputs on their widespread dendritic arbors (Fig. 1F; Krahe et al., 2011). To determine how TG projections are distributed on the dendritic arbors of the W-like cells in the dorsolateral shell, we next examined the ultrastructure of TG synaptic terminals and their postsynaptic dendrites and compared these projections to those formed by RG and CG projections.
Four major types of terminals have been found to make up the neuropil of the dLGN (Guillery, 1969; Bickford et al., 2010): (1) large glutamatergic terminals that contain round vesicles and distinctive mitochondria with widened cristae that make them appear pale relative to surrounding mitochondria (RLP profiles), identified as RG terminals (Robson and Mason, 1979; Fig. 4G,J,K, red); (2) small glutamatergic terminals with round vesicles and dark mitochondria (RS profiles; Fig. 4G, blue), which primarily originate from the cortex (Erişir et al., 1997); (3) profiles that contain GABA within densely packed flattened or pleomorphic vesicles (F1 profiles), contributed by the thalamic reticular nucleus, pretectum, or interneuron axons (Wang et al., 2001, 2002); and (4) interneuron dendritic terminals (Hamos et al., 1985) that contain GABA and loosely packed vesicles (F2 profiles).
To examine the ultrastructure of TG terminals, we first placed injections of BDA in the mouse SC to label terminals by anterograde transport, and then stained dLGN sections containing labeled terminals with an antibody against GABA. We found that three types of terminals were labeled: (1) RLP profiles, (2) F1 profiles, and (3) non-GABAergic profiles that contained round vesicles and dark mitochondria but that were larger than RS profiles (RM profiles; Fig. 4A–F,J,K).
We interpret the BDA-labeled RLP profiles as retinal terminals originating from axons that branch to innervate both the dLGN and SC (Tamamaki et al., 1995); we demonstrated previously in cats that SC BDA injections can be used to label the geniculate branches of retinotectal axons (Datskovskaia et al., 2001). The BDA-labeled F1 profiles originate either from the SC (based on the results described above) or from other sources, such as GABAergic pretectal cells that innervate the dLGN (Cucchiaro et al., 1991; Bickford et al., 2000; Wang et al., 2002) and SC (Baldauf et al., 2003). We interpret the BDA-labeled RM profiles as TG terminals that originate from the non-GABAergic TG cells described above.
To quantify TG terminal morphology without the complications of uptake by fibers of passage, we injected an AAV into the SC to induce the expression of the red fluorescent protein tdTomato in SC neurons and their axon projections (Fig. 1A–D). Using an antibody to detect the tdTomato, we then examined the ultrastructure of the virus-labeled terminals. It is important to note that none of the virus-labeled TG terminals contained pale mitochondria, indicating that TG terminals can be distinguished from RG profiles based on the ultrastructure of their mitochondria (Robson and Hall, 1977). We also found that virus-labeled TG terminals were significantly smaller than RLP profiles (Fig. 4H; one way ANOVA, p < 0.0001). Moreover, TG terminals were significantly larger than CG terminals, which we labeled by injecting BDA in V1 (Fig. 3G; one way ANOVA, p < 0.001). Thus, TG terminals constitute a new class of dLGN synaptic profile.
Finally, we examined the size of the dendrites postsynaptic to RG terminals (identified by their ultrastructure; n = 179), virus-labeled TG terminals (n = 108), and BDA-labeled CG terminals (n = 87). As described previously for other species (Wilson et al., 1984; Li et al., 2003a), mouse RG terminals contact significantly larger (more proximal) dendrites compared to the dendrites contacted by CG terminals (Fig. 4I; one way ANOVA, p < 0.0001). Surprisingly, we detected no significant difference in the size of dendrites contact by TG and RG terminals. This suggests that RG and TG terminals both innervate the more proximal dendrites of dLGN neurons. In fact, we noted that in some cases TG terminals contacted dendrites that were also contacted by RLP profiles (Fig. 4J,K), indicating convergence of TG and RG inputs onto single neurons of the dorsolateral shell.
TG responses are “driver-like” and converge with RG inputs
To examine the postsynaptic responses in the dLGN elicited by activation of TG inputs, we injected an AAV carrying the coding sequence for TdTomato and the channel rhodopsin variant Chimera EF with I170 mutation (Jurgens et al., 2012). This induced the expression of TdTomato/ChIEF in TG terminals within the dorsolateral shell (Fig. 1A–C). Whole-cell recordings of dLGN cells were obtained with biocytin-filled pipettes within regions of the dorsolateral shell that contained labeled TG terminals (Fig. 5A). Blue light stimulation of these regions (1–100 ms duration) evoked large and reliable EPSPs that were capable of eliciting trains of action potentials that faithfully followed the duration and temporal frequency of stimulation (Fig. 5B–D). At hyperpolarized membrane potentials, light-activated EPSPs could also evoke low-threshold Ca2+ spikes and burst firing (Fig. 5B). These light-evoked responses were unaffected by bath application of the GABAA receptor antagonist bicuculline (10 μm), were reduced in amplitude by bath application of the NMDA antagonist AP5 (50 μm), and completely abolished with the subsequent addition of the AMPA receptor antagonist DNQX (10 μm; Fig. 5C,D). Gale and Murphy (2014) demonstrated previously that inhibitory postsynaptic potentials can be elicited in dLGN cells when the GABAergic TG projections are isolated for activation using optogenetic techniques in transgenic animals. However, our experimental protocols did not detect this minor projection. Reconstructions of biocytin-filled cells that were activated by blue light (n = 32) indicated they all displayed W-like morphology (Fig. 5A; dendritic orientation index, 0.5–0.79; Krahe et al., 2011). Together, our anatomical and physiological results indicate that the vast majority of TG terminals are glutamatergic and contact the proximal dendrites of W cells in the dorsolateral shell of the dLGN.
Figure 5.
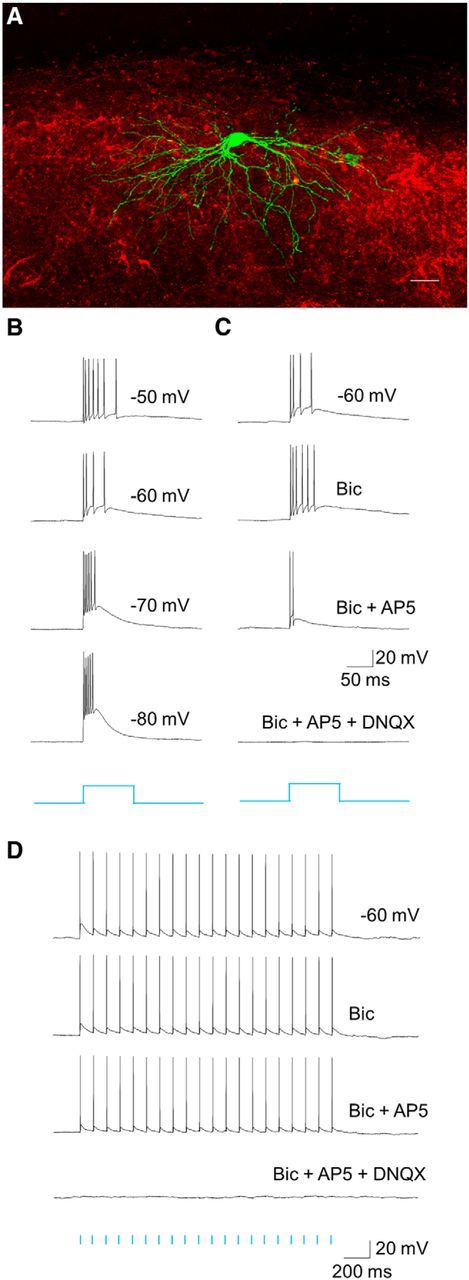
Light-evoked TG responses. A, Confocal image of a coronal section of the dorsal lateral shell of the dLGN depicting a W-like biocytin-filled relay neuron (green) and tectogeniculate axons (red) expressing tdTomato following a virus injection in the SC. B, Whole-cell,current-clamp recording showing large postsynaptic excitatory responses of a dLGN cell evoked by blue light stimulation (200 ms pulse) of tectogeniculate terminals expressing ChIEF. Responses were recorded at different holding potentials. C, Optically evoked postsynaptic responses of the same cell before and during bicuculline (Bic; 25 μm), AP5 (50 μm), and DNQX (10 μm) application. Bic and AP5 had little to no effect on synaptic response, whereas DNQX application completely abolished it. D, A similar effect could be observed when the cell was stimulated by a train of light pulses (20 pulses at 10 Hz).
Voltage-clamp recordings to pairs (Fig. 6A) or trains (B) of repetitive pulses of blue light revealed a strong synaptic depression. Paired-pulse stimulus presentation (100 ms interstimulus interval) showed an approximately twofold reduction in EPSC amplitude between the initial (EPSC1) and second response (EPSC2; PPR mean, 0.56; n = 15; Fig. 6A). A similar form of paired-pulse depression was observed with a 20 Hz train of light, with response amplitudes of subsequent EPSCs showing no further reduction (Fig. 6B; n = 12). To compare this feature of TG responses to those of simultaneously recorded retinogeniculate synaptic responses, we electrically stimulated the OT to activate RG terminals. We found that neurons that exhibited a light-evoked TG response were also activated by electrical stimulation of the OT (Fig. 7; n = 6). Both sets of responses were large in amplitude (mean ± SEM; RG = 601 ± 58.8 pA; TG = 238 ± 34.1 pA, both n = 6; paired t test indicates significant difference at p = 0.002), blocked by glutamate antagonists (n = 3; Fig. 6, inset), and showed paired-pulse depression. At shorter interstimulus intervals (50 ms vs 500 ms), PPR values reflected a greater form of depression for TG to compared to RG stimulation (paired t test, p < 0.001). Such excitatory convergence is consistent with our ultrastructural results (Fig. 4J,K). The differences in overall EPSC amplitudes and PPRs of these two terminal types may reflect the smaller terminal profiles of TG input (Fig. 4H) and/or the complement of presynaptic proteins that regulate the synaptic vesicle cycle (Kielland et al., 2006; Wei et al., 2011).
Figure 6.

Synaptic depression of TG responses. A, Top, Representative voltage-clamp recording of postsynaptic responses in dLGN evoked by paired-pulse light stimulation (100 ms interstimulus interval) of ChIEF expressing SC terminals (average of 10 responses). Bottom, Summary plot depicting the paired-pulse ratio (EPSC2/EPSC1) for 15 relay cells evoked by the same stimulus conditions. Gray symbols represent PPR of individual cells and the black symbol represents the mean and SEM. PPRs reflect strong synaptic depression. B, Top, Representative recording showing TG synaptic responses evoked by a 20 Hz train of light (average of 10 responses). Bottom, Summary plot showing the degree of depression of light evoked EPSCs as a function of stimulus number for 12 neurons. To calculate depression percentage, the amplitude of the nth response was divided by the first response and multiplied by 100. Error bars indicate SEM.
Neurons postsynaptic to TG terminals contact non-GABAergic dendrites in V1 layer I
In primates, TG projections are confined to the koniocellular layers of the dLGN (Harting et al., 1991), which project to the superficial layers of V1 (Hendry and Yoshioka, 1994; Casagrande et al., 2007). Similarly, W cells in the tectorecipient layers of the cat dLGN project primarily to the superficial layers of V1 (Anderson et al., 2009). To test whether a similar organization is found in the mouse, we combined retrograde tracing techniques with viral vector injections. To label dLGN cells that project to layer I, we placed small pieces of filter paper infused with CTB-488 on the surface of V1 (Fig. 8A); in the same animals, we placed virus injections in the SC (Fig. 8B) to label TG terminals. In cases in which there was no damage to the cortex surface and the placement of the tracer was confined to the most superficial layers (Fig. 8A), dLGN cells labeled by retrograde transport were confined to the dorsolateral shell, overlapping the distribution of TG terminals (Fig. 8C). This corresponds with a previous study in which tracer or virus injections confined to the superficial layers of V1 labeled cells in the dorsolateral shell (Cruz-Martín et al., 2014). To determine whether layer I projecting cells receive direct input from the SC, we repeated these dual tracing experiments and then prepared the tissue for acute in vitro electrophysiology. Using only cases in which we confirmed that the cortex was not damaged by our CTB placement, we targeted our recordings to CTB-488-labeled dLGN cells using epifluorescence to guide the placement of our pipettes and then activated the TG terminals using blue light pulses. As expected, layer I projecting cells displayed W-like morphology (Fig. 8D) and responded to light activation of TG input (E).
Figure 8.

Tectorecipient dLGN neurons project to V1 layer I. A–C, CTB-488-infused filter paper applied to layer I of V1 (A) paired with viral vector injections in the SC (B) resulted in the retrograde labeling of dLGN cells (C, green) in regions of the dLGN innervated by tectal terminals (C, red). D, E, CTB-labeled cells (D, green) filled with biocytin (red) responded to photoactivation of surrounding tectogeniculate terminals with large-amplitude EPSCs that exhibited frequency-dependent depression (E). LPN, Lateral posterior nucleus. Scale bars: A–C, 100 μm; D, 20 μm.
Finally, to identify the V1 synaptic targets of TG-recipient neurons, we placed BDA injections in the dLGN (Fig. 9A, inset) to label geniculocortical terminals (A) and examined the layer I projections (A, arrows; B) in tissue processed for electron microscopy. This tissue was also stained with an antibody against GABA. Although layer I contains a high density of GABAergic neurons (Ma et al., 2013), virtually all dLGN projections within layer I of V1 contacted non-GABAergic dendrites (85 of 87 synaptic contacts, or 98%; Fig. 9C). Thus, TG projections likely influence the activity of lower-layer excitatory spiny cells, which extend their apical dendritic tufts within layer I of V1.
Figure 9.
Synaptic targets of dLGN projections to V1 layer I. A, B, Injections of BDA in the dLGN (A, inset) labeled terminals that were distributed primarily in layer IV of V1 (A), but also innervated layer I of V1 (A, arrows; B). C, Electron microscopic analysis of BDA-labeled geniculocortical terminals in layer I of V1 indicated that the majority (98%) of these terminals contact (arrows) non-GABAergic dendrites (pink). LPN, Lateral posterior nucleus. Scale bars: A, inset, 100 μm; B, 10 μm; C, 0.5 μm.
Discussion
The mouse dLGN contains at least two functional subdivisions: the core and its surrounding dorsolateral shell (Dhande and Huberman, 2014). Our results, combined with those of previous studies, indicate that the circuits formed by these two zones are fundamentally different (Fig. 10). Within the core, neurons exhibit X- or Y-like morphology (i.e., biconical or symmetrical dendritic fields; Krahe et al., 2011) and project to layer IV of V1, whereas neurons in the shell exhibit W-like morphology (hemispheric dendritic arbors) and project to layer I of V1 (Krahe et al., 2011; Cruz-Martín et al., 2014). Moreover, although both core and shell neurons receive cortical input on their distal dendrites, the innervation of their proximal dendrites is quite distinct. The proximal dendrites of core neurons are innervated by non-direction-selective ganglion cells (Huberman et al., 2008; Bickford et al., 2010; Kim et al., 2010; Kay et al., 2011), which drive center-surround receptive field properties (Piscopo et al., 2013). In contrast, the proximal dendrites of shell neurons receive convergent input from both direction-selective ganglion cells (Huberman et al., 2009; Kay et al., 2011; Rivlin-Etzion et al., 2011; Dhande et al., 2013; Cruz-Martín et al., 2014) and the SC. Presumably, the integration of these two inputs underlies emergent direction-selective properties of dorsolateral shell neurons (Marshel et al., 2012; Piscopo et al., 2013; Scholl et al., 2013; Zhao et al., 2013).
Figure 10.

Distinct functional circuits in the dLGN core and shell. The summary diagram depicts the circuits of the dLGN shell revealed in the current study on the left side, and the circuits of the dLGN core revealed in previous studies on the right side. The core contains cells that display “X-like” and “Y-like” morphology (Krahe et al., 2011). These neurons receive input from V1 (gray, RS) on their distal dendrites and input from non-direction-selective (non-DS) retinal ganglion cells (green, RLP) on their proximal dendrites, which drive center-surround receptive field properties (Huberman et al., 2008; Bickford et al., 2010; Kim et al., 2010; Kay et al., 2011; Piscopo et al., 2013). Core cells project to layer IV of VI (Cruz-Martín et al., 2014). The shell contains cells that display “W-like” morphology. Like core neurons, shell neurons receive input from the cortex (gray, RS) on their more distal dendrites, but their proximal dendrites are innervated by convergent input from direction-selective (DS) retinal ganglion cells (blue, RLP; Cruz-Martín et al., 2014), as well as the superior colliculus (red, RM). Presumably, the integration of DS retinal and SC inputs underlies emergent direction-selective properties of dorsolateral shell neurons (Marshel et al., 2012; Piscopo et al., 2013; Scholl et al., 2013; Zhao et al., 2013). Shell neurons project to layer I [current results as well as those of Cruz-Martín et al. (2014)], where they contact the dendrites of non-GABAergic pyramidal cells.
The concept of driver inputs was defined based on the properties of RG terminals in regions homologous to the core of mouse dLGN (i.e., the A laminae of the cat dLGN; Sherman and Guillery, 1998). Inputs that can be classified as drivers are (1) large terminal profiles that synapse on proximal dendrites, (2) inputs that elicit fast primarily ionotropic glutamate transmission, and (3) inputs that when stimulated repetitively exhibit a high probability of glutamate release and synaptic depression (Guillery and Sherman, 2002; Li et al., 2003a,b). TG inputs exhibit many features of driver terminals. We found that these inputs are relatively large profiles that are located on proximal regions of the dendrites and display robust, fast excitatory transmission and synaptic depression. The similarities between RG and TG inputs suggest that in the dorsolateral shell, two driver-like inputs converge on single thalamocortical relay cells.
However, we use the term “driver-like” to describe converging TG and RG inputs with the proviso that such convergence contradicts the idea that each thalamic neuron is driven by one source of input, while all remaining inputs modulate this primary response (Sherman and Guillery, 1998). Similar examples of driver-like convergence illustrate the complexity of thalamic organization. The dorsal thalamus may be divided not only into “first order” (driven by ascending peripheral input) or “higher order” (driven by descending cortical input) nuclei (Guillery and Sherman, 2002), but also “second order” nuclei driven by convergent, ascending inputs (Kelly et al., 2003; Smith et al., 2007; Chomsung et al., 2008; Masterson et al., 2009, 2010), or nuclei that contain unique combinations of ascending and descending driver-like inputs (Baldauf et al., 2005a,b; Rovó et al., 2012; Groh et al., 2014). Such diversity may dramatically increase the computational capabilities of the thalamus, reflecting its essential roles in sensory, motor, and sensory-motor circuits.
In the dLGN shell, the convergence of RG and TG inputs may be necessary to calculate the trajectory of visual stimuli in relation to movement of the eyes. In vitro studies of the SC indicate that tectothalamic cells in the superficial layers of the SC are disynaptically inhibited by deeper-layer premotor cells that innervate intrinsic GABAergic interneurons (Phongphanphanee et al., 2011). This circuit has been proposed to underlie “saccadic suppression,” the attenuation of visual signals that occurs during the execution of eye or body movements to prevent blurring of the visual field. Alternatively, we suggest that this circuit could be used to adjust TG signals to reflect the direction and amplitude of impending body movements. In other words, TG inputs could be thought of as “backseat drivers” that alert shell neurons to movement commands generated by the superior colliculus. The resultant changes in the amplitude and/or timing of TG inputs could alter the response properties of dorsolateral shell neurons to reflect the contributions of self-generated and externally generated movement (for discussion of similar circuits, see Sommer and Wurtz, 2008). Thus, while silencing TG inputs in anesthetized animals may have relatively subtle effects on the receptive field properties of dLGN neurons (Xue et al., 1994), we predict that in behaving animals, TG inputs may strongly influence the manner in which neurons in the dorsolateral shell respond to moving visual stimuli.
Using calcium imaging techniques, Cruz-Martín et al. (2014) demonstrated that geniculocortical axons in the superficial layers of mouse V1 exhibit direction-selective responses, and our study indicates that these axons synapse on non-GABAergic dendrites. This arrangement suggests that tectorecipient dorsolateral shell neurons target the apical dendrites of neurons located in the deeper cortical layers of V1 (Fig. 10). Thus, V1 neurons may inherit direction selectivity not only via DSGCs (Cruz-Martín et al., 2014), but also from a driver-like circuit that originates in the SC.
Footnotes
This work was supported by National Institutes of Health Grants EY012716, EY022871, EY016155, EY021016, and GM103507. We thank Mr. Arkadiusz Slusarczyk for his excellent technical assistance, Drs. Rana El-Danaf and Tania Seabrook for their assistance with preliminary data collection, and Heather Jones her help in preparing the summary figure.
The authors declare no competing financial interests.
References
- Anderson JC, da Costa NM, Martin KA. The W cell pathway to cat primary visual cortex. J Comp Neurol. 2009;516:20–35. doi: 10.1002/cne.22085. [DOI] [PubMed] [Google Scholar]
- Baldauf ZB, Wang XP, Wang S, Bickford ME. Pretectotectal pathway: an ultrastructural quantitative analysis in cats. J Comp Neurol. 2003;464:141–158. doi: 10.1002/cne.10792. [DOI] [PubMed] [Google Scholar]
- Baldauf ZB, Chomsung RD, Carden WB, May PJ, Bickford ME. Ultrastructural analysis of projections to the pulvinar nucleus of the cat. I: Middle suprasylvian gyrus (areas 5 and 7) J Comp Neurol. 2005a;485:87–107. doi: 10.1002/cne.20480. [DOI] [PMC free article] [PubMed] [Google Scholar]
- Baldauf ZB, Wang S, Chomsung RD, May PJ, Bickford ME. Ultrastructural analysis of projections to the pulvinar nucleus of the cat. II: Pretectum. J Comp Neurol. 2005b;485:108–126. doi: 10.1002/cne.20487. [DOI] [PMC free article] [PubMed] [Google Scholar]
- Bickford ME, Ramcharan E, Godwin DW, Erişir A, Gnadt J, Sherman SM. Neurotransmitters contained in the subcortical extraretinal inputs to the monkey lateral geniculate nucleus. J Comp Neurol. 2000;424:701–717. doi: 10.1002/1096-9861(20000904)424:4&lt%3B701::AID-CNE11&gt%3B3.0.CO%3B2-B. [DOI] [PubMed] [Google Scholar]
- Bickford ME, Slusarczyk A, Dilger EK, Krahe TE, Kucuk C, Guido W. Synaptic development of the mouse dorsal lateral geniculate nucleus. J Comp Neurol. 2010;518:622–635. doi: 10.1002/cne.22223. [DOI] [PMC free article] [PubMed] [Google Scholar]
- Casagrande VA, Yazar F, Jones KD, Ding Y. The morphology of the koniocellular axon pathway in the macaque monkey. Cereb Cortex. 2007;17:2334–2345. doi: 10.1093/cercor/bhl142. [DOI] [PubMed] [Google Scholar]
- Chomsung RD, Petry HM, Bickford ME. Ultrastructural examination of diffuse and specific tectopulvinar projections in the tree shrew. J Comp Neurol. 2008;510:24–46. doi: 10.1002/cne.21763. [DOI] [PMC free article] [PubMed] [Google Scholar]
- Chomsung RD, Wei H, Day-Brown JD, Petry HM, Bickford ME. Synaptic organization of connections between the temporal cortex and pulvinar nucleus of the tree shrew. Cereb Cortex. 2010;20:997–1011. doi: 10.1093/cercor/bhp162. [DOI] [PMC free article] [PubMed] [Google Scholar]
- Cruz-Martín A, El-Danaf RN, Osakada F, Sriram B, Dhande OS, Nguyen PL, Callaway EM, Ghosh A, Huberman AD. A dedicated circuit links direction-selective retinal ganglion cells to the primary visual cortex. Nature. 2014;507:358–361. doi: 10.1038/nature12989. [DOI] [PMC free article] [PubMed] [Google Scholar]
- Cucchiaro JB, Bickford ME, Sherman SM. A GABAergic projection from the pretectum to the dorsal lateral geniculate nucleus in the cat. Neuroscience. 1991;41:213–226. doi: 10.1016/0306-4522(91)90211-6. [DOI] [PubMed] [Google Scholar]
- Datskovskaia A, Carden WB, Bickford ME. Y retinal terminals contact interneurons in the cat dorsal lateral geniculate nucleus. J Comp Neurol. 2001;430:85–100. doi: 10.1002/1096-9861(20010129)430:1&lt%3B85::AID-CNE1016&gt%3B3.0.CO%3B2-K. [DOI] [PubMed] [Google Scholar]
- Dhande OS, Huberman AD. Retinal ganglion cell maps in the brain: implications for visual processing. Curr Opin Neurobiol. 2014;24:133–142. doi: 10.1016/j.conb.2013.08.006. [DOI] [PMC free article] [PubMed] [Google Scholar]
- Dhande OS, Estevez ME, Quattrochi LE, El-Danaf RN, Nguyen PL, Berson DM, Huberman AD. Genetic dissection of retinal inputs to brainstem nuclei controlling image stabilization. J Neurosci. 2013;33:17797–17813. doi: 10.1523/JNEUROSCI.2778-13.2013. [DOI] [PMC free article] [PubMed] [Google Scholar]
- Diamond IT, Conley M, Fitzpatrick D, Raczkowski D. Evidence for separate pathways within the tecto-geniculate projection in the tree shrew. Proc Natl Acad Sci U S A. 1991;88:1315–1319. doi: 10.1073/pnas.88.4.1315. [DOI] [PMC free article] [PubMed] [Google Scholar]
- Dräger UC. Receptive fields of single cells and topography in mouse visual cortex. J Comp Neurol. 1975;160:269–290. doi: 10.1002/cne.901600302. [DOI] [PubMed] [Google Scholar]
- Dräger UC, Hubel DH. Topography of visual and somatosensory projections to mouse superior colliculus. J Neurophysiol. 1976;39:91–101. doi: 10.1152/jn.1976.39.1.91. [DOI] [PubMed] [Google Scholar]
- Erişir A, Van Horn SC, Sherman SM. Relative numbers of cortical and brainstem inputs to the lateral geniculate nucleus. Proc Natl Acad Sci U S A. 1997;94:1517–1520. doi: 10.1073/pnas.94.4.1517. [DOI] [PMC free article] [PubMed] [Google Scholar]
- Gale SD, Murphy GJ. Distinct representation and distribution of visual information by specific cell types in mouse superficial superior colliculus. J Neurosci. 2014;34:13458–13471. doi: 10.1523/JNEUROSCI.2768-14.2014. [DOI] [PMC free article] [PubMed] [Google Scholar]
- Govindaiah G, Wang T, Gillette MU, Cox CL. Activity-dependent regulation of retinogeniculate signaling by metabotropic glutamate receptors. J Neurosci. 2012;32:12820–12831. doi: 10.1523/JNEUROSCI.0687-12.2012. [DOI] [PMC free article] [PubMed] [Google Scholar]
- Groh A, Bokor H, Mease RA, Plattner VM, Hangya B, Stroh A, Deschenes M, Acsády L. Convergence of cortical and sensory driver inputs on single thalamocortical cells. Cereb Cortex. 2014;24:3167–3179. doi: 10.1093/cercor/bht173. [DOI] [PMC free article] [PubMed] [Google Scholar]
- Grubb MS, Thompson ID. Biochemical and anatomical subdivision of the dorsal lateral geniculate nucleus in normal mice and in mice lacking the beta2 subunit of the nicotinic acetylcholine receptor. Vision Res. 2004;44:3365–3376. doi: 10.1016/j.visres.2004.09.003. [DOI] [PubMed] [Google Scholar]
- Guillery RW. The organization of synaptic interconnections in the laminae of the dorsal lateral geniculate nucleus of the cat. Z Zellforsch Mikrosk Anat. 1969;96:1–38. doi: 10.1007/BF00321474. [DOI] [PubMed] [Google Scholar]
- Guillery RW, Sherman SM. Thalamic relay functions and their role in corticocortical communication: generalizations from the visual system. Neuron. 2002;33:163–175. doi: 10.1016/S0896-6273(01)00582-7. [DOI] [PubMed] [Google Scholar]
- Hamos JE, Van Horn SC, Raczkowski D, Uhlrich DJ, Sherman SM. Synaptic connectivity of a local circuit neurone in lateral geniculate nucleus of the cat. Nature. 1985;317:618–621. doi: 10.1038/317618a0. [DOI] [PubMed] [Google Scholar]
- Harting JK, Huerta MF, Hashikawa T, van Lieshout DP. Projection of the mammalian superior colliculus upon the dorsal lateral geniculate nucleus: organization of tectogeniculate pathways in nineteen species. J Comp Neurol. 1991;304:275–306. doi: 10.1002/cne.903040210. [DOI] [PubMed] [Google Scholar]
- Hendry SH, Yoshioka T. A neurochemically distinct third channel in the macaque dorsal lateral geniculate nucleus. Science. 1994;264:575–577. doi: 10.1126/science.8160015. [DOI] [PubMed] [Google Scholar]
- Huberman AD, Manu M, Koch SM, Susman MW, Lutz AB, Ullian EM, Baccus SA, Barres BA. Architecture and activity-mediated refinement of axonal projections from a mosaic of genetically identified retinal ganglion cells. Neuron. 2008;59:425–438. doi: 10.1016/j.neuron.2008.07.018. [DOI] [PMC free article] [PubMed] [Google Scholar]
- Huberman AD, Wei W, Elstrott J, Stafford BK, Feller MB, Barres BA. Genetic identification of an On-Off direction-selective retinal ganglion cell subtype reveals a layer-specific subcortical map of posterior motion. Neuron. 2009;62:327–334. doi: 10.1016/j.neuron.2009.04.014. [DOI] [PMC free article] [PubMed] [Google Scholar]
- Inayat S, Barchini J, Chen H, Feng L, Liu X, Cang J. Neurons in the most superficial lamina of the mouse superior colliculus are highly selective for stimulus direction. J Neurosci. 2015;35:7992–8003. doi: 10.1523/JNEUROSCI.0173-15.2015. [DOI] [PMC free article] [PubMed] [Google Scholar]
- Jurgens CW, Bell KA, McQuiston AR, Guido W. Optogenetic stimulation of the corticothalamic pathway affects relay cells and GABAergic neurons differently in the mouse visual thalamus. PLoS One. 2012;7:e45717. doi: 10.1371/journal.pone.0045717. [DOI] [PMC free article] [PubMed] [Google Scholar]
- Kay JN, De la Huerta I, Kim IJ, Zhang Y, Yamagata M, Chu MW, Meister M, Sanes JR. Retinal ganglion cells with distinct directional preferences differ in molecular identity, structure, and central projections. J Neurosci. 2011;31:7753–7762. doi: 10.1523/JNEUROSCI.0907-11.2011. [DOI] [PMC free article] [PubMed] [Google Scholar]
- Kelly LR, Li J, Carden WB, Bickford ME. Ultrastructure and synaptic targets of tectothalamic terminals in the cat lateral posterior nucleus. J Comp Neurol. 2003;464:472–486. doi: 10.1002/cne.10800. [DOI] [PubMed] [Google Scholar]
- Kielland A, Erisir A, Walaas SI, Heggelund P. Synapsin utilization differs among functional classes of synapses on thalamocortical cells. J Neurosci. 2006;26:5786–5793. doi: 10.1523/JNEUROSCI.4631-05.2006. [DOI] [PMC free article] [PubMed] [Google Scholar]
- Kim IJ, Zhang Y, Meister M, Sanes JR. Laminar restriction of retinal ganglion cell dendrites and axons: subtype-specific developmental patterns revealed with transgenic markers. J Neurosci. 2010;30:1452–1462. doi: 10.1523/JNEUROSCI.4779-09.2010. [DOI] [PMC free article] [PubMed] [Google Scholar]
- Krahe TE, El-Danaf RN, Dilger EK, Henderson SC, Guido W. Morphologically distinct classes of relay cells exhibit regional preferences in the dorsal lateral geniculate nucleus of the mouse. J Neurosci. 2011;31:17437–17448. doi: 10.1523/JNEUROSCI.4370-11.2011. [DOI] [PMC free article] [PubMed] [Google Scholar]
- Lachica EA, Casagrande VA. The morphology of collicular and retinal axons ending on small relay (W-like) cells of the primate lateral geniculate nucleus. Vis Neurosci. 1993;10:403–418. doi: 10.1017/s0952523800004648. [DOI] [PubMed] [Google Scholar]
- Li J, Wang S, Bickford ME. Comparison of the ultrastructure of cortical and retinal terminals in the rat dorsal lateral geniculate and lateral posterior nuclei. J Comp Neurol. 2003a;460:394–409. doi: 10.1002/cne.10646. [DOI] [PubMed] [Google Scholar]
- Li J, Guido W, Bickford ME. Two distinct types of corticothalamic EPSPs and their contribution to short-term synaptic plasticity. J Neurophysiol. 2003b;90:3429–3440. doi: 10.1152/jn.00456.2003. [DOI] [PubMed] [Google Scholar]
- Marshel JH, Kaye AP, Nauhaus I, Callaway EM. Anterior-posterior direction opponency in the superficial mouse lateral geniculate nucleus. Neuron. 2012;76:713–720. doi: 10.1016/j.neuron.2012.09.021. [DOI] [PMC free article] [PubMed] [Google Scholar]
- Masterson SP, Li J, Bickford ME. Synaptic organization of the tectorecipient zone of the rat lateral posterior nucleus. J Comp Neurol. 2009;515:647–663. doi: 10.1002/cne.22077. [DOI] [PMC free article] [PubMed] [Google Scholar]
- Masterson SP, Li J, Bickford ME. Frequency-dependent release of substance P mediates heterosynaptic potentiation of glutamatergic synaptic responses in the rat visual thalamus. J Neurophysiol. 2010;104:1758–1767. doi: 10.1152/jn.00010.2010. [DOI] [PMC free article] [PubMed] [Google Scholar]
- Ma J, Yao XH, Fu Y, Yu YC. Development of layer 1 neurons in the mouse neocortex. Cereb Cortex. 2013;24:2604–2618. doi: 10.1093/cercor/bht114. [DOI] [PubMed] [Google Scholar]
- Mooney RD, Klein BG, Rhoades RW. Correlations between the structural and functional characteristics of neurons in the superficial laminae and the hamster's superior colliculus. J Neurosci. 1985;5:2989–3009. doi: 10.1523/JNEUROSCI.05-11-02989.1985. [DOI] [PMC free article] [PubMed] [Google Scholar]
- Mooney RD, Nikoletseas MM, Ruiz SA, Rhoades RW. Receptive-field properties and morphological characteristics of the superior collicular neurons that project to the lateral posterior and dorsal lateral geniculate nuclei in the hamster. J Neurophysiol. 1988;59:1333–1351. doi: 10.1152/jn.1988.59.5.1333. [DOI] [PubMed] [Google Scholar]
- Phongphanphanee P, Mizuno F, Lee PH, Yanagawa Y, Isa T, Hall WC. A circuit model for saccadic suppression in the superior colliculus. J Neurosci. 2011;31:1949–1954. doi: 10.1523/JNEUROSCI.2305-10.2011. [DOI] [PMC free article] [PubMed] [Google Scholar]
- Piscopo DM, El-Danaf RN, Huberman AD, Niell CM. Diverse visual features encoded in mouse lateral geniculate nucleus. J Neurosci. 2013;33:4642–4656. doi: 10.1523/JNEUROSCI.5187-12.2013. [DOI] [PMC free article] [PubMed] [Google Scholar]
- Reese BE. “Hidden lamination” in the dorsal lateral geniculate nucleus: the functional organization of this thalamic region in the rat. Brain Res. 1988;472:119–137. doi: 10.1016/0165-0173(88)90017-3. [DOI] [PubMed] [Google Scholar]
- Rivlin-Etzion M, Zhou K, Wei W, Elstrott J, Nguyen PL, Barres BA, Huberman AD, Feller MB. Transgenic mice reveal unexpected diversity of on-off direction-selective retinal ganglion cell subtypes and brain structures involved in motion processing. J Neurosci. 2011;31:8760–8769. doi: 10.1523/JNEUROSCI.0564-11.2011. [DOI] [PMC free article] [PubMed] [Google Scholar]
- Robson JA, Hall WC. The organization of the pulvinar in the grey squirrel (Sciurus carolinensis). II. Synaptic organization and comparisons with the dorsal lateral geniculate nucleus. J Comp Neurol. 1977;173:389–416. doi: 10.1002/cne.901730211. [DOI] [PubMed] [Google Scholar]
- Robson JA, Mason CA. The synaptic organization of terminals traced from individual labeled retino-geniculate axons in the cat. Neuroscience. 1979;4:99–111. doi: 10.1016/0306-4522(79)90220-3. [DOI] [PubMed] [Google Scholar]
- Rovó Z, Ulbert I, Acsády L. Drivers of the primate thalamus. J Neurosci. 2012;32:17894–17908. doi: 10.1523/JNEUROSCI.2815-12.2012. [DOI] [PMC free article] [PubMed] [Google Scholar]
- Scholl B, Tan AY, Corey J, Priebe NJ. Emergence of orientation selectivity in the mammalian visual pathway. J Neurosci. 2013;33:10616–10624. doi: 10.1523/JNEUROSCI.0404-13.2013. [DOI] [PMC free article] [PubMed] [Google Scholar]
- Sherman SM, Guillery RW. On the actions that one nerve cell can have on another: distinguishing “drivers” from “modulators.”. Proc Natl Acad Sci U S A. 1998;95:7121–7126. doi: 10.1073/pnas.95.12.7121. [DOI] [PMC free article] [PubMed] [Google Scholar]
- Smith PH, Bartlett EL, Kowalkowski A. Cortical and collicular inputs to cells in the rat paralaminar thalamic nuclei adjacent to the medial geniculate body. J Neurophysiol. 2007;98:681–695. doi: 10.1152/jn.00235.2007. [DOI] [PubMed] [Google Scholar]
- Sommer MA, Wurtz RH. Brain circuits for the internal monitoring of movements. Annu Rev Neurosci. 2008;31:317–338. doi: 10.1146/annurev.neuro.31.060407.125627. [DOI] [PMC free article] [PubMed] [Google Scholar]
- Stanford LR, Friedlander MJ, Sherman SM. Morphology of physiologically identified W-cells in the C laminae of the cat's lateral geniculate nucleus. J Neurosci. 1981;1:578–584. doi: 10.1523/JNEUROSCI.01-06-00578.1981. [DOI] [PMC free article] [PubMed] [Google Scholar]
- Tamamaki N, Uhlrich DJ, Sherman SM. Morphology of physiologically identified retinal X and Y axons in the cat's thalamus and midbrain as revealed by intraaxonal injection of biocytin. J Comp Neurol. 1995;354:583–607. doi: 10.1002/cne.903540408. [DOI] [PubMed] [Google Scholar]
- Taniguchi H, He M, Wu P, Kim S, Paik R, Sugino K, Kvitsiani D, Kvitsani D, Fu Y, Lu J, Lin Y, Miyoshi G, Shima Y, Fishell G, Nelson SB, Huang ZJ. A resource of Cre driver lines for genetic targeting of GABAergic neurons in cerebral cortex. Neuron. 2011;71:995–1013. doi: 10.1016/j.neuron.2011.07.026. [DOI] [PMC free article] [PubMed] [Google Scholar]
- Waleszczyk WJ, Wang C, Benedek G, Burke W, Dreher B. Motion sensitivity in cat's superior colliculus: contribution of different visual processing channels to response properties of collicular neurons. Acta Neurobiol Exp (Wars) 2004;64:209–228. doi: 10.55782/ane-2004-1507. [DOI] [PubMed] [Google Scholar]
- Wang L, Sarnaik R, Rangarajan K, Liu X, Cang J. Visual receptive field properties of neurons in the superficial superior colliculus of the mouse. J Neurosci. 2010;30:16573–16584. doi: 10.1523/JNEUROSCI.3305-10.2010. [DOI] [PMC free article] [PubMed] [Google Scholar]
- Wang S, Bickford ME, Van Horn SC, Erisir A, Godwin DW, Sherman SM. Synaptic targets of thalamic reticular nucleus terminals in the visual thalamus of the cat. J Comp Neurol. 2001;440:321–341. doi: 10.1002/cne.1389. [DOI] [PubMed] [Google Scholar]
- Wang S, Eisenback M, Datskovskaia A, Boyce M, Bickford ME. GABAergic pretectal terminals contact GABAergic interneurons in the cat dorsal lateral geniculate nucleus. Neurosci Lett. 2002;323:141–145. doi: 10.1016/S0304-3940(01)02533-2. [DOI] [PubMed] [Google Scholar]
- Wei H, Masterson SP, Petry HM, Bickford ME. Diffuse and specific tectopulvinar terminals in the tree shrew: synapses, synapsins, and synaptic potentials. PLoS One. 2011;6:e23781. doi: 10.1371/journal.pone.0023781. [DOI] [PMC free article] [PubMed] [Google Scholar]
- Wilson JR, Friedlander MJ, Sherman SM. Fine structural morphology of identified X- and Y-cells in the cat's lateral geniculate nucleus. Proc R Soc Lond B Biol Sci. 1984;221:411–436. doi: 10.1098/rspb.1984.0042. [DOI] [PubMed] [Google Scholar]
- Xue JT, Kim CB, Moore RJ, Spear PD. Influence of the superior colliculus on responses of lateral geniculate neurons in the cat. Vis Neurosci. 1994;11:1059–1076. doi: 10.1017/s095252380000688x. [DOI] [PubMed] [Google Scholar]
- Zhao X, Chen H, Liu X, Cang J. Orientation-selective responses in the mouse lateral geniculate nucleus. J Neurosci. 2013;33:12751–12763. doi: 10.1523/JNEUROSCI.0095-13.2013. [DOI] [PMC free article] [PubMed] [Google Scholar]