

Abstract
INTRODUCTION
This paper reviews the work done in the ADNI PET core over the past 5 years, largely concerning techniques, methods, and results related to amyloid imaging in ADNI.
METHODS
The PET Core has utilized [18F]florbetapir routinely on ADNI participants, with over 1600 scans available for download. Four different laboratories are involved in data analysis, and have examined factors such as longitudinal florbetapir analysis, use of FDG-PET in clinical trials, and relationships between different biomarkers and cognition.
RESULTS
Converging evidence from the PET Core has indicated that cross-sectional and longitudinal florbetapir analyses require different reference regions. Studies have also examined the relationship between florbetapir data obtained immediately after injection, which reflects perfusion, and FDG-PET results. Finally, standardization has included the translation of florbetapir PET data to a centiloid scale.
CONCLUSION
The PET Core has demonstrated a variety of methods for standardization of biomarkers such as florbetapir PET in a multicenter setting.
INTRODUCTION
The ADNI PET core began life entirely focused on the use of metabolic brain imaging with [18F]fluorodeoxyglucose (FDG) PET as a potential surrogate outcome measure for use in clinical trials. Over time, the goals of the PET core have expanded and changed considerably, consonant with the overall goals of the ADNI project. A relatively early addition was the use of amyloid imaging with [11C]PIB; while this was done on a small scale it paved the way for the subsequent large scale addition of [18F]florbetapir amyloid PET imaging. The initial phase of the ADNI PET core was reviewed previously [1]. This review will cover work in the ADNI PET core since the addition of florbetapir imaging as part of the ADNI/GO project and continuing into ADNI2. This work includes both the continued acquisition of FDG-PET images, along with the addition of amyloid imaging. Current availability (as of early 2015) of PET scans in both of these modalities is shown in tables 1 and 2. The wealth of imaging data in ADNI, paired with other data that is part of ADNI (i.e., MRI, fluid biomarkers, cognitive measures) is clearly a major international resource for the study of Alzheimer’s disease.
Table 1.
Numbers of longitudinal FDG scans available at the University of Southern California Laboratory of Neuro Imaging (LONI) website as of Jan 13, 2015 are shown for each diagnostic group. Note that each cell represents scan number and not subject number, so some subjects are represented more than once in the table.
| Number of FDG Scans | Normal | SMC | EMCI | LMCI | AD | Total |
|---|---|---|---|---|---|---|
| 1 | 343 | 106 | 307 | 411 | 239 | 1406 |
| 2 | 258 | 0 | 167 | 279 | 112 | 816 |
| 3 | 93 | 0 | 2 | 181 | 75 | 351 |
| 4 | 85 | 0 | 0 | 162 | 58 | 305 |
| 5 | 72 | 0 | 0 | 146 | 0 | 218 |
| 6 | 39 | 0 | 0 | 105 | 0 | 144 |
| 7 | 25 | 0 | 0 | 56 | 0 | 81 |
| 8 | 5 | 0 | 0 | 28 | 0 | 33 |
| 9 | 0 | 0 | 0 | 5 | 0 | 5 |
|
| ||||||
| Total | 920 | 106 | 476 | 1373 | 484 | 3359 |
Table 2.
Numbers of longitudinal florbetapir scans available at the University of Southern California Laboratory of Neuro Imaging (LONI) website as of Jan 13, 2015 are shown for each diagnostic group. Note that each cell represents scan number and not subject number, so some subjects are represented more than once in the table.
| Number of Florbetapir Scans | Normal | SMC | EMCI | LMCI | AD | Total |
|---|---|---|---|---|---|---|
| 1 | 266 | 85 | 302 | 220 | 191 | 1064 |
| 2 | 197 | 0 | 199 | 135 | 48 | 579 |
| 3 | 13 | 0 | 20 | 9 | 4 | 46 |
|
| ||||||
| Total | 476 | 85 | 521 | 364 | 243 | 1689 |
The addition of amyloid imaging offered several new opportunities to investigators using ADNI data, which reflected the major new goals of this phase of the project. First, the collection of longitudinal amyloid imaging data offered the potential to examine rates of accumulation over time, and to see the variability in longitudinal measurements. This is particularly important for the use of amyloid PET as a biomarker in trials testing amyloid-lowering drugs, an approach begun with PIB [2] that is spreading to more widely available [18F] labeled tracers. Work in ADNI has pioneered in the development of new approaches to longitudinal florbetapir data analysis in order to reduce variability in measurement (reviewed below). Other major goals of amyloid imaging in ADNI include the assessment of whether and how brain amyloid deposition affects cognitive decline, and how PET amyloid may be related to other biomarkers including CSF measures of amyloid. Another major question is what factors should be used in selecting individuals for clinical trials – especially important as such trials move to earlier stages when cognitive and clinical assessments alone are less useful [3]. The use of amyloid PET, along with other biomarkers studied in ADNI, will be of greater importance in subject selection as therapeutic trials move earlier. Findings from studies addressing these goals are discussed in subsequent sections.
1. PET QC, image processing and quality control
[18F]Florbetapir imaging began at the start of ADNI-GO/2 after initial experience with [11C]PiB. Quality assurance/control procedures, as well as the image standardization and pre-processing steps for [18F]florbetapir are essentially the same as were used for [11C]PiB.
1.1 PET QA/QC
All subjects enrolled in ADNI-GO/2 received both [18F]FDG and [18F]florbetapir scans, with follow-ups at 2 and 4 years, although FDG-PET was discontinued in 2014 because of the extensive data already available. All PET images are downloaded from the Laboratory of Neuroimaging (LONI) in DICOM, ECAT, or Interfile formats. The QA/QC process consists of visual inspection as well as quantitative measures for all image sets. Visual inspection includes i) qualitative assessment of subject motion, ii) determination of whether the entire brain was included in the field-of-view, and iii) detection of artifacts arising from sources such as spatial mismatch between the transmission/CT and emission scans, or from detector and scanner normalization issues. Automated routines extract information from the image headers, which are checked for consistency with the PET acquisition and (scanner-specific) reconstruction protocols.
For each scan, the 5-min frames (6 for FDG acquired at 30-60 min post-injection, 4 for florbetapir, acquired 50-70 min post-injection) are co-registered to frame 1 (rigid-body translation/rotation, 6 degrees of freedom) using the NeuroStat “mcoreg” routine. The magnitude of motion between frames for the 3 translation and 3 rotation parameters is recorded and flagged when thresholds are exceeded. Global correlation and root mean square error (RMSE) are calculated pair-wise between all frames, both prior to and following co-registration. The correlation and RMSE matrices are inspected for frames that have low correlation and/or high RMSE. Both visual inspection and quantitative measures are used to fail frames. After co-registration, all frames are averaged into a single “static” frame. Both the realigned dynamic (pre-processed set 1), and averaged “static” images (pre-processed set 2) are converted to DICOM format and uploaded to LONI. These two pre-processed images sets remain in native-space.
1.2 Image standardization
Additional QC procedures are performed on all follow-up scans. Each subject’s baseline averaged-FDG image is oriented to a standard grid using the NeuroStat “stereo” routine. This orientation is based on the Talairach atlas [4]. Scans are written into a 160×160×96 grid with 1.5 mm3 voxels. This image set becomes the subject’s “FDG Standard”. The baseline averaged-florbetapir image is co-registered to the “FDG Standard” using NeuroStat’s “coreg” routine with a mutual-information cost-function. This co-registered set becomes the “AV Standard”. In order to process every scan in as similar a manner as possible, all frames of each original PET scan are co-registered to their corresponding “Standard” image: FDG to the “FDG Standard”, florbetapir to the “AV Standard”. The individual frames of each scan are averaged. This averaged scan is then normalized (intensity scaled). FDG scans are normalized using an iterative procedure such that the global mean of a masked image equals 1.0. In the first iteration, the entire image is scaled to a mean of 1.0. Successive iterations mask out voxel values <0.5, and the remaining voxels are rescaled to a mean of 1.0. This is repeated until the number of masked voxels becomes constant. Florbetapir images are normalized using an atlas-defined cerebellar gray matter reference region. These normalized images (preprocessed set 3) for each scan are uploaded to LONI. With this procedure, all individual frames are registered (hence interpolated) only once, yet yield a common orientation and image grid for all scans of each subject.
There are 20 PET-only or PET/CT scanner models from three vendors represented in the 57 sites participating in ADNI-GO/2. These have a large range of reconstructed resolutions; ~4-8 mm FWHM. To better compare scans across different centers, the ADNI PET core defined specific in-plane and axial smoothing kernels for each scanner model designed to achieve an isotropic resolution of 8 mm FWHM. The smoothing kernels were determined by comparing scans of the 3D-Hoffman brain phantom to a digital version of the phantom smoothed with an 8mm 3D-Gaussian filter. Each phantom scan was smoothed using different combinations of in-plane and axial filters (0.5 mm increments) and then compared to the smoothed digital phantom. The in-plane and axial smoothing-kernel pair that yielded the highest global correlation and lowest RMSE relative to the smoothed digital phantom was calculated for each scan. The median values across all scans for a given scanner model became that scanner’s smoothing-kernel pair. This pair was used to smooth the pre-processed image set 3 for all scans of that model, resulting in pre-processed set 4.
Co-registration and reorientation of all scans for a given subject to a common image grid (both FDG and florbetapir), not only provides more robust and consistent extraction of quantitative values, but also provides additional quantitative checks that have proven to be very valuable in the QC process. Using the image mask obtained from FDG normalization, the global correlation and RMSE are calculated between longitudinal scans (separately for FDG and florbetapir). Both global correlation and RMSE measures have proven to be sensitive for flagging problematic scans.
1.3 Pre-processed data sets
As described above, four sets of “pre-processed” PET images are uploaded to LONI, which allows different starting points for subsequent analyses. Pre-processed sets 1 and 2, as well as the original uploaded images, are in native space. Set 1 is the dynamic sequence of co-registered frames. Set 2 is the single-frame average of set 1.
Set 3 provides two additional steps of pre-processing: transformation into a standardized orientation and grid and intensity normalization (scaling) of the images. As described above, FDG scans are globally normalized, while florbetapir scans are normalized to cerebellar gray matter. Since intensity normalization is a simple scaling of the images, any subsequent analysis can “re-normalize” using any other reference. For example, cerebellar vermis or pons is often used to normalize FDG in MCI/AD, since those regions are affected least in these disorders. Similarly, florbetapir images can be rescaled using other reference regions such as pons, whole cerebellum, or white matter. Since all scans on a given subject have been co-registered, subsequent analyses can be performed without further manipulation of the images. A single set of VOIs, however defined, can be applied to all scans for that subject. To allow analysis of images at the highest possible resolution, set 3 is not smoothed, and though not optimal for across-site comparisons, within-subject analysis of longitudinal change can be performed. Preprocessed set 4 is exactly the same as set 3, except that scanner-specific smoothing has been applied. It should be pointed out that none of the pre-processed images sets have non-linear spatial warping. For automated analyses using group data in template space, such as those performed with SPM or NeuroStat, users will need to apply spatial normalization. Figure 1 demonstrates several of the QC and pre-processing steps for ADNI-GO/2 PET images.
Figure 1.
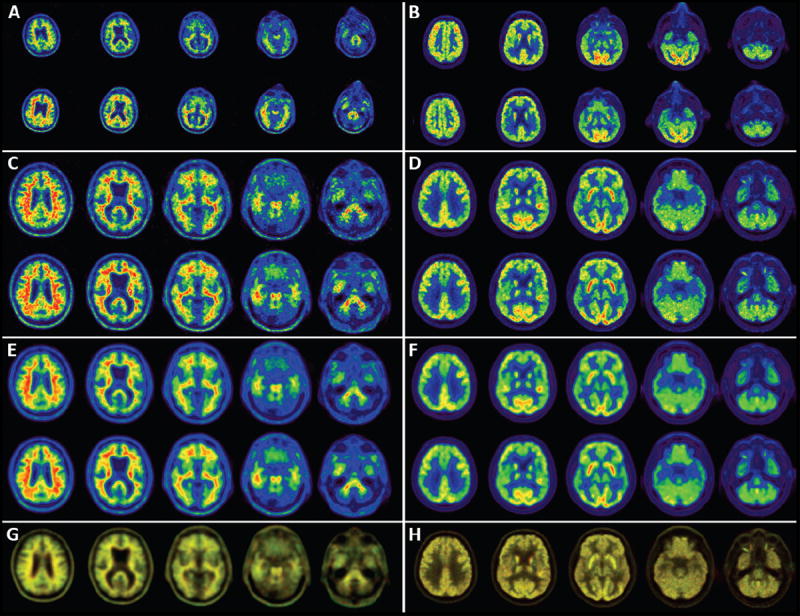
All panels on the left side of the figure are from one LMCI subject scanned with florbetapir on a PET-only Siemens ECAT-Exact HR+. Shown on the right are FDG images from a different LMCI subject scanned on a GE Discovery-STE PET/CT. Panels A-F show slices from two scans; baseline (top) and 2-year follow-up (bottom). Panels A and B show slices from pre-processed image set 2. These are “native-space” as seen by different head orientations for the baseline and 2-year scans. Different in-plane voxel-sizes for the HR+ (2.57 mm; A) and STE (2.0 mm; B) are apparent. The image intensities appear different, as the 2-year florbetapir scan had higher counts than at baseline, while the baseline FDG had slightly higher counts than the 2-year follow-up. Panels C and D show pre-processed image set 3, following co-registration to the standard orientation and intensity normalization (derived from A and B, respectively). Panels E and F show the pre-processed image set 4, following smoothing to 8 mm (derived from C and D, respectively). Panel G shows an overlay of the baseline image (in red) and the follow up image (in green) for the smoothed images from E, while panel H shows the overlay of the unsmoothed images from D. See text for full explanation of this overlay.
It is difficult to see quantitative changes over time from simple visual inspection alone of panels C-F. One of the final steps in the QC process is to display an overlay of baseline and follow-up images; baseline displayed in red, and follow-up in green. Where there is perfect correspondence between scans, the overlay appears with a yellowish hue. Any region that has higher values at baseline will appear reddish, while regions higher at follow-up will appear greenish. Note in panel G the greenish color of regions known to accumulate amyloid, indicating this subject’s amyloid burden increased over the 2-year period. Similarly, note in panel H the reddish colors in areas known to be affected metabolically in AD, indicating decreased glucose metabolic rate over time. The effects of tissue loss, hence increased CSF space between the heads of the caudate, are also readily seen. Visual overlay of all follow-up scans not only provides a sensitive means for a quick look for areas of longitudinal change, but has proven to be an effective way of detecting problems with scans; such as misalignment of images, problems with attenuation or scatter corrections, or asymmetry artifacts related to motion between the transmission/CT scan and the emission scan.
2. Florbetapir Imaging and ROI-based analysis
The availability of [18F] labeled, relatively long-lived positron emitting amyloid imaging agents has enabled the large-scale measurement of brain amyloid deposition in the typical ADNI subject groups: initially normal older controls, MCI, and AD, more recently those with subjective memory concern (SMC) and the addition of early MCI, (EMCI in contrast to “typical” MCI, now late or LMCI). SMC individuals perform within normal range but have a memory complaint, while EMCI subjects are similar to LMCI patients but have less severe memory deficits. Florbetapir, initially named AV45, is delivered to most ADNI sites, where participants undergo routine imaging. The image acquisition protocol is simple and straightforward: After injection of approximately 10 mCi as an intravenous bolus, subjects are seated and then scanned from 50-70 min after injection. Images are collected as a series of 4 × 5 min frames, and attenuation corrected with either CT or PET transmission. Participants also undergo FDG-PET according to the standard ADNI protocol of a 5 mCi injection and imaging from 30-60 min. Because both radiotracers use F18 labels, the scans must be done on 2 separate days. Since the initiation of florbetapir imaging, all ADNI participants have received florbetapir and FDG PET scans every 2 years, although longitudinal FDG scans were eliminated in late 2014 because of the extensive amount of data already available.
As has been the case since the initiation of FDG-PET in ADNI, after acquisition of PET images, all images transition through LONI to the University of Michigan, where they are checked for quality and pre-processed for analysis, as described above. The majority of scans pass QC; problems requiring re-scanning are extremely uncommon at this point as all sites are familiar with procedures. All scanners are specifically qualified for ADNI, a process that includes imaging a brain phantom to ascertain the smoothing characteristics for each individual scanner as described above; if a new scanner is brought online during ADNI the site is re-qualified. Scanner changes do occur and are unavoidable in any longitudinal multisite study. While this undoubtedly contributes to measurement noise, this factor has not yet been statistically quantified in the ADNI PET data.
These standardized images are the basis for the region-of-interest based analyses performed on both FDG-PET and florbetapir images at UC Berkeley. The methods used in data analysis of these images have been previously reported in a number of publications; FDG analyses including the template set of metaROIs was described in the 2010 ADNI PET update [1]. Florbetapir analyses use coregistered MRI images obtained at the baseline PET scan when available, which are segmented and parcellated using freesurfer 4.5.0 (surfer.nmr.mgh.harvard.edu). While use of a timepoint-specific MRI scan would be advantageous in accounting for longitudinal volume changes in definition of cortical ROIs for florbetapir analysis, we used the baseline scan only, since ROI definition changes might be due to image parcellation error and could contribute excessive longitudinally variability. Both UC Berkeley analyses involve use of the set 4 image data (common resolution) as described above. A composite cortical target reference ROI is created using a weighted average of the frontal, temporal, parietal, and cingulate regions regions that typically harbor β-amyloid, and a number of possible reference regions also provided including whole cerebellum which has been the usual ROI in most Berkeley-based ADNI SUVR cross-sectional analyses [5]. These approaches are documented in many publications and on the ADNI website where spreadsheets of all ROI data are also available.
3. Longitudinal florbetapir analyses
Because one of the key goals of ADNI is the assessment of longitudinal change in brain β-amyloid deposition, ADNI investigators began analyzing longitudinal florbetapir data as it became available. Table 2 indicates that of 1064 subjects with a baseline florbetapir scan, just over half (579, 54%) now have 2 florbetapir timepoints, while 46 (4%) have 3 scans. Analysis of 2-timepoint data acquired at a 2-year interval showed what appeared to be considerable variability, with some subjects demonstrating very large increases or decreases in tracer retention. These results, along with comparison to recent longitudinal amyloid PET analyses using PiB [6], [7] suggested that methodological changes might be necessary, and both the UC Berkeley and Banner groups simultaneously and independently began to investigate different ways of examining longitudinal change with a particular emphasis on how choice of a reference region affected the variability of longitudinal measures.
Landau et al [8] from Berkeley examined cortical florbetapir change calculated using 6 candidate reference regions (cerebellar grey matter, whole cerebellum, brainstem/pons, eroded subcortical white matter, and two additional combinations of these regions). There was poor agreement in the amount and direction of cortical change calculated using these reference regions. (For example, approximately 22% of subjects who were in the highest quartile of change when using a whole cerebellum reference region were in the lowest quartile of change when using a white matter reference region.) To determine which reference region(s) were most accurate, we evaluated them in a group of subjects expected to remain stable (Stable Aβ group) and a group of subjects expected to increase (Increasing Aβ group). To avoid biasing the results in favor of any particular reference region, we used concurrent CSF Aβ1-42 measurements and cognitive status rather than the florbetapir data itself to define these groups. We found that cortical florbetapir annual change was minimal (within 1-2%) across all reference regions Stable Aβ group. In the Increasing Aβ group, however, reference region selection had a strong influence on the observed cortical change. Reference regions containing eroded subcortical white matter (as opposed to cerebellum or pons) enabled detection of cortical change that was more physiologically plausible and more likely to increase over time.
In a somewhat different approach, Chen et al [9] (reviewed in more detail in section 4.2) the Banner group found that use of a reference region consisting of subcortical white matter substantially reduced the variability of longitudinal measures in subjects who were amyloid positive at baseline, thereby greatly increasing the power to detect both a change in the rate of Aβ accumulation or a reduction in brain Aβ. This topic has also been investigated by Brendel et al. [10] who examined the separate contributions of reference region selection and partial volume correction and found that use of both white matter reference region and partial volume correction resulted in reduced longitudinal variability and greater increases in subjects who were amyloid positive at baseline.
A considerable challenge in this work is the lack of longitudinal gold standard for evaluating candidate methodologies. Nonetheless, all three studies, each using a different strategy for evaluating methodologies, have converged on the finding that the optimal reference ROI for longitudinal florbetapir data analysis should include a large region of subcortical white matter, and that cerebellum as a single reference ROI for longitudinal studies is not optimal. These results are essentially empirical, but some post-hoc explanations have been suggested. This includes the possibility that differential placement of subjects from scan to scan results in cerebellar slices being at different positions in the axial field of view in the scanner, so that sensitivity and scatter may differ from scan to scan. White matter essentially provides a reference ROI in the same axial plane as the target ROI. Furthermore the large size of the subcortical white matter region may help optimize counting statistics. Whether the findings in this study generalize to other amyloid PET tracers is unknown, but should be tested if longitudinal data analysis is contemplated. In any case, this work has hopefully helped the goal of ADNI standardization by pointing to an important methodological development that will affect the design of clinical trials using longitudinal florbetapir PET measurement as an outcome.
It is important to note that the goals of ADNI, while ambitious in some respects, are limited in others. ADNI is designed to test and validate methods that can be applied to clinical trials of AD therapeutics. As such, the protocols are required to have relatively brief times for data collection and simple methods that can be applied at imaging centers with different levels of expertise. This inevitably involves compromises. We recognize, for example, that PET experiments that gather dynamic time-varying data, perhaps even including blood sampling, represent the “gold standard” for most imaging tracers. While PiB has previously been validated using this approach [11] other [18F] tracers including florbetapir have not been similarly validated. Thus the use of SUVRs with ADNI florbetapir data may substantially increase variability due to regional blood flow changes (both cross-sectionally and longitudinally) and other sources of error (such as a biased estimate compared with DVR values) that are introduced by sampling from 20 minutes of the entire dynamic dataset. While this may be a particular problem for longitudinal measurements, the approach represents what we consider to be a necessary compromise to have a protocol that can be widely employed in a multisite clinical trial.
4. Data analysis in PET core laboratories
Data analysis is performed in 4 PET core laboratories. In Berkeley, FreeSurfer-based cortical parcellation produces whole-brain measures of florbetapir uptake that has been used as both a continuous and dichotomous variable (i.e., amyloid positive or negative) in analyses. At the Banner Alzheimer’s Institute (BAI), investigators have used voxel-based approaches to classify subjects and examine relationships. In Utah, investigators have used stereotaxic surface projection (SSP), in which images are compared to normative data bases allowing a pixel-wise classification of images. In Pittsburgh, investigators have begun the process of converting PET florbetapir values obtained using standardized uptake value ratios (SUVRs) to a 100-point scale that has been defined as “centiloids” [12].
4.1 Data analysis in Berkeley
Berkeley uses a region of interest based approach to cross-sectional and longitudinal analysis of the FDG and florbetapir data, which is available in spreadsheet format on the ADNI website as described above. As of January 13, 2015 we have processed a total of 3359 FDG scans and 1689 florbetapir scans (Tables 1 and 2). 1406 subjects have had at least 1 baseline FDG scan, and 1064 subjects had at least 1 florbetapir scan. Berkeley analyses of this ever-growing dataset have addressed the inter-relationships between PET data and other biomarkers, cognitive change, and vascular disease.
4.1.1 Associations between amyloid biomarkers
A unique feature of the ADNI dataset is the availability of multiple markers of amyloid pathology (CSF Aβ, florbetapir PET, PiB-PET) within the same subjects. Starting in ADNI2, nearly all enrolled subjects received both a florbetapir PET scan and lumbar puncture, making it possible to examine the concordance between these different assessments of amyloid pathology. Concurrent florbetapir PET and CSF Aβ measurements were in agreement in 86% of 374 ADNI subjects [13]. We also observed fluctuations over time in 60 ADNI1 subjects who had longitudinal CSF Aβ measurements prior to a florbetapir scan, which was concordant with the final CSF Aβ measuremet in nearly all subjects. A more recent study has extended these findings in a larger sample size and shown that CSF Aβ and florbetapir are more likely to be discordant at earlier stages of disease [14]. Further, CSF Aβ was more closely related to ApoE4 status while florbetapir was more closely related to CSF tau measurements, supporting the idea that florbetapir and CSF Aβ contribute partially independent information.
We also examined relationships among amyloid PET tracers. Of ADNI1 subjects who received PiB-PET scans, 32 of these subjects (24 MCI and 8 normal at enrollment) were subsequently scanned with florbetapir during ADNI GO/2. Although the scans were not concurrent (the time interval between PiB and florbetapir scans was approximately 1.5 yrs), cortical PiB and florbetapir retention was highly correlated across several reference regions and processing methods. A key difference between tracers was that the dynamic range of SUVRs was lower for florbetapir compared with PiB. This PiB-florbetapir dataset was further explored in relationship to 40 subjects in a separate study who had concurrent scans using PiB and another F18 amyloid PET tracer, flutemetamol [15]. Again, relationships between cortical retention of PiB and each [18F] tracer were high across several reference regions and processing methods. Similar associations have been reported between PiB and the [18F] tracers flutemetamol [16] and florbetaben [17]. Importantly, both studies showed that positivity thresholds could be reliably converted between tracers and processing methods using the linear association across subjects. These ideas are further reflected in work developing the centiloid scale [12], and in the work accomplished by the University of Pittsburgh group, described in more detail below.
4.1.2 AD PET biomarkers and cognitive change
The availability of florbetapir PET data for characterizing amyloid status in ADNI GO/2 has made it possible to examine how biomarkers relate to cognitive function at different stages of disease. In 417 subjects with concurrent florbetapir and FDG scans, florbetapir was negatively associated with temporoparietal metabolism and positively correlated with ADAS-cog measurements, but only in early and late MCI groups [5]. 71 of these subjects had longitudinal cognitive measurements prior to the concurrent florbetapir and FDG scans, making it possible to examine the question of whether florbetapir or FDG was more closely related to retrospective or ongoing cognitive change. In normal subjects only, florbetapir was associated with cognitive change, whereas in the LMCI group, FDG was more closely associated with cognitive change than was florbetapir. This is consistent with a model in which amyloid changes precede neurodegeneration (measured by FDG), which is tied to subsequent cognitive decline. In another study, Berkeley investigators examined the rates of change of CSF Aβ, FDG-PET, hippocampal volume, and cognition, and found that CSF Aβ was more dynamic in normal controls, while glucose metabolism and hippocampal volume changed more in MCI and AD, with cognition changing most in AD patients [18]. This sequence of events is also consistent with the proposed pathological progression of AD that has been strongly influenced by ADNI data [19, 20]. Recent unpublished data has examined the association between APOE4 status and florbetapir across nearly the entire available baseline florbetapir dataset. Figure 2 illustrates the influence of ApoE4 status on florbetapir positivity across diagnostic groups. ApoE4 carriers had a higher rate of florbetapir positivity across all diagnoses, ranging from 50% in normals to nearly all (99%) of AD patients. The rate of positivity for ApoE4 noncarriers, however, ranged from only 26% (normals) to 60% (ADs). The considerable proportion of florbetapir negative, ApoE4 negative individuals suggests that a non-AD dementia (or other etiology) may explain the “AD-like” phenotype of many of these MCI and AD patients. The rate of amyloid-negativity in ADNI AD subjects is strikingly consistent with recent data from the bapineuzumab phase III trial [2].
Figure 2.
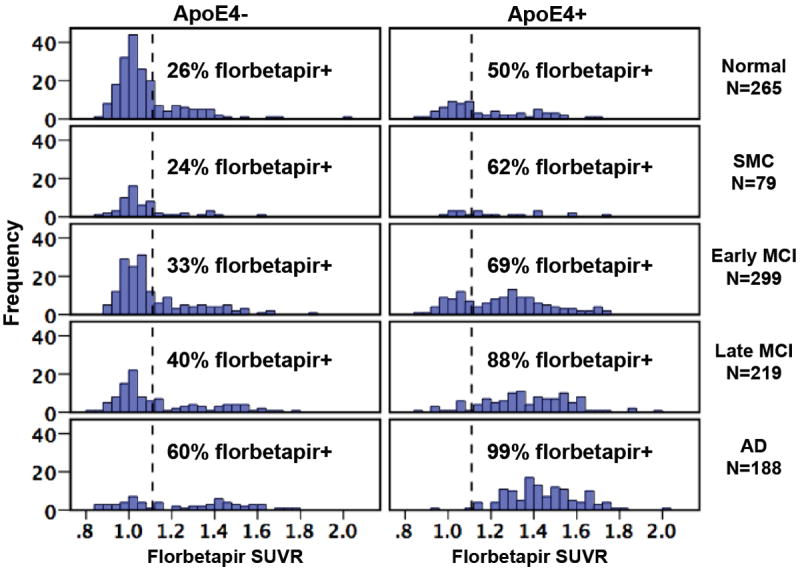
Frequency histograms for a total of 1050 ADNI subjects show the distribution of florbetapir cortical SUVRs by clinical diagnosis and stratified by APOE4 status. SUVRs were calculated using a whole cerebellum reference region, and the dotted vertical line shows the positivity threshold of 1.11 that has been previously validated [5].
4.1.3 Vascular disease and AD biomarkers
Although ADNI patients do not generally express severe levels of cerebrovascular disease, vascular risk has been examined in order to understand whether vascular disease influences AD-specific biomarkers and disease progression. Lo et al. found that cardiovascular risk scores and white matter hyperintensities were related to poor executive performance but were not related to change in AD biomarkers (CSF Aβ, FDG-PET, or hippocampal atrophy), suggesting that vascular disease does not directly influence AD-specific pathological processes [21]. Similarly, Haight et al. [22] found that white mater hyperintensity burden, a measure of vascular disease, was associated with lower frontal (but not temporoparietal) glucose metabolism in MCI patients who subsequently converted to AD. Higher CSF Aβ was associated with temporoparietal (but not frontal) hypometabolism in the same patients. This dissociative pattern suggests that vascular-based and amyloid-based mechanisms are linked to distinct pathways of neurodegeneration.
4.2 Data analysis at Banner Alzheimer’s Institute
As noted in the earlier ADNI review [1], BAI previously used FDG PET and related ADNI data to characterize cross-sectional rCMRgl reductions and to correlate rCMRgl reductions with categorical and continuous measurements of clinical disease severity in the aggregate probable AD dementia, MCI and NC group [23]. Banner investigators developed a hypometabolic convergence index (HCI) to characterize in a single summary metric the extent to which both the magnitude and spatial extent of cerebral glucose hypometabolism in a person’s FDG PET image corresponds to that in patients with probable AD dementia [24]. This work demonstrated that the HCI could distinguish between probable AD dementia, MCI and NC groups and predict subsequent progression from MCI to probable AD dementia, and that it could even better predict subsequent progression from MCI to probable AD dementia when used in conjunction with MRI hippocampal volumes [24]. BAI had also characterized longitudinal rCMRgl declines in the probable AD dementia and MCI groups, developed an empirically predefined statistical region-of-interest (sROI) strategy to optimize the power to track AD-related rCMRgl declines in a single measurement with improved power, and estimated the sample sizes needed to evaluate putative AD-modifying treatments in patients with probable AD dementia and MCI [25]. Sample sizes using FDG PET and our sROI method were roughly comparable to structural MRI [26]. With the growing availability of longitudinal florbetapir PET scans in ADNI, BAI and researchers from other labs (as noted above) have collaboratively and independently continued to develop, test and apply data analysis techniques with improved power to detect, classify and track AD, predict subsequent clinical progression and evaluate AD-modifying treatments in probable AD, MCI and NC sub-groups with and without a positive baseline Aβ PET scan, and in cognitively normal ApoE4 carriers and non-carriers irrespective of their baseline Aβ PET measurements. They have also begun to extend their methods and findings to data from other longitudinal cohorts and therapeutic trials and to help inform therapeutic trial design and sample sizes, as noted below.
4.2.1 Longitudinal florbetapir data analysis
BAI and its collaborators have begun to develop, test and apply data analysis strategies with improved power to track longitudinal changes in fibrillar amyloid-β (Aβ) deposition and evaluate Aβ-modifying treatments [9]. We and other investigators had noted greater than expected variability in longitudinal cerebral-to-reference region standard uptake volume ratios (SUVRs) using the cerebellar and pontine reference regions commonly used in cross-sectional measurements. Using baseline and 24-month follow-up florbetapir PET images from ADNI, we compared the power of template-based cerebellar, pontine, and a cerebral white matter reference regions to track SUVR increases and evaluate Aβ-modifying treatments in Aβ-positive and Aβ-negative probable AD dementia patients, mild cognitive impairment (MCI) patients, and cognitively normal controls (NCs) and in cognitively normal older adult ApoE4 carriers and non-carriers. The BAI template-based white matter reference region included voxels from corpus callosum and centrum semiovale, and excluded those voxels closest to gray matter and ventricles. In comparison with SUVRs using the other reference regions, SUVRs using cerebral white matter reference region were associated with significantly less variability, greater longitudinal Aβ increases, and greater power to evaluate Aβ-modifying treatment effects in Aβ+ AD, MCI, and NC subjects and cognitively normal ApoE4 carriers. Cerebral-to-white matter florbetapir SUVRs were also distinguished by the ability to detect significant associations between 24-month Aβ increases and clinical declines. Ongoing studies by BAI and others continue to clarify the extent to which the findings are generalizable to other Aβ PET tracers and more quantitative (e.g., DVR) measurements and influenced by differential effects of longitudinal or treatment-related brain shrinkage and partial-volume averaging on different cerebral and reference regions. Finding the most appropriate techniques for the analysis of longitudinal Aβ PET scans will have important implications for the size, design, analysis and interpretation of data from therapeutic trials of Aβ-modifying treatments. For instance, the white matter reference region was recently used to analyze data from a small Phase 2 biomarker trial of the passive Aβ immunization therapy crenezumab in Aβ-positive patients with probable AD dementia, helping to inform the investigational agents further development, dose and route of administration in Phase 3 trials.
4.2.2 Analysis of FDG-PET
BAI’s HCI and sROI methods continue to be used to analyze FDG PET data from ADNI and other longitudinal cohorts, and the sROI method continues to help to inform the size, design and planned analysis of FDG PET data from therapeutic trials. For instance, HCI was found in an analysis of ADNI and other data sets to be roughly comparable to two other summary metrics of AD-related cerebral hypometabolism (i.e., those generated from Berkeley’s meta-analytically derived ROIs [meta-ROI] and from the PMOD Technologies Alzheimer’s discrimination analysis [PALZ] tool) in the ability to distinguish between probable AD dementia, MCI and NC groups [27]. When the HCI method was used to analyze cross-sectional FDG PET data from cognitively unimpaired late-middle-aged ApoE4 homozygotes, heterozygotes, and non-carriers from the Arizona ApoE cohort, HCIs were significantly different in the three genetic groups and significantly associated ApoE 4 gene dose, despite substantial overlap among the groups [28]. While HCI appears to have some value in the study of preclinical AD, BAI continues to explore the use of more sensitive approaches, including an automatically labeled posterior cingulate region-of-interest approach, to detect and track preclinical AD in the Arizona ApoE Cohort Study and the Alzheimer Prevention Initiative (API) Biomarker Study of PEN1 E280A mutation carriers and non-carriers from the world’s largest autosomal dominant AD cohort [29, 30]. In expired ADNI participants who donated their brains, HCIs were highly predictive of subsequent AD pathology, whereas hypometabolism in additional occipital regions was highly predictive of co-morbid dementia with Lewy Bodies (DLB) pathology [31]. In cognitively normal adults from ADNI, measures of AD-related cerebral hypometabolism, including either HCIs or a posterior cingulate region-of-interest measurement, were less helpful than an MRI summary metric of early brain atrophy (SPARE-AD) and CSF p-tau/Aβ1-42 ratios in predicting subsequent progression to the clinical stages of AD [32].
BAI continues to assist other groups in the development and testing of new MRI and PET data analysis techniques using the ADNI dataset, and to help clarify their utility in the detection and tracking of AD, the prediction of subsequent clinical progression and the evaluation of AD-modifying treatments [33, 34]. ADNI methods and BAI data analysis techniques and findings continue to have a profound impact on the design and implication of therapeutic trials. In a 12-month proof-of-concept randomized clinical trial in 80 mild-to-moderate probable AD dementia patients, the PPAR-γ agonist rosiglitazone failed to slow either CMRgl decline in AD affected brain regions or clinical progression [35]. In a 24-week proof-of-concept randomized clinical trial of 22 mild-to-moderate probable AD dementia patients, memantine increased and/or reduced declines in both CMRgl in AD-affected regions and clinical performance [36]. Findings from these trials provide preliminary support for the potentially theragnostic value of FDG PET in clinical trials (i.e., the extent to which a treatment’s biomarker effects predict a clinical benefit). Larger and longer studies are needed to confirm these findings, extend them to earlier clinical and preclinical stages of AD, and help determine the extent to which FDG-PET should be qualified for use as a reasonably likely surrogate end point in the evaluation of putative AD-modifying treatments.
ADNI procedures, data analysis techniques and findings have also had a profound effect on API, including its preclinical AD biomarker development trials of investigational Aβ-modifying treatments in cognitively unimpaired 30-60 year-old members of Colombia’s PSEN1 E280A cohort and in cognitively unimpaired 60-75 year-old APOE4 homozygotes [37, 38]. The five year potentially license-enabling trials are intended to evaluate the treatments’ effects on the cognitive decline associated with preclinical AD, to clarify the extent to which a treatment’s 24-month effects on different brain imaging and CSF biomarkers are associated with a clinical benefit and provide evidence needed to support the relevant biomarker’s qualification for use as reasonably likely surrogate endpoints in future 24 month trials. These data will also provide a public resource of data and samples after the trials are over.
4.3 Data analysis at the University of Utah
The University of Utah laboratory analyzes images using Neurostat [39] to develop 3-dimensional stereotactic surface projection (3D-SSP) metabolic, amyloid binding and statistical maps that allow a visual comparison of individual and group data. These maps then define and calculate exploratory metrics that are sensitive to cognitive change. Submitted summary values are stereotactically defined and based upon regional peak surface values, regional volumetric values for subcortical structures, and topographic extent of abnormalities defined as values that are more than 2 and 3 standard deviations from those observed in cognitively normal subjects. This provides a metric to track progressive expansion of the cortical extent of hypometabolism over time.
4.3.1 Method development
Utah investigators have developed analysis methods using 3D-SSP to minimize scan-to-scan variability in longitudinal FDG-PET data. All scans in a single individual are co-registered to the initial visit image. These co-registered scans are then used to create a template for extracting values from directly comparable regions in each scan. This avoids the problem of having somewhat different regions defined in each scan when scans are analyzed independently. The values of reference regions change as data from multiple images in a subject become available. 3D-SSP values are reported relative to reference regions. Rather than using the value for a reference region from a single scan, the value is recalculated using data across all available scans. Consequently, the posted calculated summary values relative to a reference region change slightly as serial images are available for analysis. Measures of topographic extent also are adjusted.
Because gray matter cortical uptake may be lower than white matter uptake in amyloid images, it was necessary to address 4 main considerations: 1) to optimally extract the cortical amyloid values, 2) to define relevant regions of interest, 3) to select an appropriate reference region for intensity normalization that minimized within-subject variability in serial scans and yet was sensitive enough to capture small longitudinal changes in amyloid uptake and 4) to define a normal control group that Neurostat could use to compute statistical maps. Cortical amyloid values could be extracted by using Neurostat to co-register each amyloid scan with the concurrent FDG-PET scan. Atlas-based templates derived from co-registered FDG-PET images ensured that cortical values extracted from the amyloid scan were always derived from gray matter.
As noted above, the choice of reference region is complex and has frequently relied upon the cerebellum. We have found that normalizing with a reference value derived from white matter reduces the dispersion in cortical ROI values from a coefficient of variation of 14.6% using cerebellum to 9.6% using white matter. Thus, similar to other ADNI investigators, we have selected cerebral hemispheric white matter as a reference region and adapted Neurostat to select white matter pixel values in the cerebral hemispheres.
The final consideration in Neurostat analysis of amyloid PET data was defining a group of cognitively normal subjects with amyloid negative images that could be used for comparison with other groups and for individual scan analysis. This is critical if amyloid PET is to be used for subject selection in clinical drug trials. We used an iterative outlier approach for classifying cognitively normal subjects in ADNI into amyloid positive and negative groups. An amyloid negative subject had to have no outlier value in any of 7 medial and lateral cortical regions (parietal, temporal, frontal, occipital, posterior cingulate, anterior cingulate and sensorimotor cortex). We identified 173 subjects that met criteria for a negative amyloid scan based upon the white matter reference region and 168 subjects that met these criteria when cerebellar gray was used as a reference region. We used the values derived from the normal control group to calculate Z scores and generate 3D-SSP amyloid binding statistical maps. Consequently, for each individual we have posted two sets of amyloid biomarkers, one based upon the cerebellar reference region and the other based upon the cerebral hemispheric white matter reference region.
4.3.2 Early frame data reflecting perfusion
A substudy as part of ADNI2 collected the dynamic early frame data after injection of florbetapir in order to ascertain whether the perfusion information in these scans were similar to measures of glucose metabolism, as has been seen with [11C]PIB and smaller studies with florbetapir [40, 41]. Use of early frame data could theoretically provide useful functional information, obviating the need for FDG scans. Thus, in a subgroup of subjects, data were collected for the first 20 min after injection according to the time scheme 4 × 15 sec, 4 × 30 sec, 3 × 60 sec, 3 × 120 sec, 2 × 240 sec.
Utah investigators examined relationships between these early frame data and glucose metabolism in 22 cognitively normal subjects and 12 AD subjects. Visual analysis demonstrated comparable results with a highly similar topographic pattern of abnormalities on both tracer and in statistical z-score 3D-SSP images (Figure 3). The same regions, temporal and frontal lobes, that best discriminate between normal and AD subjects in FDG-PET scans also did so in early-phase florbetapir scans. Regional z-score and spatial extent measures were not statistically different with the two tracers. Within-subject correlations using all 102 ADNI subjects with concurrent FDG and early-phase florbetapir scans showed high positive correlations between early florbetapir and FDG on a within-subject pixelwise basis (r=0.82) and regional basis (parietal lobe r=0.67, temporal lobe r=0.71 and frontal lobe r=0.61). These data suggest that early florbetapir perfusion data might be able to substitute for FDG-PET, reducing the number of scans and radiation exposure.
Figure 3.
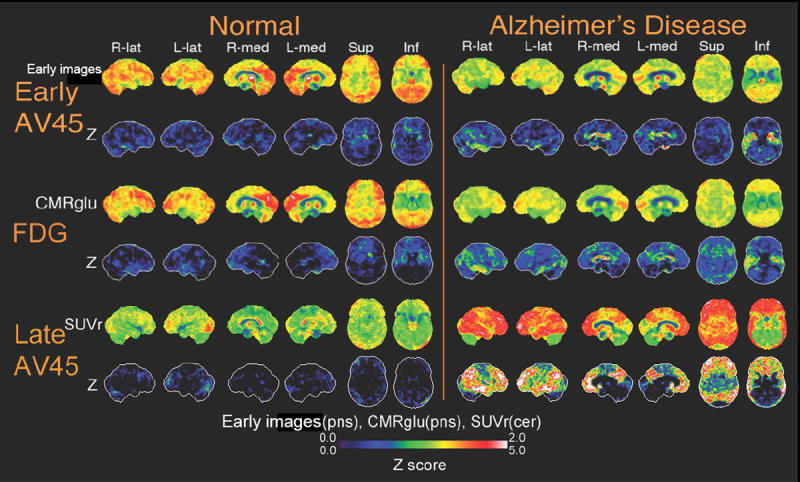
Neurostat SSP surface maps of uptake and Z scores for early phase florbetapir (0-20 min post-injection), FDG, and late phase florbetapir images (50-70 min post-injection) are shown comparing one normal subject and one AD subject. Early florbetapir cerebral blood flow rate is normalized to the pons value. FDG glucose metabolic rate is normalized to pons. Late florbetapir uptake value is normalized to the cerebellum. The normal subject shows few deficits in cerebral blood flow, metabolism and amyloid binding. The AD subject shows similar regions for deficits in cerebral blood flow and metabolism. The AD subject also shows significant accumulation of amyloid.
4.4 Data Analysis at the University of Pittsburgh
ADNI data analysis at Pittsburgh has been aimed at applying a scaling process similar to that described in the Centiloid (CL) project [12] to convert regional brain [18F]florbetapir standardized uptake value ratio (SUVR) outcomes to standardized units that will be referred to as approximate Centiloid units (aCU). This was based on the methods of Klunk and colleagues [12] that described standardization of PET amyloid-beta (Aβ) imaging outcomes using a linear 100-point CL scale that can be applied across sites and radiotracers. The basic CL hypothesis is that comparable results can be achieved across analysis techniques and tracers by linear scaling of the outcome data of any Aβ PET method to an average value of zero in “high-certainty” amyloid-negative subjects and to an average value of 100 in “typical” Alzheimer’s disease (AD) subjects. There are three possible CL analysis levels: Level-1, is the standard method for choosing subjects to define the 0-anchor and 100-anchor points for users to apply for all future scaling (performed only once in [12]); Level-2, can be used to calibrate a specific method to the CL scale (i.e., a site-specific [11C]-Pittsburgh Compound B (PiB) method outcome (or any other Aβ imaging method outcome) to a CL scale); and Level-3, can be performed to check processing pipeline results. In this work, a Level-2 analysis was used to convert the ADNI florbetapir SUVR data to approximate Centiloid units.
Two ADNI data sets were used in this work. The first was the PiB reference scaling data set of 24 subjects who were diagnosed as cognitively normal (n=5) or as mild cognitive impairment (MCI; n=19) with PiB SUVR > 1.5 (n=12) and PiB SUVR < 1.5 (n=12). These subjects were utilized because they had subsequent florbetapir PET scans acquired within 24 months following the PiB study. The second data set corresponded to 539 ADNI florbetapir PET studies for CL conversion that were acquired in subjects at various ADNI participant stages: 136 normal (76± 7 yrs), 2 MCI (84± 8 yrs), 119 EMCI (72± 8 yrs), 130 LMCI (74± 9 yrs), 66 with SCI (72± 5 yrs), and 86 AD (75± 9 yrs). These data were collected using Siemens HR+ at 6 sites, and GE Discovery-RX, Siemens HRRT, and GE Discovery-STE tomographs (each at a single site).
The image processing methods used herein were the same as those used in the CL publication [12]. The PiB and florbetapir PET data were averaged over frames corresponding to the 50-70 minute post-injection intervals and cortical SUVR values were determined for a global cortical ROI (CTX) using a whole cerebellar (WC) region-of-interest as reference region (these regions are available on the Global Alzheimer’s Association Interactive Network (GAAIN) website (http://gaain.org/datasets/). Statistical Parametric Mapping (SPM8) was used for image registration and spatial normalization, as previously described [12]. Briefly, the magnetic resonance (MR) and positron emission tomography (PET) image data were reoriented to match the MNI-152 MR template (2 mm resolution). Each subject’s MR image data were registered to the MNI template and the averaged PET data were then registered to the corresponding MRI. Spatial normalization was performed using the SPM8 unified method [42]. Further details of the registration and normalization methods is provided in Klunk et al. [12]. A general step-wise QC procedure was applied to each scan to evaluate image quality as described in section 1.
4.4.1 Conversion of ADNI florbetapir SUVR to approximate CL units (aCU)
Klunk et al. [12] determined anchor points for the 100-point CL scale, using PiB PET data acquired in a non-ADNI data set of 79 subjects (34 young control (YC) and 45 AD subjects) to define 0-anchor and 100-anchor points for all future scaling (Level-1 of CL process). The first step of the CL conversion process is the on-site processing of the Level-1 data (available on GAAIN website) to ensure that the on-site methods yield results consistent with those reported in [12], with inclusion of these results as supplemental data in the first such publication for that site. Members of the ADNI PET Core group (RAK, JCP) performed the Level-1 analysis using the same methods described herein (see 2.2.2.2 of [12]).
For the Level-2 analysis (florbetapir, notated as AV-45, SUVR to aCU conversion), the ADNI PiB SUVR data were used as the scaling reference (REF). In the first step (Eq. 1 below), a linear relationship was determined between the individual ADNI AV-45 SUVR ( ) and the ADNI PIB SUVR ( ) values in the reference data set (n=23), based on (Eq. 2.2.3.1a of [12]):
| (Eq. 1) |
The above equation was then rearranged and applied to calculate a “PiB-calibrated” SUVR value ( ) for the large AV-45 SUVR data set:
| (Eq. 2) |
The values were then converted to aCU based on the Level-1 linear equation that is the primary CL conversion equation (equivalent to Eq. 1.3.a. of [12]):
| (Eq. 3) |
where and are the Level-1 mean SUVR results for the 0-anchor and 100-anchor groups, respectively, that were published by Klunk and colleagues [12].
4.4.2 Results
There were 24 ADNI subjects with PiB and florbetapir scans acquired within 2 years, but only 23 were used for the reference scaling data set. One subject was excluded because the PiB scan had insufficient cerebellar coverage that would result in the WC reference region sampling voxels outside of the PET field-of-view (FOV).
Quality control of the large ADNI florbetapir conversion data set (n=539 studies) resulted in 29 failed studies. Twenty-four failed as a result of poor MRI normalization because significant meninges were classified as cortical tissue (i.e., leading to CTX ROI sampling of meninges), non-brain voxels classified as cerebellar tissue, severe pons/brainstem misalignment or a combination of these problems. Five others were not included because of inadequate brain coverage within the PET FOV and problematic sampling for the CTX (n=2) and WC (n=3) regions.
Figure 4A shows the strong linear relationship (R2=0.93) that was observed between the ADNI PiB (x-axis) and florbetapir (y-axis) reference data, with lower florbetapir SUVR (relative to PiB, slope ~0.59), consistent with prior observations [43]. The ADNI reference scaling PiB data ranged from about 0.9 to 2.4 SUVR units (median:1.2; mean:1.5) that was nearly the same range as that observed for the Level-1 anchor data (median:1.8; mean:1.6) in [12] (Fig. 4B). Results of the Level-2 analysis steps applied for conversion of the 510 ADNI florbetapir SUVR values are shown in Figure 4C. The measured ADNI florbetapir values (or ) ranged from 0.8 to 2.2 (median:1.2; mean:1.3) (Fig. 4C, left). The calculated “PiB calibrated” florbetapir values (or ) ranged from 0.8 to 2.9 (median:1.4; mean:1.5) with a large dynamic range (PiB-like), while the aCU range was -24 to +178 (median: 35; mean: 46). The aCU for the 23 ADNI PiB subjects ranged from -6 to 127 (median: 21; mean: 45).
Figure 4.
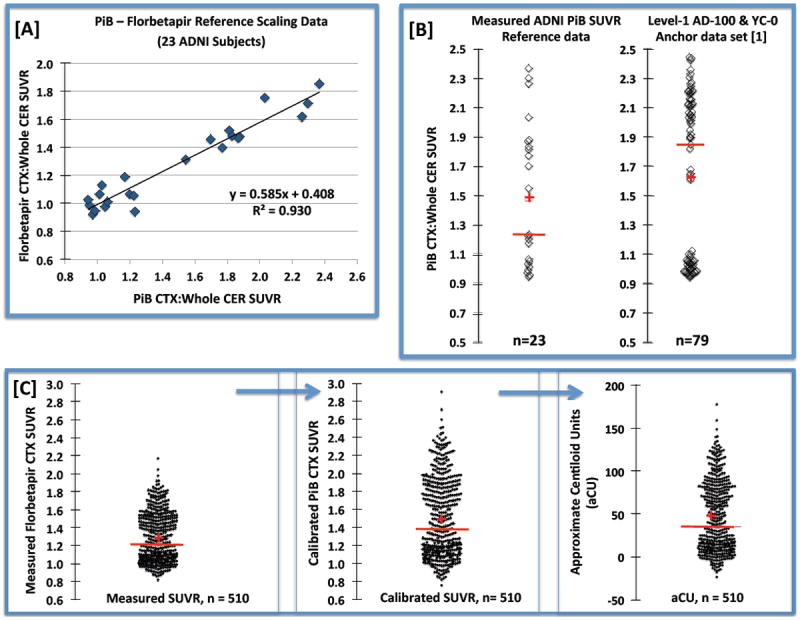
Example data for the approximate Centiloid scaling process. [A] Strong linearity was observed between the ADNI reference data acquired for 23 subjects who underwent PiB and florbetapir PET imaging within a 24-month interval. [B] Comparison of the distribution of PiB SUVR values observed for the ADNI reference data (left) and the Level-1 anchor data reported in [12] (right). [C] Distributions of the 510 measured ADNI florbetapir SUVR values (left), calculated “PiB-calibrated” florbetapir SUVR values (middle) and the converted approximate Centiloid units, or aCU (right). The median and mean are depicted, respectively, by the red bar and cross.
It is recommended that CL scaling be performed using PiB as the reference and the reference dataset consist of at least 25 subjects, including 10 that are cognitively normal (≤ 45 years) and highly likely to be Aβ-negative and 15 subjects that are highly likely to be Aβ-positive (with about 5 typical AD patients and 10 subjects likely to have intermediate PiB SUVR values). It was also recommended that the two reference PET studies be conducted within 3 months. Such a reference PiB-florbetapir dataset is not yet available. For the ADNI data presented here, PiB was used in the reference dataset, subjects were older than 45 years, the paired PiB-florbetapir reference scans were acquired within a 2-year interval, and the distribution of reference SUVR values included intermediate cases but no AD cases. The results of the florbetapir conversion appear to be consistent with results reported by Klunk and colleagues [12] despite these differences. The distribution of the 23 ADNI PiB SUVR reference values was similar to that observed for the Level-1 PiB anchoring dataset of 79 subjects [12]. After conversion of the ADNI florbetapir data, the aCU range for the 510 ADNI subjects (about -25 to +145) was consistent with the CL range of about -7 to +135 observed in the PiB anchoring data for 79 subjects. It is not surprising that the latter distribution was not as broad as that for the larger ADNI subject group.
The approximate Centiloid conversion process has proven to be feasible for a large cohort of florbetapir studies with a small technical failure rate of about 5% (29/539). A future goal is to complete this standardization for all possible ADNI florbetapir SUVR values over the next year and to compare these results to results obtained by other centers, as standardization is applied by the research field.
5. The future of the ADNI PET Core
The development of new imaging techniques has continued to accelerate since the widespread application of amyloid imaging in clinical research and therapeutic trials. For example, while not planned for use in ADNI, combined PET/MRI scanners could improve both patient throughput and the ability to account for blood flow effects on SUVRs cross-sectionally and longitudinally. A major advance in the past year includes the reporting of several radiotracers that bind to aggregated forms of tau with studies performed in humans [44-46]. Continued work aimed at validating these tracers is underway; each has unique features that must be fully characterized in order to understand non-specific binding, pharmacokinetics, and in vivo metabolism [47]. In addition, new tracers for tau are being developed and applied. This is a fast moving field, but one with great promise.
Plans for the future of ADNI (i.e., ADNI3) will include tau imaging as a prominent feature. Although the field is still under development, there are several promising radiotracers at least one of which will be available at multiple ADNI sites. In Berkeley, preliminary data using the compound initially known as [18F]T807, now [18F]AV-1451 has been obtained [48]. As can be seen in figure 5 this radiotracer shows tau accumulation in normal aging in the medial temporal lobe. In some older individuals tau can be found in neocortical regions, though generally not as widely dispersed as in patients with AD.
Figure 5.
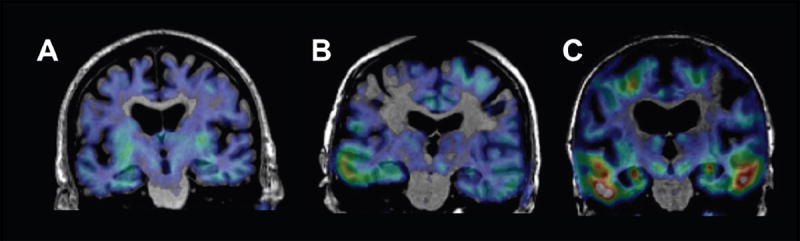
PET images of tau accumulation superimposed on subjects’ MRI scans. Tau imaging utilized the tracer [18F]AV-1451. Subject A is a normal older control, with a pattern of tracer retention suggesting minimal tau accumulation in the medial temporal lobes. Subject B, also a normal control, shows tracer retention into the temporal neocortex; this individual also shows evidence of widespread β-amyloid accumulation with [11C]PIB imaging (not shown). Subject C is a patient with AD who shows extensive tracer retention in temporal lobes and parietal lobes.
These data suggest that tau imaging will be practical and illuminating in the next phase of ADNI research. We intend to combine tau imaging with amyloid imaging in order to understand how these accumulated proteins reflect different stages of AD and how the accumulation of one protein is related to the other and to cognition. This approach will be useful in terms of investigating these PET methods in assessing outcomes of therapies, whether directed at Aβ or at tau itself – since it is possible that lowering Aβ could have beneficial effects on tau load. It could also provide useful insights into the group of individuals exhibiting neurodegeneration in the absence of amyloid [49]. Furthermore, the use of multimodality imaging of this sort offers the potential for “staging” the progression of AD in order to include patients at a disease severity that is appropriate to the therapy being tested. The public availability of a large dataset with amyloid imaging, tau imaging, and the other ADNI biomarkers and clinical information promises to speed the development of knowledge about the earliest phases of AD, how the disease progresses, and potential new treatments.
Footnotes
Publisher's Disclaimer: This is a PDF file of an unedited manuscript that has been accepted for publication. As a service to our customers we are providing this early version of the manuscript. The manuscript will undergo copyediting, typesetting, and review of the resulting proof before it is published in its final citable form. Please note that during the production process errors may be discovered which could affect the content, and all legal disclaimersthat apply to the journal pertain.
References
- 1.Jagust WJ, Bandy D, Chen K, Foster NL, Landau SM, Mathis CA, et al. The Alzheimer’s Disease Neuroimaging Initiative positron emission tomography core. Alzheimers Dement. 2010;6:221–9. doi: 10.1016/j.jalz.2010.03.003. [DOI] [PMC free article] [PubMed] [Google Scholar]
- 2.Salloway S, Sperling R, Fox NC, Blennow K, Klunk W, Raskind M, et al. Two phase 3 trials of bapineuzumab in mild-to-moderate Alzheimer’s disease. N Engl J Med. 2014;370:322–33. doi: 10.1056/NEJMoa1304839. [DOI] [PMC free article] [PubMed] [Google Scholar]
- 3.Sperling RA, Rentz DM, Johnson KA, Karlawish J, Donohue M, Salmon DP, et al. The A4 study: stopping AD before symptoms begin? Sci Transl Med. 2014;6:228fs13. doi: 10.1126/scitranslmed.3007941. [DOI] [PMC free article] [PubMed] [Google Scholar]
- 4.Talairach J, Tournoux P. Co-planar Stereotaxic Atlas of the Human Brain. New York: Thieme; 1988. [Google Scholar]
- 5.Landau SM, Mintun MA, Joshi AD, Koeppe RA, Petersen RC, Aisen PS, et al. Amyloid deposition, hypometabolism, and longitudinal cognitive decline. Ann Neurol. 2012;72:578–86. doi: 10.1002/ana.23650. [DOI] [PMC free article] [PubMed] [Google Scholar]
- 6.Villemagne VL, Burnham S, Bourgeat P, Brown B, Ellis KA, Salvado O, et al. Amyloid beta deposition, neurodegeneration, and cognitive decline in sporadic Alzheimer’s disease: a prospective cohort study. Lancet Neurol. 2013;12:357–67. doi: 10.1016/S1474-4422(13)70044-9. [DOI] [PubMed] [Google Scholar]
- 7.Jack CR, Jr, Wiste HJ, Lesnick TG, Weigand SD, Knopman DS, Vemuri P, et al. Brain beta-amyloid load approaches a plateau. Neurology. 2013;80:890–6. doi: 10.1212/WNL.0b013e3182840bbe. [DOI] [PMC free article] [PubMed] [Google Scholar]
- 8.Landau SM, Fero A, Baker SL, Koeppe R, Mintun M, Chen K, et al. Measurement of Longitudinal beta-Amyloid Change with 18F-Florbetapir PET and Standardized Uptake Value Ratios. J Nucl Med. 2015;56:567–74. doi: 10.2967/jnumed.114.148981. [DOI] [PMC free article] [PubMed] [Google Scholar]
- 9.Chen K, Roontiva A, Thiyyagura P, Lee W, Liu X, Ayutyanont N, et al. Improved Power for Characterizing Longitudinal Amyloid-beta PET Changes and Evaluating Amyloid-Modifying Treatments with a Cerebral White Matter Reference Region. J Nucl Med. 2015;56:560–6. doi: 10.2967/jnumed.114.149732. [DOI] [PubMed] [Google Scholar]
- 10.Brendel M, Hogenauer M, Delker A, Sauerbeck J, Bartenstein P, Seibyl J, et al. Improved longitudinal [(18)F]-AV45 amyloid PET by white matter reference and VOI-based partial volume effect correction. Neuroimage. 2015;108:450–9. doi: 10.1016/j.neuroimage.2014.11.055. [DOI] [PubMed] [Google Scholar]
- 11.Price JC, Klunk WE, Lopresti BJ, Lu X, Hoge JA, Ziolko SK, et al. Kinetic modeling of amyloid binding in humans using PET imaging and Pittsburgh Compound-B. J Cereb Blood Flow Metab. 2005;25:1528–47. doi: 10.1038/sj.jcbfm.9600146. [DOI] [PubMed] [Google Scholar]
- 12.Klunk WE, Koeppe RA, Price JC, Benzinger TL, Devous MD, Sr, Jagust WJ, et al. The Centiloid Project: Standardizing quantitative amyloid plaque estimation by PET. Alzheimers Dement. 2015;11:1–15 e4. doi: 10.1016/j.jalz.2014.07.003. [DOI] [PMC free article] [PubMed] [Google Scholar]
- 13.Landau SM, Lu M, Joshi AD, Pontecorvo M, Mintun MA, Trojanowski JQ, et al. Comparing positron emission tomography imaging and cerebrospinal fluid measurements of beta-amyloid. Ann Neurol. 2013;74:826–36. doi: 10.1002/ana.23908. [DOI] [PMC free article] [PubMed] [Google Scholar]
- 14.Mattsson N, Insel PS, Donohue M, Landau S, Jagust WJ, Shaw LM, et al. Independent information from cerebrospinal fluid amyloid-beta and florbetapir imaging in Alzheimer’s disease. Brain. 2015;138:772–83. doi: 10.1093/brain/awu367. [DOI] [PMC free article] [PubMed] [Google Scholar]
- 15.Landau SM, Thomas BA, Thurfjell L, Schmidt M, Margolin R, Mintun M, et al. Amyloid PET imaging in Alzheimer’s disease: a comparison of three radiotracers. Eur J Nucl Med Mol Imaging. 2014;41:1398–407. doi: 10.1007/s00259-014-2753-3. [DOI] [PMC free article] [PubMed] [Google Scholar]
- 16.Vandenberghe R, Van Laere K, Ivanoiu A, Salmon E, Bastin C, Triau E, et al. 18F-flutemetamol amyloid imaging in Alzheimer disease and mild cognitive impairment: a phase 2 trial. Ann Neurol. 2010;68:319–29. doi: 10.1002/ana.22068. [DOI] [PubMed] [Google Scholar]
- 17.Villemagne VL, Mulligan RS, Pejoska S, Ong K, Jones G, O’Keefe G, et al. Comparison of 11C-PiB and 18F-florbetaben for Abeta imaging in ageing and Alzheimer’s disease. Eur J Nucl Med Mol Imaging. 2012;39:983–9. doi: 10.1007/s00259-012-2088-x. [DOI] [PubMed] [Google Scholar]
- 18.Lo RY, Hubbard AE, Shaw LM, Trojanowski JQ, Petersen RC, Aisen PS, et al. Longitudinal change of biomarkers in cognitive decline. Arch Neurol. 2011;68:1257–66. doi: 10.1001/archneurol.2011.123. [DOI] [PMC free article] [PubMed] [Google Scholar]
- 19.Jack CR, Jr, Knopman DS, Jagust WJ, Petersen RC, Weiner MW, Aisen PS, et al. Tracking pathophysiological processes in Alzheimer’s disease: an updated hypothetical model of dynamic biomarkers. Lancet Neurol. 2013;12:207–16. doi: 10.1016/S1474-4422(12)70291-0. [DOI] [PMC free article] [PubMed] [Google Scholar]
- 20.Jack CR, Jr, Knopman DS, Jagust WJ, Shaw LM, Aisen PS, Weiner MW, et al. Hypothetical model of dynamic biomarkers of the Alzheimer’s pathological cascade. Lancet Neurol. 2010;9:119–28. doi: 10.1016/S1474-4422(09)70299-6. [DOI] [PMC free article] [PubMed] [Google Scholar]
- 21.Lo RY, Jagust WJ. Alzheimer’s Disease Neuroimaging I. Vascular burden and Alzheimer disease pathologic progression. Neurology. 2012;79:1349–55. doi: 10.1212/WNL.0b013e31826c1b9d. [DOI] [PMC free article] [PubMed] [Google Scholar]
- 22.Haight TJ, Landau SM, Carmichael O, Schwarz C, DeCarli C, Jagust WJ, et al. Dissociable effects of Alzheimer disease and white matter hyperintensities on brain metabolism. JAMA Neurol. 2013;70:1039–45. doi: 10.1001/jamaneurol.2013.1878. [DOI] [PMC free article] [PubMed] [Google Scholar]
- 23.Langbaum JB, Chen K, Lee W, Reschke C, Bandy D, Fleisher AS, et al. Categorical and correlational analyses of baseline fluorodeoxyglucose positron emission tomography images from the Alzheimer’s Disease Neuroimaging Initiative (ADNI) Neuroimage. 2009;45:1107–16. doi: 10.1016/j.neuroimage.2008.12.072. [DOI] [PMC free article] [PubMed] [Google Scholar]
- 24.Chen K, Ayutyanont N, Langbaum JB, Fleisher AS, Reschke C, Lee W, et al. Characterizing Alzheimer’s disease using a hypometabolic convergence index. Neuroimage. 2011;56:52–60. doi: 10.1016/j.neuroimage.2011.01.049. [DOI] [PMC free article] [PubMed] [Google Scholar]
- 25.Chen K, Langbaum JB, Fleisher AS, Ayutyanont N, Reschke C, Lee W, et al. Twelve-month metabolic declines in probable Alzheimer’s disease and amnestic mild cognitive impairment assessed using an empirically pre-defined statistical region-of-interest: findings from the Alzheimer’s Disease Neuroimaging Initiative. Neuroimage. 2010;51:654–64. doi: 10.1016/j.neuroimage.2010.02.064. [DOI] [PMC free article] [PubMed] [Google Scholar]
- 26.Beckett LA, Harvey DJ, Gamst A, Donohue M, Kornak J, Zhang H, et al. The Alzheimer’s Disease Neuroimaging Initiative: Annual change in biomarkers and clinical outcomes. Alzheimers Dement. 2010;6:257–64. doi: 10.1016/j.jalz.2010.03.002. [DOI] [PMC free article] [PubMed] [Google Scholar]
- 27.Caroli A, Prestia A, Chen K, Ayutyanont N, Landau SM, Madison CM, et al. Summary metrics to assess Alzheimer disease-related hypometabolic pattern with 18F-FDG PET: head-to-head comparison. J Nucl Med. 2012;53:592–600. doi: 10.2967/jnumed.111.094946. [DOI] [PMC free article] [PubMed] [Google Scholar]
- 28.Schraml F, Chen K, Ayutyanont N, Auttawut R, Langbaum JB, Lee W, et al. Association between an Alzheimer’s Disease-Related Index and Gene Dose. PLoS One. 2013;8:e67163. doi: 10.1371/journal.pone.0067163. [DOI] [PMC free article] [PubMed] [Google Scholar]
- 29.Fleisher AS, Chen K, Quiroz YT, Jakimovich LJ, Gutierrez Gomez M, Langois CM, et al. Associations Between Biomarkers and Age in the Presenilin 1 E280A Autosomal Dominant Alzheimer Disease Kindred: A Cross-sectional Study. JAMA Neurol. 2015 doi: 10.1001/jamaneurol.2014.3314. [DOI] [PMC free article] [PubMed] [Google Scholar]
- 30.Protas HD, Chen K, Langbaum JB, Fleisher AS, Alexander GE, Lee W, et al. Posterior cingulate glucose metabolism, hippocampal glucose metabolism, and hippocampal volume in cognitively normal, late-middle-aged persons at 3 levels of genetic risk for Alzheimer disease. JAMA Neurol. 2013;70:320–5. doi: 10.1001/2013.jamaneurol.286. [DOI] [PMC free article] [PubMed] [Google Scholar]
- 31.Toledo JB, Cairns NJ, Da X, Chen K, Carter D, Fleisher A, et al. Clinical and multimodal biomarker correlates of ADNI neuropathological findings. Acta Neuropathol Commun. 2013;1:65. doi: 10.1186/2051-5960-1-65. [DOI] [PMC free article] [PubMed] [Google Scholar]
- 32.Toledo JB, Weiner MW, Wolk DA, Da X, Chen K, Arnold SE, et al. Neuronal injury biomarkers and prognosis in ADNI subjects with normal cognition. Acta Neuropathol Commun. 2014;2:26. doi: 10.1186/2051-5960-2-26. [DOI] [PMC free article] [PubMed] [Google Scholar]
- 33.Shi J, Stonnington CM, Thompson PM, Chen K, Gutman B, Reschke C, et al. Studying ventricular abnormalities in mild cognitive impairment with hyperbolic Ricci flow and tensor-based morphometry. Neuroimage. 2015;104:1–20. doi: 10.1016/j.neuroimage.2014.09.062. [DOI] [PMC free article] [PubMed] [Google Scholar]
- 34.Wu X, Li J, Ayutyanont N, Protas H, Jagust W, Fleisher A, et al. The receiver operational characteristic for binary classification with multiple indices and its application to the neuroimaging study of Alzheimer’s disease. IEEE/ACM Trans Comput Biol Bioinform. 2013;10:173–80. doi: 10.1109/TCBB.2012.141. [DOI] [PMC free article] [PubMed] [Google Scholar]
- 35.Tzimopoulou S, Cunningham VJ, Nichols TE, Searle G, Bird NP, Mistry P, et al. A multi-center randomized proof-of-concept clinical trial applying [(1)(8)F]FDG-PET for evaluation of metabolic therapy with rosiglitazone XR in mild to moderate Alzheimer’s disease. J Alzheimers Dis. 2010;22:1241–56. doi: 10.3233/JAD-2010-100939. [DOI] [PubMed] [Google Scholar]
- 36.Wang T, Huang Q, Reiman EM, Chen K, Li X, Li G, et al. Effects of memantine on clinical ratings, fluorodeoxyglucose positron emission tomography measurements, and cerebrospinal fluid assays in patients with moderate to severe Alzheimer dementia: a 24-week, randomized, clinical trial. J Clin Psychopharmacol. 2013;33:636–42. doi: 10.1097/JCP.0b013e31829a876a. [DOI] [PubMed] [Google Scholar]
- 37.Langbaum JB, Fleisher AS, Chen K, Ayutyanont N, Lopera F, Quiroz YT, et al. Ushering in the study and treatment of preclinical Alzheimer disease. Nat Rev Neurol. 2013;9:371–81. doi: 10.1038/nrneurol.2013.107. [DOI] [PMC free article] [PubMed] [Google Scholar]
- 38.Reiman EM, Langbaum JB, Tariot PN. Alzheimer’s prevention initiative: a proposal to evaluate presymptomatic treatments as quickly as possible. Biomark Med. 2010;4:3–14. doi: 10.2217/bmm.09.91. [DOI] [PMC free article] [PubMed] [Google Scholar]
- 39.Minoshima S, Koeppe RA, Frey KA, Kuhl DE. Anatomic standardization: linear scaling and nonlinear warping of functional brain images. J Nucl Med. 1994;35:1528–37. [PubMed] [Google Scholar]
- 40.Rostomian AH, Madison C, Rabinovici GD, Jagust WJ. Early 11C-PIB frames and 18F-FDG PET measures are comparable: a study validated in a cohort of AD and FTLD patients. J Nucl Med. 2011;52:173–9. doi: 10.2967/jnumed.110.082057. [DOI] [PMC free article] [PubMed] [Google Scholar]
- 41.Hsiao IT, Huang CC, Hsieh CJ, Hsu WC, Wey SP, Yen TC, et al. Correlation of early-phase 18F-florbetapir (AV-45/Amyvid) PET images to FDG images: preliminary studies. Eur J Nucl Med Mol Imaging. 2012;39:613–20. doi: 10.1007/s00259-011-2051-2. [DOI] [PubMed] [Google Scholar]
- 42.Ashburner J, Friston KJ. Nonlinear spatial normalization using basis functions. Hum Brain Mapp. 1999;7:254–66. doi: 10.1002/(SICI)1097-0193(1999)7:4<254::AID-HBM4>3.0.CO;2-G. [DOI] [PMC free article] [PubMed] [Google Scholar]
- 43.Landau SM, Breault C, Joshi AD, Pontecorvo M, Mathis CA, Jagust WJ, et al. Amyloid-beta imaging with Pittsburgh compound B and florbetapir: comparing radiotracers and quantification methods. J Nucl Med. 2013;54:70–7. doi: 10.2967/jnumed.112.109009. [DOI] [PMC free article] [PubMed] [Google Scholar]
- 44.Chien DT, Bahri S, Szardenings AK, Walsh JC, Mu F, Su MY, et al. Early clinical PET imaging results with the novel PHF-tau radioligand [F-18]-T807. J Alzheimers Dis. 2013;34:457–68. doi: 10.3233/JAD-122059. [DOI] [PubMed] [Google Scholar]
- 45.Maruyama M, Shimada H, Suhara T, Shinotoh H, Ji B, Maeda J, et al. Imaging of tau pathology in a tauopathy mouse model and in Alzheimer patients compared to normal controls. Neuron. 2013;79:1094–108. doi: 10.1016/j.neuron.2013.07.037. [DOI] [PMC free article] [PubMed] [Google Scholar]
- 46.Okamura N, Furumoto S, Fodero-Tavoletti MT, Mulligan RS, Harada R, Yates P, et al. Non-invasive assessment of Alzheimer’s disease neurofibrillary pathology using 18F-THK5105 PET. Brain. 2014;137:1762–71. doi: 10.1093/brain/awu064. [DOI] [PubMed] [Google Scholar]
- 47.Villemagne VL, Fodero-Tavoletti MT, Masters CL, Rowe CC. Tau imaging: early progress and future directions. Lancet Neurol. 2015;14:114–24. doi: 10.1016/S1474-4422(14)70252-2. [DOI] [PubMed] [Google Scholar]
- 48.Ossenkoppele R, Schonhaut DR, Baker SL, O’Neil JP, Janabi M, Ghosh PM, et al. Tau, amyloid, and hypometabolism in a patient with posterior cortical atrophy. Ann Neurol. 2015;77:338–42. doi: 10.1002/ana.24321. [DOI] [PMC free article] [PubMed] [Google Scholar]
- 49.Jack CR, Jr, Knopman DS, Weigand SD, Wiste HJ, Vemuri P, Lowe V, et al. An operational approach to National Institute on Aging-Alzheimer’s Association criteria for preclinical Alzheimer disease. Ann Neurol. 2012;71:765–75. doi: 10.1002/ana.22628. [DOI] [PMC free article] [PubMed] [Google Scholar]