Abstract
INTRODUCTION
The Alzheimer’s Disease Neuroimaging Initiative (ADNI) is a multi-site study designed to characterize the trajectories of biomarkers across the aging process. We present ADNI Biostatistics Core analyses that integrate data over the length, breadth, and depth of ADNI.
METHODS
Relative progression of key imaging, fluid, and clinical measures was assessed. Individuals with subjective memory complaints (SMC) and early mild cognitive impairment (eMCI) were compared to normal controls, MCI and individuals with Alzheimer’s disease. Amyloid imaging and magnetic resonance imaging (MRI) summaries were assessed as predictors of disease progression.
RESULTS
Relative progression of markers supports parts of the amyloid cascade hypothesis, although evidence of earlier occurrence of cognitive change exists. SMC are similar to normal controls, while eMCI fall between the cognitively normal and MCI groups. Amyloid leads to faster conversion and increased cognitive impairment.
DISCUSSION
Analyses support features of the amyloid hypothesis, but also illustrate the considerable heterogeneity in the aging process.
Keywords: Alzheimer’s disease, subjective memory complaints, amyloid cascade hypothesis
1. Background
Alzheimer’s disease (AD) is the most common cause of dementia in the elderly, affecting an estimated 5.2 million people in the United States and costing the nation more than $200 billion per year [1]. Even the few approved treatments have limited efficacy, and many clinical trials have failed to demonstrate any clinical impact [2,3]. One strategy to address the lack of effective treatments is to begin treatment earlier, even before the clinical diagnosis of dementia, into the stage of mild cognitive impairment (MCI) [that precedes AD [4, 5] or even in people with normal cognitive function but prodromal indications [6]. A related strategy is to find and characterize biomarkers that could either identify people at risk during or even before the onset of MCI, or could serve as surrogate markers to detect treatment impact more efficiently [7].
The Alzheimer’s Disease Neuroimaging Initiative (ADNI) is an ongoing multi-site cohort study designed to characterize the trajectories of clinical, imaging, and fluid biomarkers across the entire spectrum of aging from clinically normal individuals through MCI to AD, with data made available publicly for widespread use [8]. The goal is to identify biomarkers and genetic characteristics that would support the early detection and tracking of AD, as well as improved clinical trial design. ADNI was initially funded in 2004 and recruited 819 people in this phase (ADNI-1). Additional funding and recruitment were made possible through a Grand Opportunities supplement (ADNI-GO) in 2009 and a competitive renewal (ADNI-2) in 2010.
The ADNI Biostatistics Core was established with the initial funding and has been an integral part of ADNI through all its phases [9]. The Core provides leadership and support for study design, data analysis, and presentation of findings, as well as guidance for the many outside researchers who want to access and analyze ADNI data. The volume of data made available by ADNI is unprecedented in aging research. ADNI-2 has substantially increased not only the numbers of subjects but also the duration of follow-up of the initial participants, the breadth of our coverage of the spectrum of aging with new cohorts added, and the depth of our understanding with new biomarkers studied. The Biostatistics Core is unique in the ADNI organization in having responsibility for analyses that integrate across the entire length, breadth, and depth of the study. This paper will highlight some research accomplishments of the Core that have taken advantage of ADNI-2 data.
2. Methods
2.1 Study design and participants
Data used in the preparation of this article were obtained from the Alzheimer’s Disease Neuroimaging Initiative (ADNI) database (adni.loni.usc.edu). The ADNI was launched in 2003 by the National Institute on Aging (NIA), the National Institute of Biomedical Imaging and Bioengineering (NIBIB), the Food and Drug Administration (FDA), private pharmaceutical companies, and non-profit organizations, as a $60 million, 5-year public private partnership. The primary goal of ADNI has been to test whether serial magnetic resonance imaging (MRI), positron emission tomography (PET), other biological markers, and clinical and neuropsychological assessment can be combined to measure the progression of mild cognitive impairment (MCI) and early Alzheimer’s disease (AD). Determination of sensitive and specific markers of very early AD progression is intended to aid researchers and clinicians to develop new treatments and monitor their effectiveness, as well as lessen the time and cost of clinical trials.
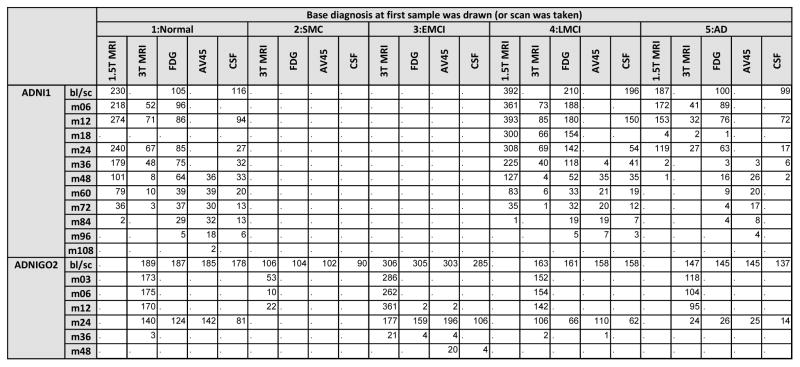
ADNI-1, ADNI-GO, and ADNI-2 study design and participants have been described in detail previously [8,10]. Briefly, ADNI-GO and ADNI-2 added 129 and 782 participants, respectively, to the 819 recruited by ADNI-1, with ADNI-1 normal controls (NC) and MCI participants continuing to be followed. ADNI-GO also added a new cohort of people with early MCI (eMCI), and ADNI-2 added a cohort who were clinically evaluated as cognitively normal, but had subjective memory complaints (SMC) (Figure 1). All phases of the study collected clinical data (neuropsychological testing, neurological examination and diagnosis) and structural MRI on all patients. FDG-PET and CSF were each obtained on only about 50% of the participants in ADNI-1, but were collected on everyone participating in ADNI-GO and ADNI-2, and amyloid imaging was added for participants during ADNI-GO and ADNI-2 (Figure 1).
Figure 1.
Number of individuals with 1.5T MRI, 3T MRI, FDG-PET, AV45, or CSF by diagnosis at the baseline visit (or at the visit when the first sample or scan was taken). Counts are presented by visit within a phase of ADNI.
Thus ADNI-2 expanded the length of potential follow-up for NC and MCI from ADNI-1 and for NC, eMCI, and MCI from ADNI-GO, with data currently available from up to 9 years of follow-up for ADNI-1, and up to 4 years of follow-up for ADNI-GO. The breadth of the MCI span was increased by adding eMCI in ADNI-GO and ADNI-2, and the breadth of the normal span was increased by adding SMC in ADNI-2. The depth of biomarker reach was greatly enhanced by the addition of amyloid imaging, and will be further enriched by a recently funded tau imaging supplement.
2.2 Measures
We considered Mini-Mental State Exam (MMSE) [11]; Clinical Dementia Rating (CDR) Sum of Boxes [12]; 13 item Cognitive Subscale of the Alzheimer’s Disease Assessment Scale (ADAS-Cog) [13]; Rey Auditory Verbal Learning Test (AVLT) [14], Preclinical Alzheimer’s Cognitive Composite (PACC) [15], Functional Activities Questionnaire (FAQ) [16], MRI summaries of hippocampal volume and entorhinal cortex [17], ventricular and total brain volume [18] (see [19] and adni.loni.usc.edu for MRI protocol information), CSF assays of Abeta, tau, and pTau [20], and PET summaries of glucose metabolism and amyloid burden [21].
2.3 Statistical analysis
Length
The goal of this analysis was to predict typical long-term disease marker trajectories spanning the range of disease severity, from cognitively normal to dementia. To accomplish this goal, we used a three-step procedure. Step one was to transform each outcome measure to a common 100-point scale using a quantile transformation, with 0 representing complete absence of disease symptoms or pathology and 100 representing the maximum observed level, weighted to account for disproportionate sampling of diagnostic categories. Step two was to apply a general semi-parametric and iterative estimation procedure to derive subject-specific estimates of latent disease-time [22]. This procedure uses information from all outcome measures to place each subject on a long-term continuum of disease, quantified as years into the disease process. For example, if subject A has a latent disease-time estimate that is five years greater than subject B, this implies subject A is estimated to be five years more advanced toward dementia than subject B. Step three was to fit a model estimating the predicted level (on the 0–100 scale) for each outcome measure for a person at a specific latent disease-time, adjusted for age, apolipoprotein E (APOE) ε4 allele carriage, sex, and education. We included amyloid and tau as fixed-effects predictors for other measures. We assumed a logistic curve shape. We used the resulting estimates to derive predicted long-term (age 50–90) progression curves (on a scale of 0 to 100) for each outcome measure, both for a typical APOEε4 carrier and for normal aging (i.e. latent disease-time=0 years). The progressive APOEε4 carrier curves were calibrated so that the MMSE curve attains the mean of the ADNI sample at the mean age of the APOEε4 carriers. Additional curves were projected for APOEε4 carriers with elevated amyloid (SUVR of 1.15) at age 50. All available panel data were used for these analyses, giving up to 9 years of follow-up for the longest observations.
Breadth
We summarized the distribution of key biomarkers by boxplots separately for each diagnostic group (NC, SMC, eMCI, MCI, AD) at baseline, with comparison of means by analysis of variance (ANOVA) and Tukey honest significant difference test for multiple comparisons. We present findings for representative imaging and cognitive summary measures (AV45 SUVR, FDG PET mean across all regions of interest, hippocampal volume, ADAS-Cog.) We further examined the SMC and NC groups for differences from each other at baseline, using two-sample t-tests and chi-square tests. We quantified biological heterogeneity within the NC and SMC groups, using unsupervised clustering, as in previous work with ADNI-1 NC and MCI data (23, 24). Briefly, each individual began as a cluster of one person. Then individuals were aggregated iteratively to maintain the greatest similarity within clusters (total distance between individuals in the cluster and the cluster center, based on MRI measures and CSF measures without regard to cognitive or functional differences.) The choice of number of clusters was based on observed visual separation of the clusters, and on computed within-cluster dissimilarity as number of clusters decreased, with a goal of obtaining the smallest number of clusters that could capture some separation between clusters and limit spread or dissimilarity within cluster.
Depth
We assessed the performance of amyloid imaging as a predictor of disease progression, using both first observed conversion (SMC/NC to MCI) and MMSE trajectory (number of errors) as the outcomes. For conversion, we compared amyloid-positive at baseline (AV45 SUVR > 1.1 or CSF Abeta < 192 pg/ml) to amyloid negative by log-rank test, illustrated by Kaplan-Meier plots. For this analysis, missing baseline amyloid SUVR was imputed using linear mixed-effects models of all observed SUVRs. This model of SUVR included fixed effects for time from baseline, age, APOEε4 carriage, and baseline PACC; and subject-specific random intercepts and slopes. We imputed missing baseline values with the subject-level predicted baseline SUVR values from this model. We also fitted a Cox model [25] controlling for age and other covariates selected by Akaike Information Criteria from among APOE, education, PACC, and hippocampal volume. For change in MMSE, we used number of errors (30-score) as the outcome and fitted separate models for comparison in eMCI and MCI. We considered the AV45 and FDG PET composites and hippocampal volume, entorhinal cortex thickness (ERC), total brain volume and ventricular volume as possible predictors. Each marker was standardized by subtracting the group mean and dividing by the group standard deviation, so that a one unit increase corresponded to a one standard deviation increase for each marker. Predicted trajectories were estimated by generalized mixed models with log link, Poisson error, and random intercept, adjusted for age, education, and gender.
3. Results
3.1 Long-term follow-up
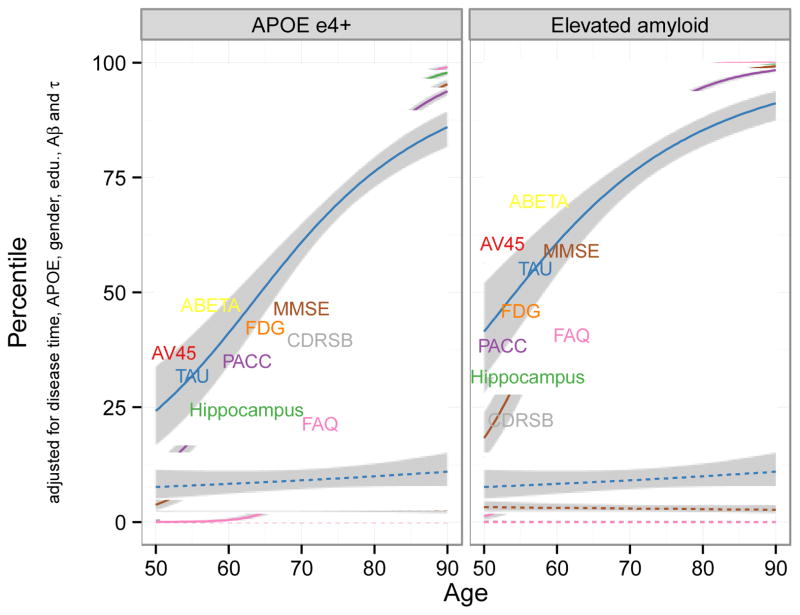
General semi-parametric estimation based on a composite of all available years of ADNI-1, ADNI-GO, and ADNI-2 data gave estimates of the typical trajectories of 2 fluid biomarkers (CSF Abeta, Tau), 3 imaging measures (AV45, FDG, hippocampal volume), and 4 clinical measures (PACC, MMSE, FAQ, and CDR SB) controlling for APOEε4 carriage, sex, education, amyloid, and tau (Figure 2). The curves project progression for typical progressive APOEε4 carriers (solid lines, left panel), progressive APOEε4 carriers with elevated amyloid at age 50 (solid lines right panel), and non-progressive APOEε4 non-carriers (dashed lines). Non-progressive estimates showed very stable trajectories over the period from 50 to 90 years of age, remaining close to the lowest percentile, that is, best or healthiest levels. Only hippocampal volume showed a trend toward abnormality with age. High-risk participants, however, were estimated to follow trajectories that became steadily worse in all levels with increasing age. The estimated paths support features of the model hypothesized by [26,27]. Both CSF Abeta levels and amyloid deposition in the brain precede other abnormalities for the typical progressive individual, followed by CSF tau. FDG PET and MRI volumetric measures were estimated to be near normal at age 50 for ε4 carriers but already above the normal baseline at age 50 for people with elevated amyloid at baseline, and increasing rapidly thereafter for both high-risk groups. Functional measures were found to become abnormal after the imaging measures, with FAQ the last of these measures to display problems. In contrast to the Jack model, and of particular importance to the design of therapeutic trials in the earliest stages of AD, cognitive change is evident as early as FDG-PET change, and precedes that of MRI volumetric measures.
Figure 2.
Long-term trajectories from least affected (0th percentile) to most affected (100th percentile), estimated for high-risk and low-risk patients, from age 50 to 90.
3.2 Added subgroups: eMCI, SMC
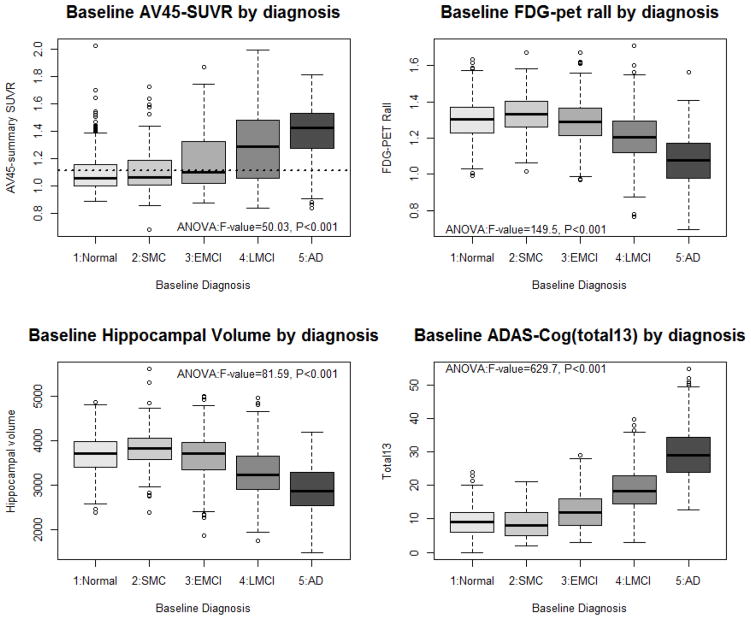
Box plots of brain imaging and cognitive performance (Figure 3) show that the eMCI group, as expected, falls in between the late MCI (LMCI) group and the two groups clinically rated as cognitively normal, with fewer individuals overlapping with the AD group. The SMC group, on the other hand, appears very similar to the original normal controls in amyloid and FDG uptake, baseline hippocampal volume, and cognitive performance. These impressions are confirmed by ANOVA followed by Tukey’s HSD multiple comparison test. In particular, NC do not differ from SMC in these four measures. NC and eMCI also do not differ in hippocampal volume or FDG PET and SMC and eMCI are similar in AV45. All other group comparisons are significantly different in these four measures.
Figure 3.
Boxplot of representative imaging and cognitive summary measures. Multiple comparison results from ANOVA: NC do not differ from SMC in any measure, and both are worse than LMCI, which is worse than AD, in all measures. EMCI is between and different from SMC and LMCI for FDG-PET and ADAS-COG, but does not differ from SMC for AV45 or from NC for hippocampal volume.
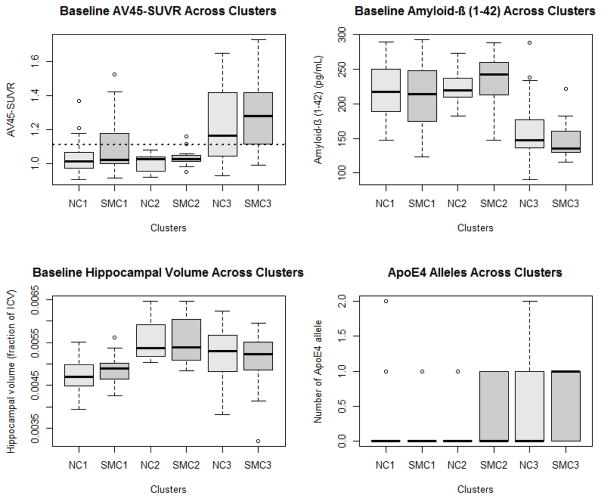
We examined the ADNI-2 SMC and NC groups in more detail, to see whether neuroimaging and fluid biomarkers could distinguish more homogeneous subgroups, as previously found in ADNI-1 for normal controls [23] and MCI [24]. Unsupervised cluster analysis identified three distinct subgroups in both the NC and the SMC groups, very similar to those in the ADNI-1 normal controls (Figure 4). One subgroup in both NC and SMC (groups labeled 2 in the figure) displayed normal levels of all measurements, comparable to the best levels observed across the ADNI cohorts. A second subgroup in each diagnostic group (groups labeled 3 in the figure) corresponded well to the Jack sequence for early signs of AD, with elevated brain amyloid, decreased CSF Abeta, and somewhat decreased hippocampal volume compared to the healthy subgroup 2 participants. The third subgroup (labeled groups 1 in the figure) was similar to the subgroup 2 participants in brain amyloid and CSF Abeta, but had substantially reduced hippocampal volume. Interestingly, APOE genotype, which was not used in determining clusters, was markedly different across the 3 subgroups, with group 3 showing much higher frequency of E4 alleles.
Figure 4.
SMC is heterogeneous, in a very similar way to NC, and similar to previous work in NC and MCI.
3.3 Added measures, as predictors of progression
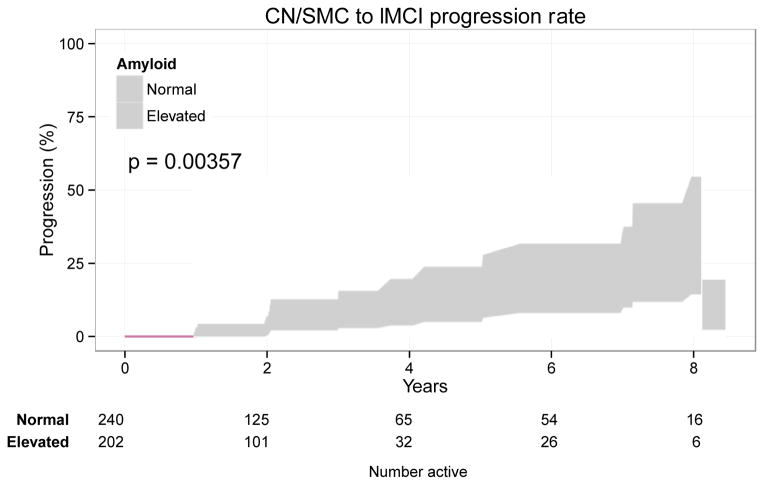
We found a highly significant difference in progression from SMC/NC to LMCI between those with versus without elevated amyloid at baseline (p<0.001; Figure 5). The amyloid effect was confirmed (hazard ratio 3.43, 95% CI 1.34 to 8.81, p=0.010) with a multivariate Cox model controlling for age (p=0.826), PACC (p=0.004), and hippocampal volume (p<0.001) at baseline.
Figure 5.
Amyloid positivity predicts conversion from SMC/NC to LMCI. The Kaplan-Meier plot depicts the proportion diagnosed as LMCI at least once over time by baseline amyloid status (log-rank p=0.00357). The amyloid effect was confirmed (hazard ratio 3.43, 95% CI 1.34 to 8.81, p=0.010) in multivariate Cox model controlling for age, PACC, and hippocampal volume at baseline.
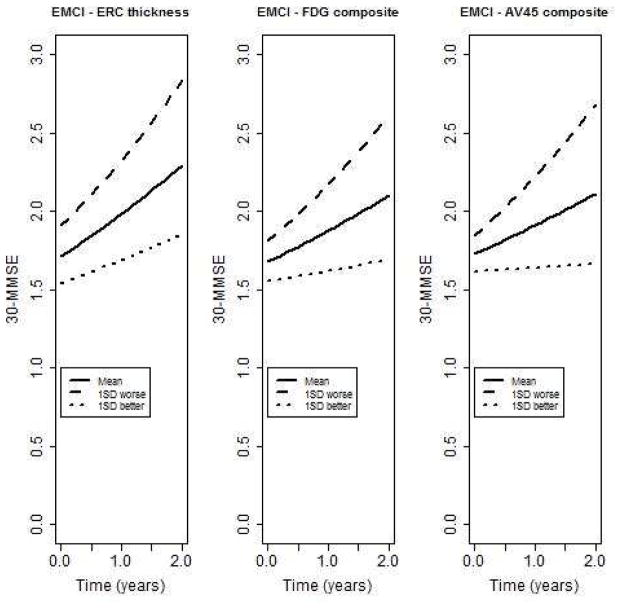
In the EMCI group (n=292), entorhinal cortical thickness (β;=−0.05, SE=0.02, p=0.01), FDG-PET composite (β;=−0.07, SE=0.02, p=0.001), and the AV45 composite (β;=0.09, SE=0.02, p<0.001) were significantly associated with change in the number of errors on the MMSE (Figure 6). Hippocampal volume (β;=−0.01, SE=0.02, p=0.53), total brain (β;=0.02, SE=0.02, p=0.42) and ventricular volume (β;=0.01, SE=0.02, p=0.45) were not significantly associated with change. When restricted to amyloid positive individuals (n=138), the FDG-PET composite (β;=−0.07, SE=0.03, p=0.01), and the AV45 composite (β;=0.09, SE=0.03, p=0.002) remained significantly associated with change in the number of errors. Thickness of the entorhinal cortex was not quite significant (β;=−0.06, SE=0.03, p=0.06). A similar pattern was observed in the LMCI group, except that the FDG-PET composite was not quite significant (results not shown).
Figure 6.
Predicted trajectories of number of errors on MMSE for eMCI patients with baseline levels average, 1 SD worse, or 1 SD better than average for cortical atrophy (entorhinal cortex (ERC) thickness), glucose uptake (FDG composite across regions of interest), or amyloid uptake (AV45 composite across regions of interest.)
4. Discussion
ADNI-2 has made possible new insights into the longer-term trajectory of the earliest signs and gradual progression of Alzheimer’s disease and its biological correlates. The Biostatistics Core has developed and applied new methods to characterize the entire spectrum from age 50 to age 90, and our results support both the Jack model for the progression of classic AD, and the likelihood of considerable heterogeneity in the aging process.
This heterogeneity is further illustrated by differences within the normal controls and subjective memory complaint groups. Both groups appear to be comprised of at least 3 somewhat dissimilar subgroups, with one group looking more like the earliest stages of classic AD, one group looking normal in all regards, and one having signs of brain atrophy without amyloid pathology. These results are consistent with our earlier work with ADNI-1 normal controls, where we found 3 subgroups [23], one of which later was determined to have many characteristics consistent with vascular pathology rather than amyloid-based abnormalities [28]. Further follow-up will help to establish whether the distinct subgroups identified in both SMC and NC as possible early AD do indeed convert to MCI, and whether the SMC group converts more rapidly than the NC group. In addition, further data collection for the two groups which show signs of cortical atrophy without amyloid pathology should help to assess whether they have vascular damage, as found in our ADNI-1 normal controls [28], or other pathology.
The early MCI group fits nicely between the normal controls and the later MCI group initially defined by ADNI-1. Thus a relatively straightforward expansion of the MCI inclusion standards can yield a group that covers much of the range between cognitive normality and dementia diagnosis. Long-term follow-up will help to establish whether indeed most of this early group will progress to increased cognitive impairment comparable to the late MCI group, and later to dementia, or whether the group is even more heterogeneous than we found with the late MCI group [24].
New imaging measures clearly show, even with the limited follow-up available so far in ADNI-2, that amyloid pathology in the brain is an ominous prodromal sign for progression, whether defined as conversion to MCI, or deteriorating cognitive and functional measurements. This holds true even after taking into account other correlates and predictors.
A major accomplishment of ADNI has been data sharing [8]. The richness and complexity of the database, though, poses challenges for researchers getting started using data. The Biostatistics Core has played a substantial role in making the database more widely accessible, via our support: teleconference workshops, online slide decks from workshops, R and SAS code for accessing and merging and setting up data; online help resources (http://adni.loni.usc.edu/support/, and https://groups.google.com/forum/#!forum/adni-data).
In summary, ADNI provides a rich dataset of imaging and fluid markers as well as clinical information for individuals across the full spectrum of cognitive abilities. The Biostatistics Core aims to analyze data generated by the other ADNI Cores to provide a comprehensive picture of what can be learned by ADNI. Indirectly, the Biostatistics Core further supports the study of Alzheimer’s disease progression by assisting non-ADNI investigators in understanding the complexities of the ADNI data.
Research in Context.
Systematic Review: A review of the relevant literature using PubMed was conducted.
Interpretation: Our findings illustrate the heterogeneity in aging and Alzheimer’s disease pathology. Components of the amyloid cascade hypothesis are supported, but there is evidence of earlier occurrence of cognitive impairment. Subgroups of cognitively normal individuals with and without subjective memory complaints exhibit biomarker patterns similar to Alzheimer’s disease patients, normal aging, and other pathologies. Amyloid leads to clinical progression and cognitive decline.
Future Directions: Additional follow-up of ADNI subjects will help to further evaluate the amyloid cascade hypothesis and whether different patterns of pathology correspond to the observed heterogeneity in the aging process. The addition of newer measures, including tau-imaging, may provide insight into some of this heterogeneity.
Acknowledgments
Data collection and sharing for this project were funded by the Alzheimer’s Disease Neuroimaging Initiative (ADNI) (National Institutes of Health Grant U01 AG024904) and DOD ADNI (Department of Defense award number W81XWH-12-2-0012). ADNI is funded by the National Institute on Aging, the National Institute of Biomedical Imaging and Bioengineering, and through generous contributions from the following: Alzheimer’s Association; Alzheimer’s Drug Discovery Foundation; Araclon Biotech; BioClinica, Inc.; Biogen Idec Inc.; Bristol-Myers Squibb Company; Eisai Inc.; Elan Pharmaceuticals, Inc.; Eli Lilly and Company; EuroImmun; F. Hoffmann-La Roche Ltd and its affiliated company Genentech, Inc.; Fujirebio; GE Healthcare; IXICO Ltd.; Janssen Alzheimer Immunotherapy Research & Development, LLC.; Johnson & Johnson Pharmaceutical Research & Development LLC.; Medpace, Inc.; Merck & Co., Inc.; Meso Scale Diagnostics, LLC.; NeuroRx Research; Neurotrack Technologies; Novartis Pharmaceuticals Corporation; Pfizer Inc.; Piramal Imaging; Servier; Synarc Inc.; and Takeda Pharmaceutical Company. The Canadian Institutes of Health Research is providing funds to support ADNI clinical sites in Canada. Private sector contributions are facilitated by the Foundation for the National Institutes of Health (www.fnih.org). The grantee organization is the Northern California Institute for Research and Education, and the study is coordinated by the Alzheimer’s Disease Cooperative Study at the University of California, San Diego. ADNI data are disseminated by the Laboratory for Neuro Imaging at the University of Southern California.
Laurel A. Beckett receives funding from the following NIH grants: 2P30CA093373-09 (deVere White, Ralph), 2P30AG010129-21 (DeCarli, Charles), 5U01AG024904-07 (Weiner, Michael), 5RC2AG036535-02 (Weiner, Michael). In addition, she has received funding from the following: 3UL1RR024146-06S2 (Berglund, Lars),5R01GM088336-03 (Villablanca, Amparo), 5R01AG012975-14 (Haan, Mary), 5R25RR026008-03 (Molinaro, Marco, California Breast Cancer Research Program grant: CBCRP # 16BB-1600 (von Friederichs-Fitzwater, Marlene). She also has received funding from the nonprofit Critical Path Institute (Arizona) for consultation on analysis of potential biomarkers for Alzheimer’s disease clinical trials. Michael C. Donohue receives funding from Alzheimer’s Association, Michael J. Fox Foundation, and W. Garfield Weston Foundation (Biomarkers Across Neurodegenerative Diseases); 5U01AG10483-15 (Aisen, Paul S), and 1U01AG24904-01 (Aisen, Paul S). Danielle J. Harvey receives funding from the following NIH grants: 5P30AG010129-23 (DeCarli, Charles), R01AG047827 (DeCarli, Charles), 2U01AG024904-06 (Weiner, Michael), 5R01HD042974-11 (Simon, Tony), 5U54NS079202-02 (Lein, Pamela), 1U54HD079125-01 (Abbeduto, Leonard). In addition she receives funding from the following DOD awards: W81XWH-12-2-0012 (Weiner, Michael), W81XWH-13-1-0259 (Weiner, Michael).
Footnotes
Publisher's Disclaimer: This is a PDF file of an unedited manuscript that has been accepted for publication. As a service to our customers we are providing this early version of the manuscript. The manuscript will undergo copyediting, typesetting, and review of the resulting proof before it is published in its final citable form. Please note that during the production process errors may be discovered which could affect the content, and all legal disclaimers that apply to the journal pertain.
References
- 1.http://www.alz.org/alzheimers_disease_facts_and_figures.asp
- 2.Cummings JL, Morstorf T, Zhong K. Alzheimer’s disease drug development pipeline: few candidates, frequent failures. Alzheimers Res Ther. 2014;6:37. doi: 10.1186/alzrt269. [DOI] [PMC free article] [PubMed] [Google Scholar]
- 3.Schneider LS, Mangialasche F, Andreasen N, Feldman H, Giacobini E, Jones R, et al. Clinical trials and late-stage drug development for Alzheimer’s disease: an appraisal from 1984 to 2014. J Intern Med. 2014;275:251–283. doi: 10.1111/joim.12191. [DOI] [PMC free article] [PubMed] [Google Scholar]
- 4.DeKosky ST, Carrillo MC, Phelps C, Knopman D, Petersen RC, Frank R, et al. Revision of the criteria for Alzheimer’s disease: A symposium. Alzheimers Dement. 2011;7:e1–e12. doi: 10.1016/j.jalz.2010.12.007. [DOI] [PubMed] [Google Scholar]
- 5.Petersen RC. Mild Cognitive Impairment. N Engl J Med. 2011;364:2227–2234. doi: 10.1056/NEJMcp0910237. [DOI] [PubMed] [Google Scholar]
- 6.Sperling RA, Aisen PS, Beckett LA, Bennett DA, Craft S, Fagan AM, et al. Toward defining the preclinical stages of Alzheimer’s disease: recommendations from the National Institute on Aging-Alzheimer’s Association workgroups on diagnostic guidelines for Alzheimer’s disease. Alzheimers Dement. 2011;7:280–292. doi: 10.1016/j.jalz.2011.03.003. [DOI] [PMC free article] [PubMed] [Google Scholar]
- 7.Schneider LS. The potential and limits for clinical trials for early Alzheimer’s disease and some recommendations. J Nutr Health Aging. 2010;14:295–298. doi: 10.1007/s12603-010-0066-1. [DOI] [PMC free article] [PubMed] [Google Scholar]
- 8.Weiner MW, Veitch DP, Aisen PS, Beckett LA, Cairns NJ, Green RC, et al. The Alzheimer’s Disease Neuroimaging Initiative: A review of papers published since its inception. Alzheimers Dement. 2013 Sep;9(5):e111–e194. doi: 10.1016/j.jalz.2013.05.1769. [DOI] [PMC free article] [PubMed] [Google Scholar]
- 9.Mueller SG, Weiner MW, Thal LJ, Petersen RC, Jack CR, Jagust W, et al. Ways toward an early diagnosis in Alzheimer’s disease: The Alzheimer’s Disease Neuroimaging Initiative (ADNI) Alzheimer’s Dement. 2005;1:55–66. doi: 10.1016/j.jalz.2005.06.003. [DOI] [PMC free article] [PubMed] [Google Scholar]
- 10.Petersen RC, Aisen PS, Beckett LA, Donohue MC, Gamst AC, Harvey DJ, et al. Alzheimer’s Disease Neuroimaging Initiative (ADNI): clinical characterization. Neurology. 2010;74:201–209. doi: 10.1212/WNL.0b013e3181cb3e25. [DOI] [PMC free article] [PubMed] [Google Scholar]
- 11.Folstein MF, Folstein SE, McHugh PR. “Mini-mental state”. A practical method for grading the cognitive state of patients for the clinician. J Psychiatr Res. 1975;12:189–198. doi: 10.1016/0022-3956(75)90026-6. [DOI] [PubMed] [Google Scholar]
- 12.Morris JC. The Clinical Dementia Rating (CDR): current version and scoring rules. Neurology. 1993;43:2412–2414. doi: 10.1212/wnl.43.11.2412-a. [DOI] [PubMed] [Google Scholar]
- 13.Mohs RC, Knopman D, Petersen RC, Ferris SH, Ernesto C, Grundman M, et al. Development of cognitive instruments for use in clinical trials of antidementia drugs: additions to the Alzheimer’s Disease Assessment Scale that broaden its scope. The Alzheimer’s Disease Cooperative Study. Alzheimer Dis Assoc Disord. 1997;11 (Suppl 2):S13–21. [PubMed] [Google Scholar]
- 14.Rey A. L’examen clinique en psychologie. Paris: Presses universitaires de France; 1964. [Google Scholar]
- 15.Donohue MC, Sperling RA, Salmon DP, Rentz DM, Raman R, Thomas RG, et al. Australian Imaging, Biomarkers and Lifestyle Flagship Study of Ageing, Alzheimer’s Disease Neuroimaging Initiative Alzheimer’s Disease Cooperative Study. The preclinical Alzheimer cognitive composite: measuring amyloid-related decline. JAMA Neurol. 2014;71:961–970. doi: 10.1001/jamaneurol.2014.803. [DOI] [PMC free article] [PubMed] [Google Scholar]
- 16.Pfeffer RI, Kurosaki TT, Harrah CH, Chance JM, Filos S. Measurement of functional activities in older adults in the community. J Gerontol. 1982;37:323–329. doi: 10.1093/geronj/37.3.323. [DOI] [PubMed] [Google Scholar]
- 17.Dale AM, Fischl B, Sereno MI. Cortical surface-based analysis. I. Segmentation and surface reconstruction. NeuroImage. 1999;9:179–194. doi: 10.1006/nimg.1998.0395. [DOI] [PubMed] [Google Scholar]
- 18.Freeborough PA, Fox NC, Kitney RI. Interactive algorithms for the segmentation and quantitation of 3-D MRI brain scans. Comput Methods Programs Biomed. 1997;53:15–25. doi: 10.1016/s0169-2607(97)01803-8. [DOI] [PubMed] [Google Scholar]
- 19.Jack CR, Bernstein MA, Fox NC, Thompson P, Alexander G, Harvey D, et al. The Alzheimer’s disease neuroimaging initiative (ADNI): MRI methods. J Magn Reson Imaging. 2008;27:685–691. doi: 10.1002/jmri.21049. [DOI] [PMC free article] [PubMed] [Google Scholar]
- 20.Shaw LM, Vanderstichele H, Knapik-Czajka M, Clark CM, Aisen PS, Petersen RC, et al. Cerebrospinal fluid biomarker signature in Alzheimer’s disease neuroimaging initiative subjects. Ann Neurol. 2009;65:403–413. doi: 10.1002/ana.21610. [DOI] [PMC free article] [PubMed] [Google Scholar]
- 21.Landau SM, Mintun MA, Joshi AD, Koeppe RA, Petersen RC, Aisen PS, et al. for the Alzheimer’s Disease Neuroimaging Initiative. Amyloid deposition, hypometabolism, and longitudinal cognitive decline. Ann Neurol. 2012;72:578–586. doi: 10.1002/ana.23650. [DOI] [PMC free article] [PubMed] [Google Scholar]
- 22.Donohue MC, Jacqmin-Gadda H, Le Goff M, Thomas RG, Raman R, Gamst AC, et al. Alzheimer’s Disease Neuroimaging Initiative. Estimating long-term multivariate progression from short-term data. Alzheimers Dement. 2014;10:S400–S410. doi: 10.1016/j.jalz.2013.10.003. [DOI] [PMC free article] [PubMed] [Google Scholar]
- 23.Nettiksimmons J, Harvey D, Brewer J, Carmichael O, DeCarli C, Jack CR, Jr, et al. Subtypes based on cerebrospinal fluid and magnetic resonance imaging markers in normal elderly predict cognitive decline. Neurobiol Aging. 2010;31:1419–1428. doi: 10.1016/j.neurobiolaging.2010.04.025. [DOI] [PMC free article] [PubMed] [Google Scholar]
- 24.Nettiksimmons J, DeCarli C, Landau S, Beckett L Alzheimer’s Disease Neuroimaging Initiative. Biological heterogeneity in ADNI amnestic mild cognitive impairment. Alzheimers Dement. 2014;10:511–521. doi: 10.1016/j.jalz.2013.09.003. [DOI] [PMC free article] [PubMed] [Google Scholar]
- 25.Cox DR. Partial likelihood. Biometrika. 1975;62:269–276. [Google Scholar]
- 26.Jack CR, Jr, Knopman DS, Jagust WJ, Shaw LM, Aisen PS, Weiner MW, et al. Hypothetical model of dynamic biomarkers of the Alzheimer’s pathological cascade. Lancet Neurol. 2010;9:119–128. doi: 10.1016/S1474-4422(09)70299-6. [DOI] [PMC free article] [PubMed] [Google Scholar]
- 27.Jack CR, Jr, Knopman DS, Jagust WJ, Petersen RC, Weiner MW, Aisen PS, et al. Tracking pathophysiological processes in Alzheimer’s disease: an updated hypothetical model of dynamic biomarkers. Lancet Neurol. 2013;12:207–216. doi: 10.1016/S1474-4422(12)70291-0. [DOI] [PMC free article] [PubMed] [Google Scholar]
- 28.Nettiksimmons J, Beckett L, Schwarz C, Carmichael O, Fletcher E, DeCarli C. Subgroup of ADNI normal controls characterized by atrophy and cognitive decline associated with vascular damage. Psychol Aging. 2013;28:191–201. doi: 10.1037/a0031063. [DOI] [PMC free article] [PubMed] [Google Scholar]


