

Abstract
Background & objectives:
Earlier studies have documented high prevalence of undernutrition, morbidity and mortality among Chenchus, a tribal population in Telangana and Andhra Pradesh, India. The present study was carried out to assess diet and nutritional status of Chenchus and cause of death.
Methods:
A total of 42 Chenchu villages (gudems) were covered using systematic random sampling procedure. In each gudem, all the households with at least one child under the age of five years were covered for various investigations. Weighment diet survey was carried out on a sub-sample of households. In addition, information on cause of death in the selected 42 gudems was collected for past one year using verbal autopsy method.
Results:
A total of 1396 subjects of all age groups were covered for various investigations. The intakes of food and nutrients were lower than the recommended levels. The prevalences of underweight, stunting and wasting among under five children were 42 per cent (CI: 37.9-46.1), 53 and 13 per cent, respectively, while 41 per cent (CI: 37.8-47.2) men and 42 per cent (34.4-47.8) women had chronic energy deficiency (BMI<18.5 kg/m2). Sixty eight deaths were reported during the past one year in 42 Chenchu gudems. The major causes of death were premature delivery, low birth weight, alcoholic cirrhosis of liver, accidents, snakebite and pulmonary tuberculosis.
Interpretation & conclusions:
The prevalence of undernutrition in Chenchu population was comparable with other tribal and rural counterparts in Andhra Pradesh, however, the crude death rate (11.7/1000) was higher among the Chenchus. Steps may be taken to promote consumption of balanced diet and utilization of optimal healthcare facilities to control morbidity and mortality.
Keywords: Alcoholic cirrhosis, cause of death, Chenchus, diet, undernutrition
Tribal population is generally at risk for undernutrition owing to their dependence on primitive agricultural practices, poverty, illiteracy, and poor personal and environmental hygienic practices. In addition, lack of access to healthcare, poor communication, traditional beliefs and customs aggravate the situation. Several studies1,2,3,4,5 documented that the nutritional status of tribal population is influenced by their habitat and socio-economic conditions. Recognizing the problem, the Government of India has implemented several nutrition intervention and developmental programmes under tribal sub-plan approach for the overall development of tribal population6.
Tribal population constitutes 6.6 per cent of the total population of Andhra Pradesh7. There are 12 primitive tribal groups (PTG) inhabit in the State and Chenchu is one of the PTG recognized by Government of India. Chenchus mainly inhabit Nallamala forest range in the districts of Mahaboobnagar, Nalgonda, Prakasam, Guntur, Kurnool, and Ranga Reddy8. The prevalence of morbidity and mortality was also reported to be higher as compared to other population groups9.
There are no systematic studies available on diet and nutritional status of Chenchus. Therefore, the present study was carried out with an objective to assess the current dietary pattern and nutritional status and cause of death among Chenchu tribal population in Telangana and Andhra Pradesh States, India.
Material & Methods
Study design: This community based cross-sectional study was carried out in 2013 by the National Institute of Nutrition (NIN), Hyderabad, Telangana, India. The study protocol was approved by the institutional ethics committee. Systematic random sampling procedure was adopted for selection of Chenchu gudems/villages in four districts of Telangana and Andhra Pradesh. A list of Chenchu gudems/villages was obtained from the Integrated Tribal Development Agency (ITDA) Officer, Srisailam Project. From a total of 254 gudems, 42 were selected for the present study. However, the households (HHs) having at least one under five child were selected by purposive sampling.
Assuming the prevalence of underweight among preschool children as 51 per cent10 with 95% confidence interval, with 10 per cent of relative precision, with design effect of 1.5, the estimated sample size was calculated to be 563 children. Chenchus live in small clusters numbering about 10-30 HHs called penta or gudem (village) and they are highly scattered and living mainly in four districts namely Mahaboobnagar in Telangana Sate, Kurnool, Guntur and Prakasam in Andhra Pradesh.
The exact proportion of <5 yr population in Chenchus is not known. However, the proportion of <5 yr children is about 10-12 per cent to the total population based on 2011 census11. Considering the mean household size of Chenchu gudems (villages) is about 15HHs, a decision was taken to cover 42 Chenchu gudems to include 563 children. However, only 547 children were covered from the total population of 1,861.
Data collection: Information on household socio-economic and demographic particulars including age, gender, income, family size, type of house, literacy, occupation and physical facilities such as source of drinking water, availability of separate kitchen, sanitary latrine in the house and participation of households in the public distribution system (PDS), Mahatma Gandhi National Rural Employment Guarantee Act (MGNREGA) Programme and Indira Awaas Yojana (IAY) was collected from all the selected households using a pre-coded and pre-tested questionnaire. One day weighment method of diet survey12 was carried out in every fourth household covered for anthropometry to assess the food [g/consumption unit (CU)/day] and nutrient (per CU/day) intakes at household level. It was validated at the National Institute of Nutrition and observed that one day diet survey was enough to represent the consumption of rural or tribal population in general, because their diet was almost monotonous12. Clinical examination for assessment of nutritional deficiency signs and history of current morbidity was carried by the two senior medical officers using pre-tested and validated questionnaire. Emaciation was considered, if the subjects had extreme muscle and subcutaneous fat wasting, could be due to inadequate food intake for a longer period in any age group.
Information on cause of death was also collected by the senior medical officers and anthropologist by following Verbal Autopsy Guidelines of Indian Council of Medical Research (ICMR)13. For this purpose, information on deaths occurred during the previous one year was collected from Anganwadi records, ASHA workers, village leaders, primary health centres (PHCs) and confirmed cause of death based on death records and by interacting with those household members where the death had taken place. Information on availability and utilization of health services was also collected for this population.
Statistical analysis: The data were analysed by using SPSS Window version 19.0 (SPSS Inc., USA). Univariate and bivariate analyses were carried out. The average daily intakes of different foods at household level were computed and expressed in consumption units (CU) and compared with Recommended Dietary Intakes for Indians14. The average nutrient intakes were computed using Nutritive value of Indian Foods15 and compared with Nutrient Requirements and Recommended Dietary Allowance for Indians16.
Anthropometric measurements including height (up to nearest 2 mm) and weight (up to nearest 100 g) were carried out on all available individuals in the selected households at the time of survey using standard equipment and procedures17. Height was measured using anthropometric rod and infantometer was used to measure length of the children below two years of age. Weight was measured using SECA digital weighing scale (model No. 813, Gmbh & Co., Hamburg, Germany). Nutritional status of < 5 yr children was assessed using SD (standard deviation) Classification for weight-for-age (underweight), height for age (stunting) and weight-for-height (wasting)18 using WHO child growth standards19. Children less <median - 2SD were considered as moderate undernutrition, while children with <median - 3SD were considered as severely undernourished. Nutritional status of school age children and adolescents was assessed by using age and gender specific body mass index (BMI) centiles20. Chronic energy deficiency (CED) among adults was assessed according to BMI, using suggested cut-offs of WHO consultative group for Asian populations21.
Results
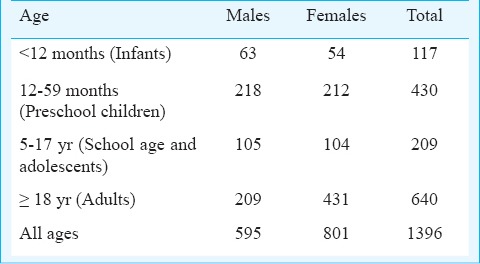
A total of 1396 subjects (males: 595; females: 801) were covered from 416 HHs in 42 Chenchu gudems (villages) for various investigations (Table I). In a sub-sample of 100 HHs, weighment diet survey was carried out. Information on cause of death during previous one year was collected from all the selected 42 Chenchu gudems.
Table I.
Chenchu population covered in the present study in 42 villages (gudems)
Socio-economic profile: Majority of the HHs (n=370, 89%) were Hindus, while the remaining (46, 11%) were Christians. About 345 (83%) of the HHs covered were nuclear families. The average family size was 4.5. Only about 166 (40%) of men and 108 (26%) women of index child were literate. About 266 (64%) households did not possess any agricultural land, while marginal, small, large farmers accounted for 99 (24%), 30 (7%), and 21 (5%), respectively. The major occupation of the men (n=387, 93%) and women (n=358, 85%) was manual labour. The average monthly per capita income (PCI) of HHs was ₹ 1,333. Contribution to income from different sources indicated that 84 per cent of income was from wages, 15 per cent from forest produce, while only one per cent was from livestock. About 291 (70%) of the families were living in pucca houses, while 116 (28%) were living in kachcha houses. The major source of drinking water was tube well (n=302 HHs, 72.6%). Only four (1%) of the HHs used liquid petroleum gas (LPG) for cooking purpose. Almost all HHs (n=408, 98%) had electricity facility and only 24 (6%) had sanitary latrine. Eighty four per cent of HHs availed Targeted Public Distribution System (TPDS).
Food intakes: At household level, the average daily consumption of dietary constituents (g/CU/day) was lower than the recommended dietary intakes (RDI) (Fig. 1). In general, cereals especially, rice formed the bulk of the diet. The average intake of cereals and millets was 443g/CU/day, which was about 96 per cent of RDI, while the intake of the pulses was 29g, which was lower than the recommended level of 40g. The consumption of green leafy vegetables was very low (4.4g), as compared to the RDI of 40g. The average intake of other vegetables as well as roots and tubers was 65 per cent of recommended level. The average consumption of milk and milk products was very low (21ml) as compared to RDI of 150ml. The consumption of fats and oils was marginally lower (18g) than the RDI of 20g, while, the average intake of sugar and jaggery was only 4g, as against the recommended level of 30g.
Fig. 1.
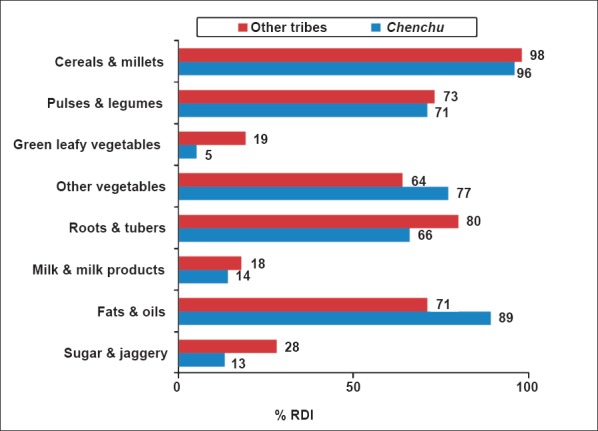
Average food intake (g/CU/day) of household as % recommended dietary intake (RDI). Source: Ref. 10.
Nutrient intakes: The median intake of nutrients at household level (per CU/day) is provided in Fig. 2. The median intake of protein was 42g lower than the RDA (60g). The intake of energy was 1959 Kcal/CU/day, as against the recommended levels of 2320 Kcal/CU/day. The energy consumption of a moderate activity tribal person (1959 kcal x 1.2 CU) was 2,351 kcal/day. Similarly, for heavy activity tribal person (1959 kcal x 1.6 CU) has been consuming 3,134 kcal/day. The intake of calcium was 225mg, which was only 37 per cent of RDA. The intake of iron (8.5mg) was far below the RDA (17mg). The intake of vitamin A was only 20 per cent of recommended level of 600 µg, while intake of riboflavin was 50 per cent of the recommended level of 1.4 mg. The intake of free folic acid was only 40µg, as against the requirement of 200 µg.
Fig. 2.
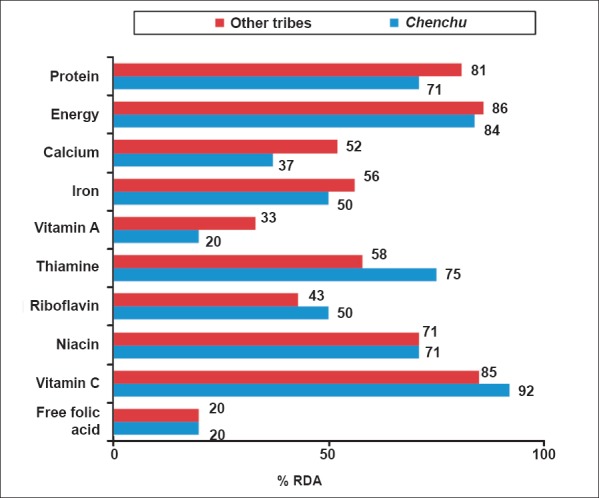
Median nutrient intake of households (per/CU/day) as % of Recommended Dietary Allowance (RDA). Source: Ref. 10.
History of morbidity: The history of current morbidity during the previous fortnight revealed that about 4 per cent (n=5) infants had fever and diarrhoea each, 2 per cent (n=2) had acute respiratory infection. Similarly, 21 (5%) of preschool children had fever and one per cent (n=4) had diarrhoea. Two per cent (n=4) of school age children and one per cent (n=64) of adults also suffered from fever.
Nutritional deficiencies: About one per cent (n=1) of the infants were emaciated and one per cent (n=1) had conjunctival xerosis. Among preschool children, 0.5 per cent (n=2) were emaciated, 0.7 per cent (n=3) had conjunctival xerosis, 0.9 per cent (n=2) each had Bitot spots and angular stomatitis. Prevalence of Bitot spots was 0.9 per cent (n=2). Among school aged children, three per cent (n=5) had angular stomatitis, two per cent (n=4) had glossitis, four per cent (n=7) had dental caries, three per cent (n=5) had dental fluorosis and two per cent (n=2) had pallor. Among adults, two per cent (n=13) had angular stomatitis, one per cent (n=6) had glossitis, five per cent (n=32) had dental caries, and two per cent (n=13) had pallor.
Nutritional status of under five children: The per cent distribution of children according to age group and gender based on weight-for-age, height-for-age, and weight-for-height by SD classification is presented in Table II. The data were compared with their other tribal counterparts of Andhra Pradesh10.
Table II.
Distribution (%) of 0-59 months children by SD classification and age
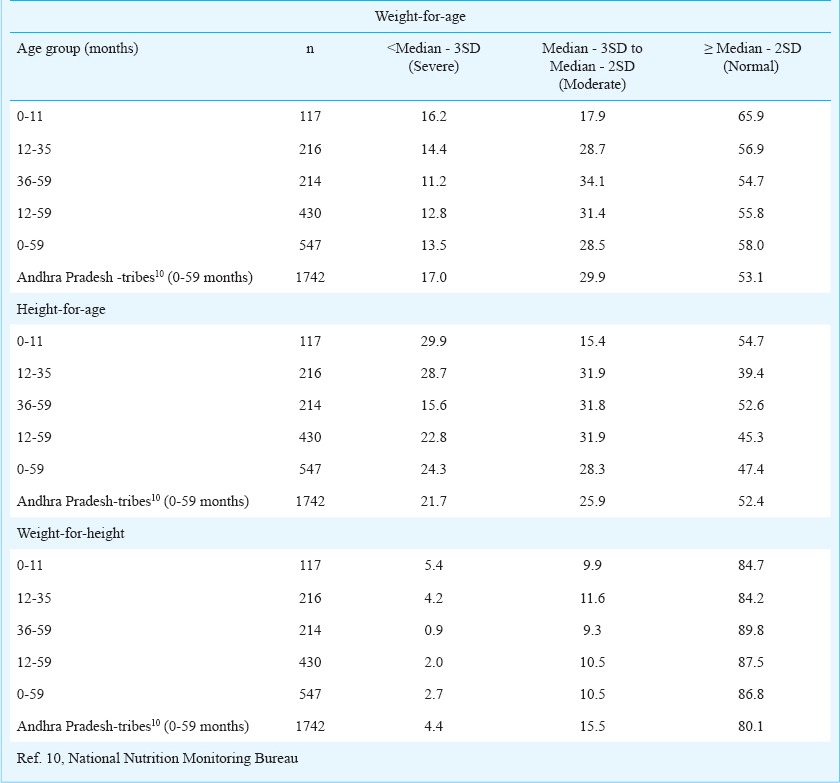
Underweight: The overall prevalence of underweight (weight-for-age <median-2SD) among under five children was 42 per cent (95% CI : 37.9-46.1). The prevalence of underweight among infants was 34 per cent, while, the prevalence of severe underweight (weight for age < median-3SD) was 16 per cent. The prevalence of underweight among 1-5 yr children was 44 per cent. The overall prevalence of underweight increased with increase in age, from about 34 per cent in the age group of <11 months, 44 per cent in 12-59 months age group. The prevalence was comparatively lower (42%) among under five children of Chenchus than the figures reported for other tribes of Andhra Pradesh (46.9%)10.
Stunting: The overall prevalence of stunting (height/length-for-age, <median-2SD) among under five children was 53 per cent. The prevalence of stunting (length-for-age, <median-2SD) among infants was about 45 per cent, with 30 per cent of severe stunting (height for age, <median-3SD). Similarly the prevalence of stunting among 1-5 yr old children was 55 per cent. The prevalence of stunting increased with increase in age, from 45 per cent in the age group of < 11 months, to 61 per cent in 12-35 months and decreased to 47 per cent in 36-59 months. The prevalence of stunting was higher (53%) as compared to their tribal counterparts of Andhra Pradesh (48%)10.
Wasting: The overall wasting among under five children was about 13 per cent. However, it was high (15.3%) among infants (weight-for-length, <median-2SD). About 5 per cent of infants in general, had severe wasting (weight-for-length, <median-3SD) indicative of severe acute malnutrition (SAM). In general, SAM decreased with increase in age i.e. from 5.4 per cent in <11 months to about one per cent in 12-59 months children. The prevalence of wasting among under five children of Chenchus was lower (13.2%) as compared to their tribal counterparts of AP (19.9%)10.
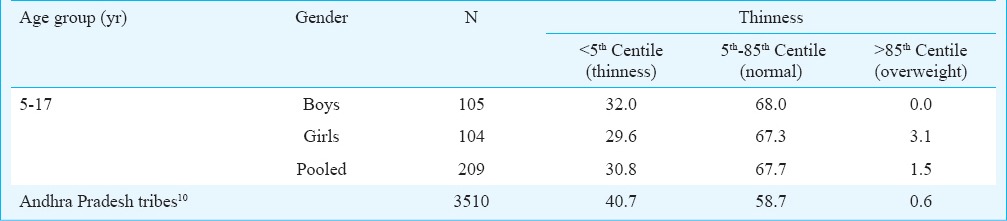
Nutritional status of school age children and adolescents: The distribution of children of 5-17 yr age group of boys and girls according to nutritional status based on BMI age and sex specific centiles (WHO reference values) are presented in Table III. The overall prevalence of thinness was 31 per cent, which was marginally higher among boys (32%) than girls (29.6%). It was also observed that the prevalence of thinness was lower (31%) than the other tribes of AP (41%).
Table III.
Distribution (%) of 5-17 yr old children according to BMI classification
Nutritional status of adults (> 19 yr): It was observed that about 41 per cent (CI: 37.8-47.2) of adult men had chronic energy deficiency (CED) (BMI<18.5 kg/m2), and 13 per cent were overweight/obese as per Asian cut-off levels suggested by WHO (BMI ≥ 23 kg/m2). The prevalence of CED was marginally higher among Chenchu men (41%) than other tribes (38.4%)10. About 42 per cent (CI: 34.4-47.8) of adult women had chronic energy deficiency (BMI < 18.5 kg/m2), 11 per cent were overweight/obese. The prevalence of CED was comparatively lower among Chenchu women (42%) than women of other tribes (49%)10.
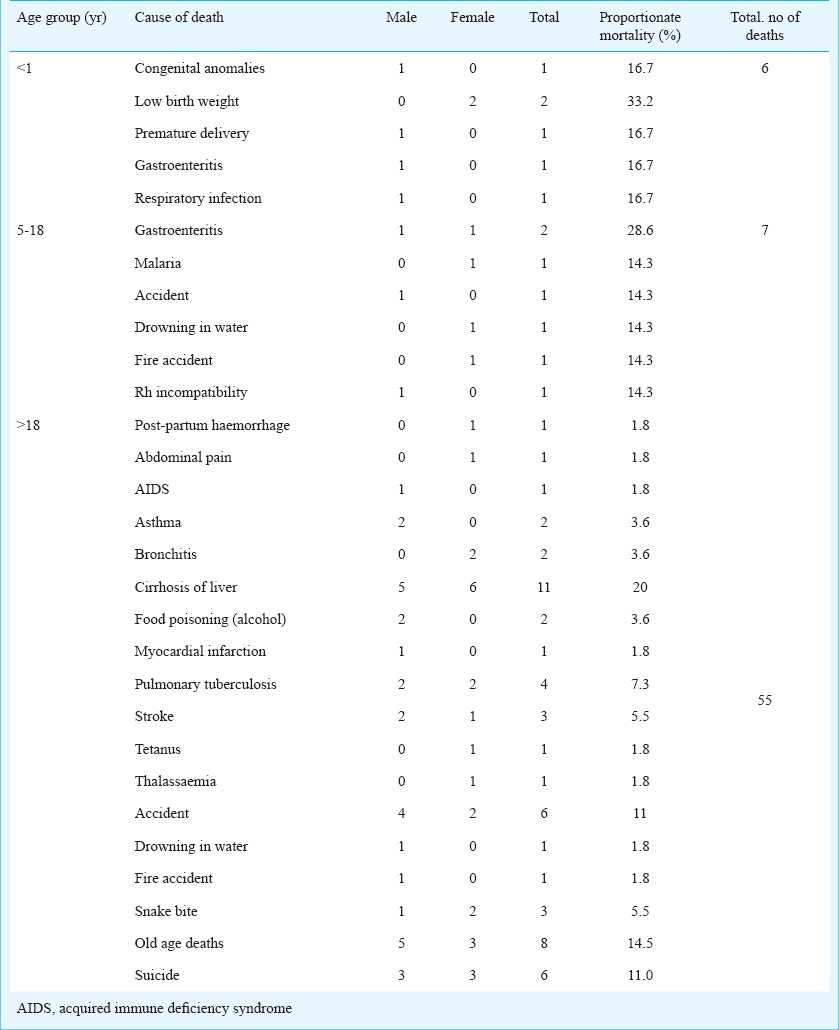
Cause of death: A total 68 deaths out of 5831 Chenchu population (11.7/1000) were reported during previous one year in the 42 Chenchu gudems (Table IV). Of the 68 deaths, six were during infancy (8.8%), seven were in school age children and adolescents (10.3%), and majority deaths were observed among men and women of >19 yr (80.9%). No deaths among preschool age children were reported. The major predisposing cause of death among newborn/infant was low birth weight (33%) based on verbal autopsy. Among school aged children and adolescents, gastroenteritis (28.6%) was major causes of death. Among men and women, major causes of death were due to alcoholic cirrhosis of liver (20%) and old age deaths (14.5%), followed by suicidal deaths, snake bites, accidents, and stroke. None of the deaths were attributed to starvation.
Table IV.
Details of mortality with cause among Chenchus during the previous one year
Information on availability and utilization of health services was also collected for this population. It was reported that most of the gudems (villages) had the distance of health facilities >5 km and most of the gudems did not have the road and transport facility.
Discussion
Tribal populations are particularly vulnerable to undernutrition because of their geographical isolation, uncertainty of food supply, lack of adequate healthcare facilities and existence of irrational belief systems and taboos. Chenchus inhabiting Nallamala forest have been primarily hunters and gatherers. They were rehabilitated in new colonies facilitated with pucca houses, roads, supply drinking water, electricity, schools, Anganwadi centres and other health facilities22. The results of the present study revealed that the dietary intake of foods barring cereals, as compared to balanced diets was generally poor and less than the recommended levels15. The extent of deficit in the intakes was relatively higher with respect to micronutrients such as vitamin A, iron, riboflavin, and free folic acid. The prevalence of underweight, stunting and wasting among <5 yr children was 42, 53, and 13 per cent, respectively. The prevalences of underweight and wasting, except stunting, were lower and comparable to their other tribals10 and rural counterparts of the State23. This showed that the current nutrition status of children was better, while chronic undernutrition was high. The stunting shows the long-term undernutrition and underweight shows the current undernutrition. Therefore, the children were suffering from undernutrition since long years which led to high stunting.
About 85 per cent of the HHs surveyed were availing one rupee kg rice scheme, 88 per cent were benefitted by National Rural Employment Guarantee Programme. It has been shown that provision of regular employment has increased their purchasing power and improved access to food through subsidised rice scheme led to better household food security. However, intake of quality and protective foods such as green leafy vegetables, pulses, milk and milk products, fats and oils, and sugar and jaggery was poor in their diets, which made them vulnerable to micronutrient malnutrition such as iron deficiency anaemia, vitamin A deficiency. The prevalence of underweight and wasting reported among <5 yr Chenchu children was low. Similarly, the CED among adults was also low, because the households have been availing a number of national nutrition and health and developmental programmes.
In the verbal autopsy, the mother reportedly informed that the major predisposing cause of death of a newborn was low birth weight. Excess alcohol consumption was very common among Chenchus. The present results showed a high prevalence of alcohol consumption leading to cirrhosis of liver, which was confirmed based on the medical reports available with the subjects. Pulmonary tuberculosis was also widely prevalent among them. Urgent measures need to be taken to curb alcohol consumption and institute healthy and balanced diet through appropriate educational strategies. The assessment of availability and utilization of health facilities showed that most of the gudems (villages) had the distance of health facilities >5 km and without any road and transport facility, which prevented the utilization of health services in emergencies by the tribals.
This study had certain limitations as the sample size was not calculated for school age children and adolescents and information on infant and young child feeding practices of mothers of <3 yr was not collected in this study. The sample size for 5-17 yr age group may not be adequate, hence, care may be taken in the interpretation of these results.
Poor health seeking behaviour for health problems might be the reasons for high morbidity seen in Chenchus. These observations highlighted the need for strengthening of existing developmental programmes aiming to improve purchasing power, making health services accessible and promote optimal utilization of health services. There is a need to focus more on maternal and child health and nutrition to control morbidity and mortality in this population.
Acknowledgment
The authors thank the Director, National Institute of Nutrition, and Director-General (DG), Indian Council of Medical Research (ICMR) for providing intramural funds to carry out the study, and the staff of Division of Community Studies for helping in data scrutiny, entry and typing of manuscripts and preparation of graphs.
References
- 1.Rao DH, Rao KM. Levels of malnutrition and socio-economic conditions among Maria Gonds. J Hum Ecol. 1994;5:185–90. [Google Scholar]
- 2.Rao DH, Brahmam GNV, Rao KM, Reddy Ch G, Rao NP. Nutrition profile of certain Indian tribes. In: Samal PK, editor. proceedings of the National Seminar on Tribal Development 1996. May 22-24. Nainital: Gyanodaya Prakasham; 1996. [Google Scholar]
- 3.Rao DH, Rao KM, Radhaiah G, Rao NP. Nutritional status of tribal preschool children in three ecological zones of Madhya Pradesh. Indian Pediatr. 1994;31:635–40. [PubMed] [Google Scholar]
- 4.Rao DH, Brahmam GN, Rao NP. Diet and nutrition survey among the Onges. Nutr News. 1989;10:1–3. [Google Scholar]
- 5.Rao KM, Kumar RH, Venkaiah K, Brahmam GN. Nutritional status of Saharia - a primitive tribe of Rajasthan. J Hum Ecol. 2006;19:117–23. [Google Scholar]
- 6.Ministry of Tribal Affairs. Tribal sub plan. Government of India, 2013-14. [accessed on April 2, 2014]. Available from: http://tribal.nic.in/Content/SpecialCentralAssistancetoTribalSubPlan.aspx .
- 7.Ministry of Tribal Affairs. Statistical profile of scheduled tribes in India. Ministry of Tribal Affairs, Statistics division, Government of India 2013. [accessed on June 15, 2014]. Available from: www.tribal.nic.in .
- 8.Vithal CP. Socio-economic transformation of a primitive tribal group: a study of Chenchus in Andhra Pradesh. Man India. 1992;72:189–206. [PubMed] [Google Scholar]
- 9.Adivasi-Tribal India. Starvation Deaths in Chenchus Adivasi of Nallamala forest, Andhra Pradesh 2009. [accessed on June 2, 2014]. Available from: www.Adivasi. Ozg.in .
- 10.Hyderabad: National Institute of Nutrition; 2009. National Nutrition Monitoring Bureau (NNMB). Diet and nutritional status of tribal population and prevalence of hypertension among adults- Report as second repeat survey. NNMB technical Report no. 25. [Google Scholar]
- 11.New Delhi: Office of the Registrar General and Census Commission, Ministry of Home Affairs, Government of India; 2011. Registrar General of India. Census 2011. [Google Scholar]
- 12.Thimmayamma BVS, Rao DH. A comparative study of oral questionnaire method with actual observation of the dietary intake of preschool children. J Nutr Diet. 1969;6:177–81. [Google Scholar]
- 13.In: Guidelines for determining cause of death. New Delhi: ICMR; 2009. Indian Council of Medical Research (ICMR). Study on causes of death by verbal autopsy in India. Appendix B; pp. 95–114. [Google Scholar]
- 14.Hyderabad: National Institute of Nutrition, ICMR; 1981. Indian Council of Medical Research (ICMR). Recommended dietary intakes for Indians. [Google Scholar]
- 15.Gopalan C, Rama Sastri BV, Balasubramanian SC, Narasinga Rao BS, Deosthale YG, Panth KS. Hyderabad: National Institute of Nutrition, Indian Council of Medical Research; 1989. Nutritive value of Indian foods. [Google Scholar]
- 16.Hyderabad: National Institute of Nutrition, (ICMR); 2010. Indian Council of Medical Research (ICMR). Nutrient requirements and recommended dietary allowances for Indians: a report of the Expert group of the Indian Council of Medical Research. [Google Scholar]
- 17.Weiner JS, Lourie JA. Oxford: Blackwell Scientific Publications; 1969. Human biology - a guide to field methods, International Biological Programme, Hand Book No. 9. [Google Scholar]
- 18.Geneva: WHO; 1983. World Health Organization (WHO). Measuring change in nutritional status: guidelines for assessing the nutritional impact of supplementary feeding programme for vulnerable groups. [Google Scholar]
- 19.Geneva: WHO; 2006. World Health Organization (WHO). Child growth standards. Length/height-for-age, weight-for-age, weight-for-length, weight for-height and body mass index for age: methods and development. [Google Scholar]
- 20.de Onis M, Onyango AW, Borghi E, Siyam A, Nishida C, Siekmann J. Development of a WHO growth reference for school-aged children and adolescents. Bull World Health Organ. 2007;85:660–7. doi: 10.2471/BLT.07.043497. [DOI] [PMC free article] [PubMed] [Google Scholar]
- 21.Melbourne: Health Communication Australia; 2000. World Health Organization Western Pacific Region (WHO)/International Association for the Study of Obesity (IASO)/International Obesity Task Force (IOTF). The Asia-Pacific perspectives: redefining obesity and its treatment. [Google Scholar]
- 22.Raju PS, Sudhakar C, Umamohan Ch. Chenchu and social transformation : a study of a primitive tribe in Kurnool district of Andhra Pradesh. Anthropologist. 2009;11:167–72. [Google Scholar]
- 23.Hyderabad: National Institute of Nutrition; 2012. National Nutrition Monitoring Bureau (NNMB). Diet and nutritional status of rural population and prevalence of hypertension & diabetes among adults and infant & young child feeding practices: Report of third repeat survey, NNMB Tech Rep No. 26. [Google Scholar]