Abstract
Background & objectives:
An increase in prevalence of hypertension has been observed in all ethnic groups in India. The objective of the present study was to estimate prevalence and determinants of hypertension among tribals and their awareness, treatment practices and risk behaviours in nine States of India.
Methods:
A community based cross-sectional study adopting multistage random sampling procedure was carried out. About 120 Integrated Tribal Development Authority villages were selected randomly from each State. From each village, 40 households were covered randomly. All men and women ≥ 20 yr of age in the selected households were included for various investigations.
Results:
A total of 21141 men and 26260 women participated in the study. The prevalence of hypertension after age adjustment was 27.1 and 26.4 per cent among men and women, respectively. It was higher in the States of Odisha (50-54.4%) and Kerala (36.7-45%) and lowest in Gujarat (7-11.5%). The risk of hypertension was 6-8 times higher in elderly people and 2-3 times in 35-59 yr compared with 20-34 yr. Only <10 per cent of men and women were known hypertensives and more than half on treatment (55-68%). Men with general and abdominal obesity were at 1.69 (CI: 1.43-2.01) and 2.42 (CI: 2.01-2.91) times higher risk of hypertension, respectively, while it was 2.03 (CI=1.77-2.33) and 2.35 (CI 2.12-2.60) times higher in women. Those using tobacco and consuming alcohol were at a higher risk of hypertension compared with the non users.
Interpretation & conclusions:
The study revealed high prevalence of hypertension among tribals in India. Age, literacy, physical activity, consumption of tobacco, alcohol and obesity were significantly associated with hypertension. Awareness and knowledge about hypertension and health seeking behaviour were low. Appropriate intervention strategies need to be adopted to increase awareness and treatment practices of hypertension among tribals.
Keywords: Hypertension, obesity, prevalence, risk behaviours, tribal men and women, wealth index
Hypertension (HTN) is emerging as a public health problems in various ethnic groups in the developing countries like India1,2. Prevalence of hypertension has been found to be increasing in epidemic proportions in urban, rural and tribal population of India3. High blood pressure (BP) is one of the most important modifiable risk factors for cardiovascular diseases, which accounts for one in every eight deaths world wide4. Total deaths due to cardiovascular diseases were 9.1 million in developing countries and 1.5 million in India5. It has been predicted that by 2020, there would be 111 per cent increase in cardiovascular deaths in India. HTN is directly responsible for 57 per cent of all stroke deaths and 24 per cent of all coronary heart diseases (CHD) in India5.
In analysis of worldwide data for the global burden of HTN, 21 per cent of Indian men and women were found to suffer from HTN6. Information on prevalence of hypertension is available for urban and rural population for many States in India, but the same is not available among tribals. Therefore, the present study was undertaken to assess the prevalence of hypertension, and knowledge, treatment practice and risk behaviours of tribal men and women ≥20 yr in nine major States in India during 2008-2009 by National Nutrition Monitoring Bureau (NNMB)7.
Material & Methods
Study design: It was a community based cross-sectional study carried out by the National Nutrition Monitoring Bureau (NNMB) by adopting multi-stage random sampling procedure. The study was carried out in 120 Integrated Tribal Development Authority (ITDA) villages8 in nine States viz. Andhra Pradesh, Gujarat, Karnataka, Kerala, Maharashtra, Madhya Pradesh, Odisha, Tamil Nadu and West Bengal during 2007-2008.
Selection of villages: Since it was a repeat survey, 120 villages were covered in each State, therefore, 90 villages were selected randomly from the list of villages already covered at baseline (1985-1987)9 and 1st repeat survey (1998-1999)10, and the remaining 30 villages were selected as new villages from the Census 200111.
Selection of households: From each of the selected villages, 40 tribal households (HHs) were covered randomly. If more than one tribe was present in the selected village, total number of HHs in each tribe were enumerated and 40 HHs were covered based on the probability proportion to size (PPS) of HHs from each tribe residing in the selected village.
Selection of subjects: All the available subjects at the time of survey in selected households were covered for personal profile, anthropometry, clinical examination and history of current morbidity. 24 h recall method of diet survey was carried out in one fourth of HHs covered for anthropometry using systematic random sampling procedure. All men and women ≥20 yr of age were covered for blood pressure measurement and information on knowledge and treatment practices about hypertension and diabetes.
Sample size: An earlier study revealed that the overall prevalence of hypertension among the rural men and women (≥20 yr) was about 10 per cent12. Therefore, assuming the prevalence of hypertension among tribal population as 10 per cent, with 95% confidence interval and 20 per cent relative precision, with design effect of 2, the sample size required for each gender was 1729 (1730) in each State.
Knowledge & treatment practices about hypertension: Information on knowledge and treatment practices and risk behaviours was collected from all those men and women covered for measurement of blood pressure using pre-tested and validated questionnaire interviews.
Food and nutrient intakes: Food and nutrient intakes were assessed in one fourth households covered for socio-economic and anthropometry using systematic random sampling procedure.
Training and standardization of investigators: In each NNMB State, the team consisted of a medical officer, a social scientist, a nutritionist and a laboratory technician. All the teams of nine NNMB States were trained in various nutrition methodologies adopted in the present study and standardized them at National Institute of Nutrition (NIN), Hyderabad, for four weeks. Maximum care was taken to achieve inter- and intra-individual variations at acceptable level. Continuous supervision, monitoring and data quality checks were also carried out by the scientists and technical staff from the Division of Community studies, NIN, Hyderabad.
The NNMB Steering committee (constituted with public health specialists, biostatisticians, social scientists, nutritionists and physicians) approved the study protocol and reviewed its progress, quality of data collection and analysis. Ethical clearance was obtained from Institutional Ethical Review Board, National Institute of Nutrition, Hyderabad.
Data collection: The trained investigators collected information on socio-economic and demographic variables in all the selected HHs by using pretested and standardized questionnaires. Anthropometric variables such as weight (kg) nearest to 100 g, height (cm) nearest 0.2 cm, waist and hip circumference (cm) nearest 0.5 cm were measured using standard equipment and procedure13. Clinical examination was carried out to assess nutritional deficiency signs and history of current morbidity was collected in all individuals covered for anthropometry. Waist and hip circumferences were measured14. Three measurements of blood pressure at five minutes intervals in reclining position were taken by mercury sphygmomanometer in men and women ≥20 yr on all the available individuals at the time of survey to avoid selection bias. Information on awareness and practices, including risk behaviours like consumption of alcohol and tobacco use was collected using a pre-tested and validated in-depth interview questionnaire in all those covered for BP measurement. The subjects with high BP were counselled to restrict salt and fat intake in their diet and cesation of smoking and abstinence from alcohol and regular practices of physical activity, and were advised to contact the physician for confirmation of diagnosis and treatment, if required. Diet survey was carried out by 24 h recall method15 to assess food and nutrient intakes of individuals by age, gender, physical activity and physiological status. The response rate was very good (96%) for collection of household information, while the response rate for coverage of individuals was lower (91%) as compared to HHs coverage.
Statistical analysis: Various nutrient intakes were categorized in to tertiles as lowest, middle and highest. The data were entered into the computers and consistency checks were carried out and analysed using SPSS Window (19.0) version (SPSS, Inc., USA). The continuous variables followed normal distribution. Univariate analyses were carried wherever required. Hypertension or high BP is defined as mean systolic blood pressure (SBP) ≥140 mmHg and/or diastolic blood pressure (DBP) ≥90 mmHg as per the recommendations of Joint National Committee (JNC) VII or known hypertensives16. Average of three BP measurements was taken as current blood pressure. Since age standards for tribal population were not available, age standardized prevalence rates and means for SBP and DBP for all the States were computed using WHO age standards17.
Body mass index (BMI) < 18.5 kg/m2 was classified as chronic energy deficiency (CED), 18.5-24.99 kg/m2, categorized as normal, BMI ≥ 25-29.99 kg/m2 as overweight and ≥30 kg/m2 categorized as obese18.
Waist circumferences ≥102 cm in men and ≥88 cm in women were classified as having abdominal obesity19. Waist hip ratios of ≥0.95 for men and ≥0.80 for women were classified as having truncal obesity20. The average daily consumptions of various foods and nutrients were computed as described earlier21.
Mean group differences were evaluated by analysis of variance (ANOVA). The Pearson correlation coefficients were determined for age with BP levels. Associations between hypertension and socio-economic, demographic variables and nutrient intakes at tertiles levels were tested by age adjusted odds ratio (OR). Stepwise logistic regression analysis was carried out between dependant (hypertension) and independent variables, and those found significant in bivariate analysis at P< 0.05 were included in the logistic regression model and the main variables included in the model were socio-economic and demographic factors, obesity, nutrients and risk behaviours.
Household wealth was assessed using principal components analysis (PCA). The variables included in the factor analysis were household socio-demographic variables such as type of house, occupation, per capita income as quintiles, source of drinking water, type of fuel used for cooking, electricity connection and sanitary latrine that are related to wealth status. Each household asset for which information was collected, was assigned a weight or factor score generated through PSA. The resulting asset scores were standardized in relation to a standard normal distribution with a mean of ‘0’ and a standard deviation of ‘1’. The first component which explained most of the variance (23%) in the observed set of variables included type of house, per-capita income, sanitary latrine and electricity connection. This weighed the heaviest, was in positive direction and was expected to reflect an unobserved dimension, within the given model ‘wealth’22,23. The regression scores from the first component were used to create an index that was divided into quintiles and then grouped as highest 20 per cent, middle 40 per cent and lowest 40 per cent24.
Results
A total of 47,401 [men (44.6%) and women (55.4%)] 20 yr were covered in the study. The coverage was not uniform for all the variables due to non-response; therefore, the number covered for each variable was marginally different. Age-wise mean and SD for SBP and DBP are provided in Table I. The age standardized mean SBP was 126.3 mmHg in men and 126.2 mm Hg in women, while the age standardized mean DBP was 79.9 mmHg and 79.1 mmHg among men and women, respectively. The mean systolic BP significantly (P< 0.001) increased with increase of age, 117-120 mmHg at 20-30 yr and 144-145 mmHg at the age 80 yr and above. Regression analysis showed a significant association between BP and age. Regression coefficient (b) was significant in both the groups and showed that there was an increase in systolic BP by 0.41 mmHg in men and by 0.55 mmHg in women, while in the diastolic BP by 0.18 mmHg in men and by 0.22 mmHg in women with every 10 yr increase in age.
Table I.
Blood pressure levels (mm Hg) and prevalence of hypertension according to age and gender
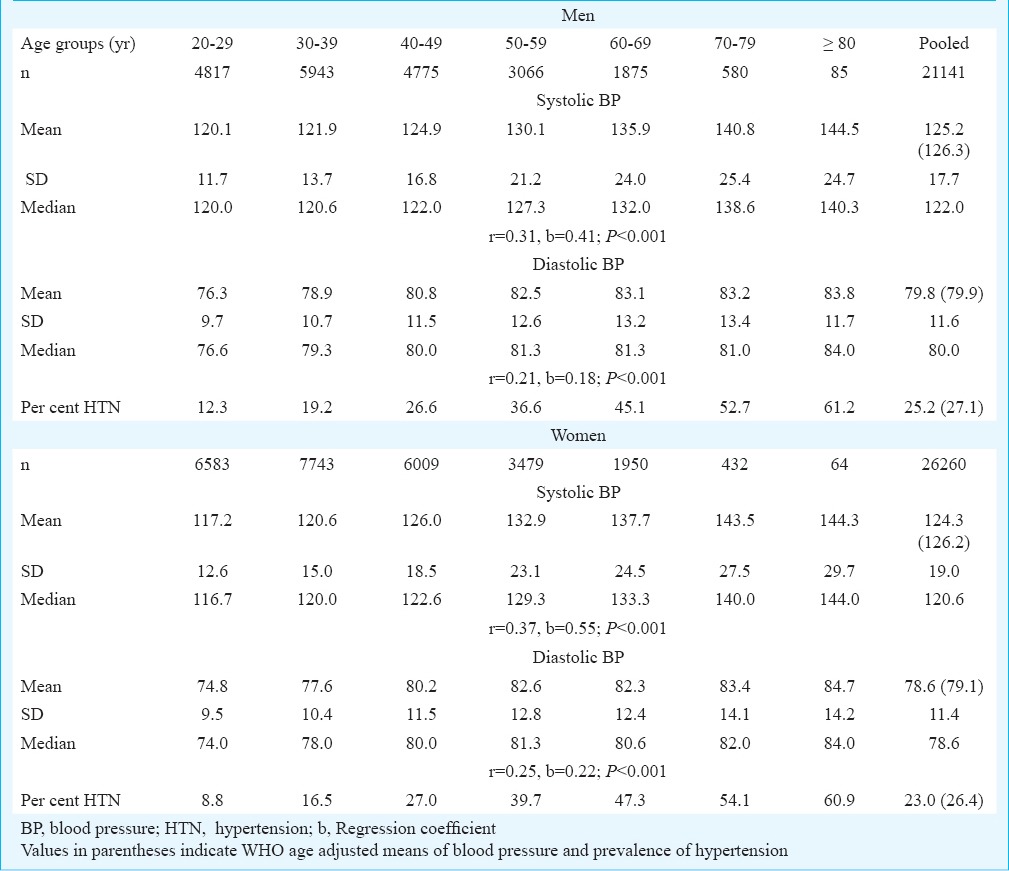
The age standardized prevalence of hypertension was 27.1 per cent in men and 26.4 per cent in women and increase in hypertension was observed with increase in age. Age adjusted State-wise prevalence of hypertension for men and women are provided in the Figure. The prevalence of hypertension among men and women was higher in Odisha (50-54%) and Kerala (37-45%) and lowest in Gujarat (7-11%). As per the JNC VII criteria, about 42 and 39 per cent were pre-hypertensive, 18 and 16 per cent in stage I hypertension and 8 and 7 per cent were in stage II hypertension among men and women, respectively.
Fig.
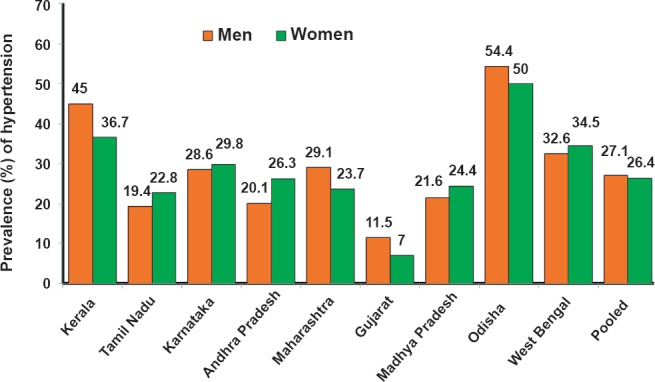
Age adjusted State-wise prevalence of hypertension among tribal men and women aged ≥20 yr in nine States of India.
Age adjusted odds ratios with 95% confidence interval (CI) for hypertension and different variables are presented in Table II. The risk of hypertension was significantly (P< 0.001) increased with increase of age, 2.3-3.2 and 5.5-7.9 times higher in 35-59 yr and > 60 yr in men and women, respectively, compared with 20-34 yr, and the risk of hypertension was significantly higher (P< 0.05) among men (OR: 1.41) and women (OR: 1.10) who had education levels 9th standard and above compared with low literate and up to 8th standard only. Risk of hypertension was significantly higher (P< 0.001) in those (both men and women) having sedentary lifestyle, using tobacco, and consuming alcohol (Table II). Risk of hypertension was observed to be significantly (P< 0.05) higher after age adjustment among men and women whose nutrient intakes were in lower and middle tertiles, especially in case of protein, fats, and sugar and jaggery compared with those having higher intakes. The risk of hypertension was significantly (P< 0.001) higher among overweight and obese men (OR: 1.69) and women (OR: 2.03), and those with abdominal (OR: men: 2.42; women: 2.35) and central obesity (OR: men: 1.78; women: 2.34) compared with normals.
Table II.
Odds ratios (OR) of hypertension with different variables of tribal men and women of ≥20 yr after age adjustment in nine states of India
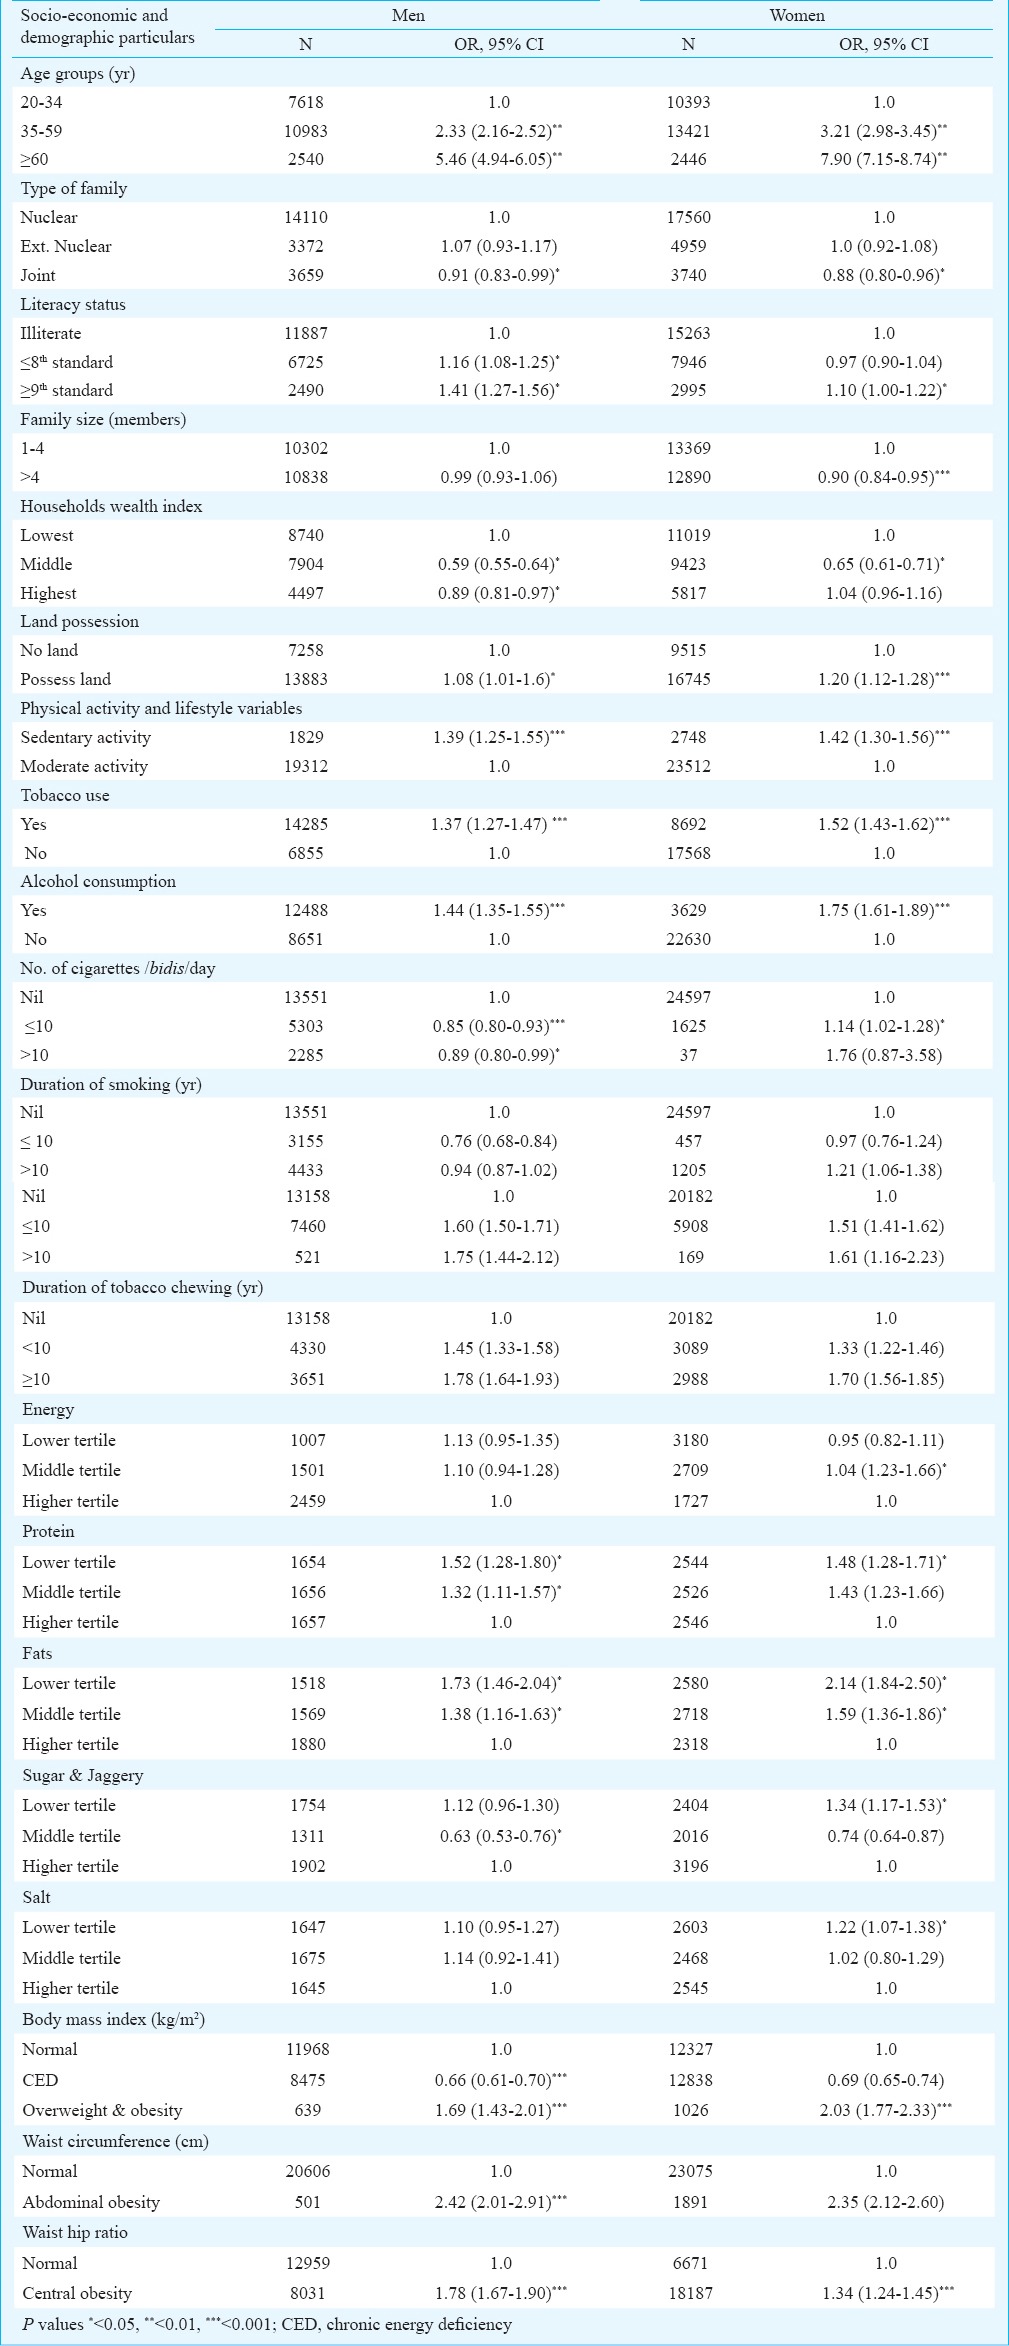
Odds ratios for hypertension were lower among individuals residing in joint families (OR: men: 0.91; women: 0.88) and with higher family size (OR: women: 0.90). Similarly, the odds of hypertension was significantly lower among men and women, who had middle (OR: men: 0.59; women: 0.65) and higher levels (OR: men: 0.89) wealth index compared to lower wealth index individuals (Table II).
Stepwise logistic regression analysis was carried out between socio-economic, demographic factors, risk behaviours and obesity as independent and hypertension as dependant variable, to know the determinants of hypertension (Table III). It was observed that the risk of hypertension was 2.20 (2.03-2.38) and 5.28 (4.74-5.89) times higher among 35-59 and ≥60 yr old men, respectively compared with 20-35 yr. The risk of hypertension was 1.2 (1.07-1.33) times higher among men, who had completed education 9th standard and above as compared to illiterate. Similarly, the odds of hypertension was higher (OR: 1.11 to 1.20) among men and women, who had possession of land. The odds of hypertension were lower among men and women with family size ≥4.
Table III.
Stepwise logistic regression model of hypertension with different variables
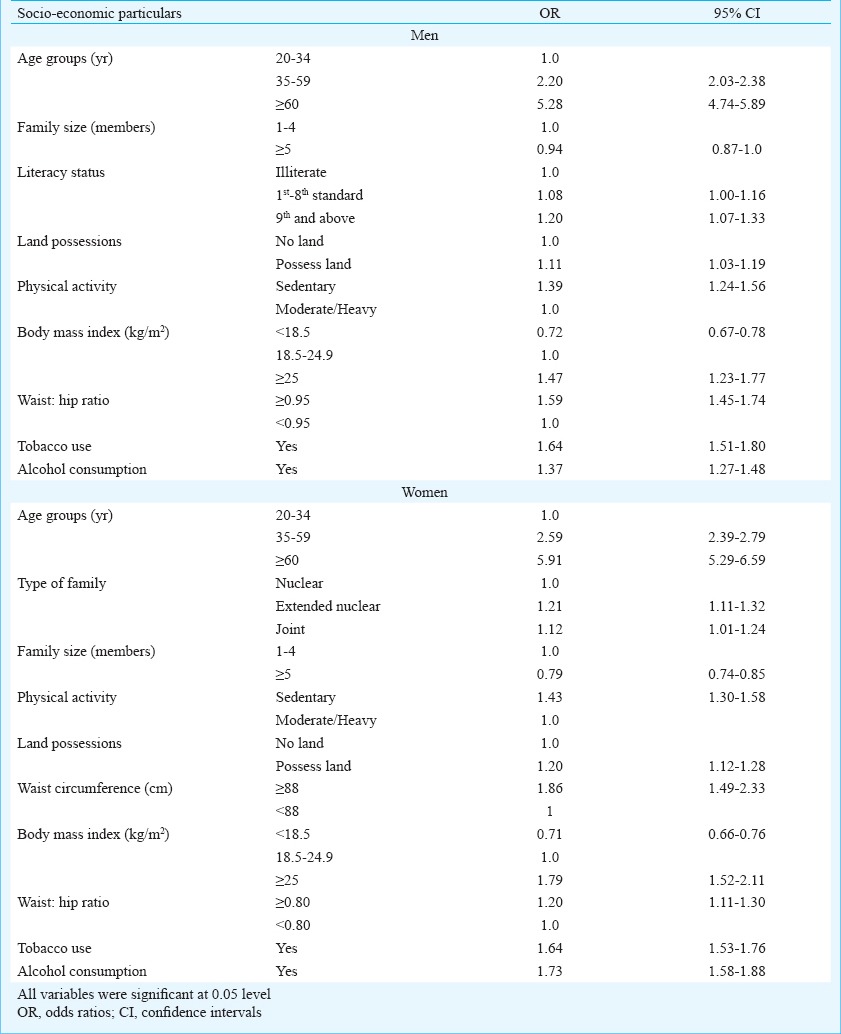
The risk of hypertension was 1.39 times (1.24-1.56) higher among sedentary workers as compared to moderate or heavy workers. Overweight and obesity (BMI ≥ 25 kg/m2) had 1.47 times (1.23-1.77) higher risk of hypertension in men and 1.79 times (1.52-2.11) in women compared with normal individuals, while central obesity (waist: hip ratio ≥0.95) was 1.59 times (1.45-1.74) higher in men and 1.20 (1.11-1.30) times higher in women compared with normal men and women, respectively. Risk of hypertension was 1.64 times higher in men and women who used tobacco compared with non-users. Risk of hypertension was 1.37 times higher in men and 1.73 times in women consuming alcohol compared with non users (Table III).
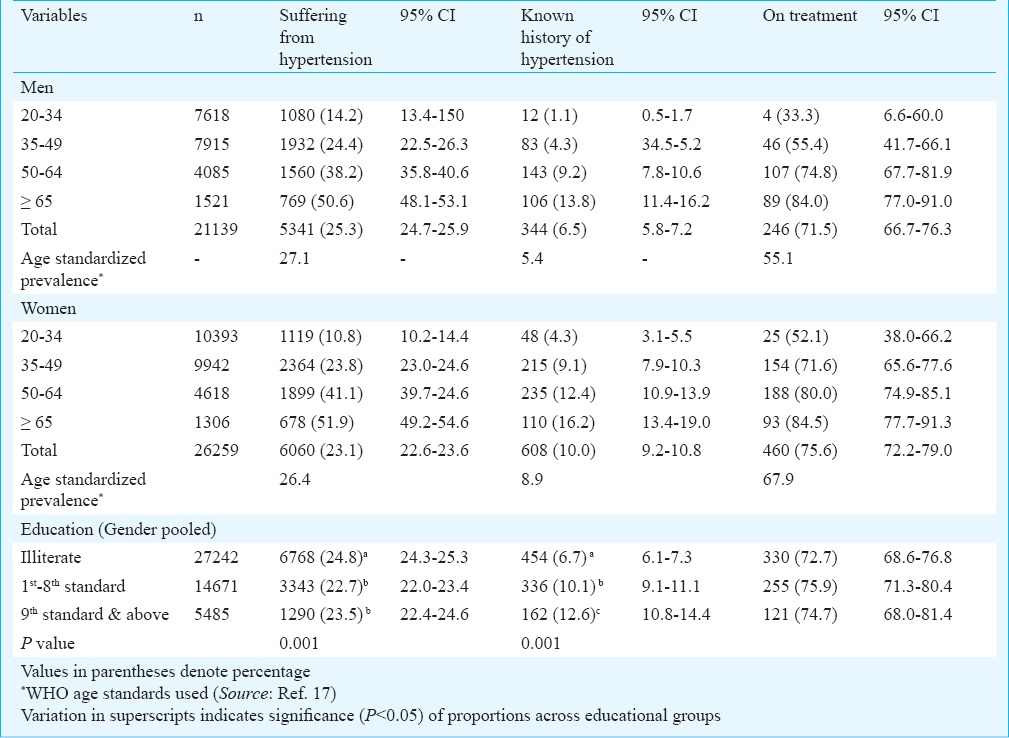
Of the 27 per cent men and 26 per cent women currently suffering from hypertension (after age adjustment), only 5 per cent men and 9 per cent women knew their hypertensive status and the proportion increased with increase in age, 14.2 per cent (20-34 yr) to 50.6 per cent (≥ 65 yr). Among known hypertensive, 55 per cent and 68 per cent women were on treatment and the proportion increased with increase in age, 33.3 per cent (20-34 yr) to 84 per cent (≥ 65 yr). Education levels were inversely associated with the hypertension. However, known hypertensive were more educated men and women compared to illiterates (Table IV).
Table IV.
History of awareness and practices about hypertension among men and women aged ≥20 yr
Discussion
The present study was carried out in 47401 tribal men and women from nine major States in India. In general, there was a high prevalence of hypertension in Indian tribal men and women and there were variations in the prevalence of hypertension among the States. The important risk factors for the hypertension were age, higher education, substance abuse and sedentary lifestyle.
The present study revealed high prevalence of hypertension among tribal men and women as has been observed among Indian tribal1, rural2,25 and urban population12. It also revealed that the awareness and treatment seeking behaviour among these population groups were poor and risk behaviours like consumption of alcohol and tobacco use were also high. High prevalence of hypertension has been reported in urban population in India earlier26. High prevalence of hypertension has been observed in other countries in South East Asia region (22-45%)27, Latin American cities (9-47%)28, Asia Pacific Region (5-47%)29, Sub Saharan Africans (19-38%)30 and it was lower in South African adults (10.4%)31. The prevalence of hypertension was higher in the States of Kerala and Odisha as was seen in other studies32,33. Prevalence of hypertension increased with age and was higher among elderly population; similar observation was reported in other studies24,34,35.
Even though 26-27 per cent of subjects were suffering from hypertension, only 5-9 per cent of them were aware of their hypertension status. Among the known hypertensives, about two thirds were on treatment. The awareness level was low among young adults and it increased with increase in age. Low rates of awareness among the population may be due to high rate of illiteracy.
The high prevalence of hypertension among young adults is an indication for the healthcare providers to implement educational and preventive strategies to reduce the burden of hypertension in the society. High prevalence of hypertension among elderly population is a serious concern and it is an independent risk factor for cardiovascular diseases, stroke, end-stage renal and peripheral vascular disease36. Epidemiologic studies have shown conflicting results on association between hypertension and intakes of various nutrients like protein37,38 and carbohydrates37,39. The positive association between carbohydrate intake and hypertension may be due to high glycaemic index for carbohydrates40. In the present study, a high risk of hypertension was observed among the individuals whose nutrient (protein, fats and sugar & jaggery) intakes were in lower tertiles. This could be attributed to lower intake of majority of nutrients as compared to the recommended dietary allowances (RDA)41.
Multivariate regression analysis showed that age, education, HH wealth index, tobacco use, alcohol consumption, high BMI, abdominal and truncal obesity as risk factors for hypertension among tribal men and women in India. Higher risk of hypertension among illiterate tribal women was similar with findings reported by other studies37,38,39,40,41,42. Although no significant association was observed between socio-economic status and hypertension in the present study, an earlier study has reported significant association between hypertension and low socioeconomic status43.
The study had several limitations. It was carried out only in nine major Indian States; however, major tribal groups of North Eastern region were not covered in the present study. Generally, tribals consume foods like wild tubers and flowers, for which information is not available in nutrition composition tables. Thus, information of these foods was not reflected in the consumption of various nutrients.
In conclusion, prevalence of hypertension was high among tribal men and women in India, especially in the State of Kerala and Odisha. The prevalence of hypertension was higher among elderly people, illiterates, and tobacco and alcohol consumers. The low levels of awareness on hypertension and poor health seeking behaviours of tribals necessitate initiation of appropriate medical and social interventions. This would be useful for the prevention and control of cardiovascular morbidity and mortality in the community.
Acknowledgment
The authors acknowledge the financial support provided by the Indian Council of Medical Research (ICMR), New Delhi, India. Authors thank the former Director of National Institute of Nutrition, Dr B. Sesikeran, for support and co-operation, and the staff of NNMB-CRL and Division of Community Studies for data cleaning and entry.
References
- 1.Rizwan SA, Kumar R, Singh AK, Kusma YS, Yadav K, Pandav CS. Prevalence of hypertension in Indian Tribes: A systematic review and meta-analysis of observational studies. PLoS One. 2014;9:e95896. doi: 10.1371/journal.pone.0095896. [DOI] [PMC free article] [PubMed] [Google Scholar]
- 2.Anchala R, Kannuri NK, Pant H, Khan H, Franco OH, Di Angelantonio E, et al. Hypertension in India: a systematic review and meta-analysis of prevalence, awareness, and control of hypertension. J Hypertens. 2014;32:1170–7. doi: 10.1097/HJH.0000000000000146. [DOI] [PMC free article] [PubMed] [Google Scholar]
- 3.Gupta R, al-Odat NA, Gupta VP. Hypertension epidemiology in India: meta-analysis of 50 year prevalence rates and blood pressure trends. J Hum Hypertens. 1996;10:465–72. [PubMed] [Google Scholar]
- 4.Geneva: WHO; 2002. World Health Organization (WHO). World health report (2002) [Google Scholar]
- 5.Murray CJL, Lopez AD. Mortality by cause for eight regions of the world: Global Burden of Disease Study. Lancet. 1997;349:1269–76. doi: 10.1016/S0140-6736(96)07493-4. [DOI] [PubMed] [Google Scholar]
- 6.Keamey PM, Whelton M, Renolds K, Muntner P, Whelton PK, He J. Global burden of hypertension: analysis of worldwide data. Lancet. 2005;365:217–23. doi: 10.1016/S0140-6736(05)17741-1. [DOI] [PubMed] [Google Scholar]
- 7.National Nutrition Monitoring Bureau (NNMB 2009). Diet and Nutritional status of tribal population and prevalence of hypertension among adults. Report on 2nd Tribal Repeat surveys (2008-09). National Institute of Nutrition, Indian Council of Medical Research, Hyderabad, NNMB Technical Report No 25. [accessed on September 15, 2014]. Available from: http://nnmbindia.org/downloads.html .
- 8.Integrated Tribal Development Authority (ITDA) Areas. Ministry of Tribal Welfare, Government of India. [accessed on March 28, 20014]. Available from: http://tribal.nic.in/Content/Integrated Tribal Development ITDPsITDA.aspx .
- 9.National Nutrition Monitoring Bureau (NNMB 1989). Diet and Nutritional status of Tribal population. Report on Baseline Tribal surveys (1985-87). National Institute of Nutrition, Indian Council of Medical Research, Hyderabad. [accessed on September 15, 2014]. Available from: http://nnmbindia.org/downloads.html .
- 10.National Nutrition Monitoring Bureau (NNMB 2000). Diet and Nutritional status of Tribal population (1998-99). National Institute of Nutrition, Indian Council of Medical Research, Hyderabad, NNMB Technical Report No 19. [accessed on September 15, 2014]. Available from: http://nnmbindia.org/downloads.html .
- 11.New Delhi: Office of the Registrar General of India and Census Commissioner, India; 2001. Census of India 2001. [Google Scholar]
- 12.Gupta R. Trends in hypertension epidemiology in India. J Hum Hypertens. 2004;18:73–8. doi: 10.1038/sj.jhh.1001633. [DOI] [PubMed] [Google Scholar]
- 13.Taylor RW, Keil D, Gold EJ, Williams SM, Goulding A. Body mass index, waist girth and waist-to-hip ratio as indexes of total and regional adiposity in women: evaluation using receiver operating characteristic curves. Am J Clin Nutr. 1998;67:44–9. doi: 10.1093/ajcn/67.1.44. [DOI] [PubMed] [Google Scholar]
- 14.Han TS, Van Leer EM, Seidell JC, Lean MEJ. Waist circumference action levels in the identification of cardiovascular risk factors; prevalence study in random sample. BMJ. 1995;311:1401–10. doi: 10.1136/bmj.311.7017.1401. [DOI] [PMC free article] [PubMed] [Google Scholar]
- 15.Thimmayamma BVS, Rao DH. A comparative study of oral questionnaire method with actual observation of the dietary intake of preschool children. J Nutr Dietet. 1969;6:177–81. [Google Scholar]
- 16.Chobanian AV, Bakris GL, Black HR, Cushman WC, Green LA, Izzo JL, Jr, et al. The seventh report of the Joint National Committee on Prevention, Detection, Evaluation, and Treatment of High Blood Pressure: the JNC 7 report. JAMA. 2003;289:2560–72. doi: 10.1001/jama.289.19.2560. [DOI] [PubMed] [Google Scholar]
- 17.Ahmad OB, Boschi-Pinto C, Lopez AD, Murray C, Mie Inoue RL. WHO age standardization rates. Discussion Paper Series: No. 31. World Health Organization. 2001. [accessed on December 15, 2014]. Available from: http://www.who.int/healthinfo/paper31.pdf .
- 18.James WP, Ferro-Luzzi A, Waterlow JC. Definition of chronic energy deficiency in adults. Report of a working party of the International Dietary Energy Consultative group. Eur J Clin Nutr. 1988;42:961–81. [PubMed] [Google Scholar]
- 19.Willet WC, Dietz WH, Colditz GA. Guidelines for healthy weight. N Engl J Med. 1999;341:427–34. doi: 10.1056/NEJM199908053410607. [DOI] [PubMed] [Google Scholar]
- 20.WHO Expert Consultation. Waist Circumference and Waist- Hip Ratio Report of a WHO Expert Consultation GENEVA. 2008. Dec 8-11, [accessed on October 3, 2014]. Available from: http://whqlibdoc.who.int/publications/2011/9789241501491_eng.pdf .
- 21.Gopalan C, Ramasastry BV, Balasubramanyam SC, Narasinga Rao BS, Deosthale Y, Panth KC. Hyderabad: National Institute of Nutrition; 1990. Nutritive value of Indian foods. [Google Scholar]
- 22.Filmer D, Pritchett LH. Estimating wealth effects without expenditure data - or tears: an application to educational enrolments in states of India. Demography. 2001;38:115–32. doi: 10.1353/dem.2001.0003. [DOI] [PubMed] [Google Scholar]
- 23.Rutstein, Shea O, Kiersten Johnson. The DHS Wealth Index. DHS Comparative Reports No. 6. ORC Macro Calverton, Maryland USA. 2004. [accessed on May 3, 2015]. Available from: http://www.childinfo.org/files/DHS_Wealth_Index_%28DHS_Comparative_Reports%29.pdf .
- 24.Manimunda SP, Sugunan AP, Benegal V, Balakrishna N, Rao MV, Pesala KS. Association of hypertension with risk factors & hypertension related behaviour among the aboriginal Nicobarese tribe living in Car Nicobar Island, India. Indian J Med Res. 2011;133:287–93. [PMC free article] [PubMed] [Google Scholar]
- 25.Gupta R, Sharma AK. Prevalence of hypertension and subtypes in an Indian rural population: clinical and electrocardiographic correlates. J Hum Hypertens. 1994;8:823–9. [PubMed] [Google Scholar]
- 26.Gupta R, Guptha S, Gupta VP, Prakash H. Prevalence and determinants of hypertension in the urban population of Jaipur in western India. J Hypertens. 1995;13:1193–200. doi: 10.1097/00004872-199510000-00014. [DOI] [PubMed] [Google Scholar]
- 27.Krishnan A, Garg R, Kahandaliyanage A. Hypertension in South East Asia region: an overview. Regional Health Forum. 2013;17:7–14. [Google Scholar]
- 28.Hernández-Hernández R, Silva H, Velasco M, Pellegrini F, Macchia A, Escobedo J, et al. Hypertension in seven Latin American cities: the Cardiovascular Risk Factor Multiple Evaluation in Latin American (CARMELA) study. J Hypertens. 2010;28:24–34. doi: 10.1097/HJH.0b013e328332c353. [DOI] [PubMed] [Google Scholar]
- 29.Chiang CE, Chen CH. Hypertension in the Asia-Pacific region. J Hum Hypertens. 2008;22:441–3. doi: 10.1038/jhh.2008.17. [DOI] [PubMed] [Google Scholar]
- 30.Hendriks ME, Wit FW, Roos MT, Brewster LM, Akande TM, de Beer IH, et al. Hypertension in Sub-Saharan Africa: Cross-sectional surveys in four rural and urban communities. PLoS One. 2012;7:e32638. doi: 10.1371/journal.pone.0032638. [DOI] [PMC free article] [PubMed] [Google Scholar]
- 31.Hasumi T, Jacobsen KH. Hypertension in South African adults: results of a nationwide survey. J Hypertens. 2012;30:2098–104. doi: 10.1097/HJH.0b013e328357c018. [DOI] [PubMed] [Google Scholar]
- 32.Zachariah MG, Thankappan KR, Alex SC, Sarma PS, Vasan RS. Prevalence, correlates, awareness, treatment, and control of hypertension in a middle-aged urban population in Kerala. Indian Heart J. 2003;55:245–51. [PubMed] [Google Scholar]
- 33.Vimala A, Ranji SA, Jyosna MT, Chandran V, Mathews SR, Pappachan JM. The prevalence, risk factors and awareness of hypertension in an urban population of Kerala (South India) Saudi J Kidney Dis Transpl. 2009;20:685–9. [PubMed] [Google Scholar]
- 34.Kalavathy MC, Thankappan KR, Sarma PS, Vasa RS. Prevalence, awareness, treatment and control of hypertensionin an elderly community based sample in Kerala, India. Natl Med J India. 2000;13:9–15. [PubMed] [Google Scholar]
- 35.Hypertension Study Group. Prevalence, awareness, treatment and control of hypertension among the elderly in Bangladesh and India: a multicentre study. Bull World Health Organ. 2001;79:490–500. [PMC free article] [PubMed] [Google Scholar]
- 36.Park JB, Kario K, Wang JG. Systolic hypertension: an increasing clinical challenge in Asia. Hypertens Res. 2015;38:227–36. doi: 10.1038/hr.2014.169. [DOI] [PMC free article] [PubMed] [Google Scholar]
- 37.Stamler J, Caggiula A, Grandits GA, Kjelsberg M, Cutler JA. Relationship to blood pressure of combinations of dietary macronutrients. Findings of the Multiple Risk Factor Intervention Trial (MRFIT) Circulation. 1996;94:2417–23. doi: 10.1161/01.cir.94.10.2417. [DOI] [PubMed] [Google Scholar]
- 38.Hajjar IM, Grim CE, George V, Kotchen TA. Impact of diet on blood pressure and age-related changes in blood pressure in the US population: analysis of NHANES III. Arch Intern Med. 2001;161:589–93. doi: 10.1001/archinte.161.4.589. [DOI] [PubMed] [Google Scholar]
- 39.Stamler J, Liu K, Ruth KJ, Pryer J, Greenland P. Eight-year blood pressure change in middle-aged men: relationship to multiple nutrients. Hypertension. 2002;39:1000–6. doi: 10.1161/01.hyp.0000016178.80811.d9. [DOI] [PubMed] [Google Scholar]
- 40.Kopp W. Pathogenesis and aetiology of essential hypertension: role of dietary carbohydrate. Med Hypotheses. 2005;64:782–7. doi: 10.1016/j.mehy.2004.10.009. [DOI] [PubMed] [Google Scholar]
- 41.New Delhi: ICMR; 2010. Indian Council of Medical Research (ICMR). Report of the Expert Group of the Indian Council of Medical Research (ICMR-1990), Nutrient requirements and recommended dietary allowances for Indians. [Google Scholar]
- 42.Gupta R, Gupta VP, Ahluwalia NS. Educational status, coronary heart disease and coronary risk factors prevalence in a rural population of India. BMJ. 1993;309:1332–6. doi: 10.1136/bmj.309.6965.1332. [DOI] [PMC free article] [PubMed] [Google Scholar]
- 43.Sorel JE, Ragland DR, Syme SL, Davis WB. Educational Status and blood pressure: the Second National Health and Nutrition Examination Survey, 1976-1980, and the Hispanic Health and Nutrition Examination Survey, 1982-1984. Am J Epidemiol. 1992;135:1339–48. doi: 10.1093/oxfordjournals.aje.a116245. [DOI] [PubMed] [Google Scholar]


