

Abstract
We applied a multiplexed, mass spectrometry-based strategy to interrogate the proteome and phosphoproteome of three yeast strains under two growth conditions. The yeast proteins Bmh1 and Bmh2, analogs to the 14-3-3 protein family, have a wide-array of cellular functions including the regulation of phosphorylation events. Similarly, rapamycin is a drug that can regulate phosphorylation events. By performing a series of TMT10-plex experiments, we investigated the alterations in the proteome and phosphoproteome of wildtype and two deletion strains (bmh1Δ and bmh2Δ) of S. cerevisiae treated with rapamycin and DMSO as a control. Our 3×3+1 strategy allowed for triplicate analysis of each of the three strains, plus an additional sample consisting of an equal mix of all samples. We quantified over 4000 proteins and 20,000 phosphorylation events. Of these, we quantified over 3700 proteins across all 20 samples and over 14,300 phosphorylation events within each drug treatment. In total, data collected from four TMT10-plex experiments required approximately one week of data collection on the mass spectrometer. This study underscores the complex cellular roles of Bmh1 and Bmh2 coupled with response to rapamycin treatment and emphasizes the utility of multiplexed proteomic techniques to elucidate comprehensive proteomes and phosphoproteomes.
Keywords: yeast, rapamycin, 14-3-3, Bmh1, Bmh2, multiplexing
1. Introduction
Multiplexing strategies in mass spectrometry-based quantitative proteomics have significantly expanded the depth, efficiency, and throughput of comprehensive protein analyses. Employing isobaric labeling [1–3] enables the universal quantification of protein samples, with the current limitation being the number of available labels. Such labeling strategies are not limited to investigating protein level changes, which may be insufficient to explain complex signaling events. As such, multiplexed isobaric labeling strategies may also be applied to interrogate the phosphoproteome.
Members of the 14-3-3 protein family are expressed in a wide range of organisms from yeast to higher order mammals. In Saccharomyces cerevisiae, two 14-3-3 orthologs, Bmh1 and Bmh2, are expressed [4–6]. Cells remain viable with deletion of either Bmh1 (bmh1Δ) or Bmh2 (bmh2Δ), albeit with a slight reduction in growth rate [6]. However, a double deletion of these two genes is lethal in most yeast strains, including S. cerevisiae [4, 6]. These dimeric proteins have very diverse roles as adapter/scaffold molecules, localization anchors, regulators of enzyme activity, signal transducers, regulators of cell cycle progression, transcriptional regulators, and are involved in apoptosis [7, 8]. The 14-3-3 protein family partake in diverse regulatory functions via interactions with proteins phosphorylated in conserved motifs. Binding motifs of Bmh1 and Bmh2 in yeast include two major sequences: RSXpSXP and RXY/FXpSP, where pS is phosphoserine and X can be any of several amino acids [9]. We expect substantial alterations in cellular signaling upon deletion of Bmh1 and/or Bmh2 due to the roles of these proteins in diverse cellular mechanisms.
Similarly, rapamycin has a role in signaling pathways and alterations in protein phosphorylation. Rapamycin is a potent immunosuppressing antibiotic that is used commonly in yeast research [10]. In addition, this drug has demonstrated inhibition of tumor growth [11] and as such, downstream targets may be potential cancer therapies [12–14]. Rapamycin has been shown previously in mass spectrometry-based analyses to alter the yeast proteome [15, 16]. Because of the vast array of functions for the 14-3-3 family of proteins, we expect that a relationship, whether direct or indirect, exists between Bmh1/Bmh2 and rapamycin. In fact, Bmh1 and Bmh2 have been shown to positively regulate rapamycin-sensitive signaling potentially via downstream interaction with a phosphoprotein integral to a key signaling cascade [17].
Herein, we explored the differences in the proteome and the phosphoproteome of wildtype, bmh1Δ, and bmh2Δ strains of S. cerevisiae in triplicate under standard growth conditions and following rapamycin treatment. We use a strategy, which employs novel TMT10-plex reagents to enhance our ability to analyze the proteomic alterations resulting from bmh1Δ and bmh2Δ gene deletions. As 14-3-3 proteins interact extensively with phosphopeptides, we expanded our analytical depth by performing a global phosphoproteomic analysis using a strategy analogous to that outlined for the protein analysis, albeit with an additional TiO2 enrichment prior to TMT labeling. Using this strategy enabled the comprehensive analysis of the proteome and phosphoproteome of three yeast strains treated with rapamycin or DMSO as a control.
2. Materials and Methods
2.1 Materials
Tandem mass tag (TMT) isobaric reagents were from ThermoScientific (Waltham, MA). Titanosphere TiO2 5 μm particles were from GL Biosciences, (Tokyo, Japan). Water and organic solvents were from J.T. Baker (Center Valley, PA). Unless otherwise noted, all other chemicals were from Sigma (St. Louis, MO).
2.2 Yeast strains
All three yeast strains – wildtype, bmh1Δ, and bmh2Δ - were derived from the same background (strain BY4742 MAT α, derived from S288c). Cultures were grown in standard yeast-peptone-dextrose (YPD) media to an optical density (OD) of 0.6. At this point, either a final concentration of 200 nM rapamycin (LC laboratory, Woburn, MA) or an equal volume of DMSO (for control samples) was added to the cultures, which were grown for an additional 90 min at 30°C.
2.3 Cell lysis and protein digestion
Yeast cultures were harvested by centrifugation, and resuspended at 4°C in a buffer containing 50 mM HEPES pH 8.5, 8 M urea, 75 mM NaCl, protease (complete mini, EDTA-free), and phosphatase (PhosphoStop) inhibitors (Roche, Basel, Switzerland). Cells were lysed using the MiniBeadbeater (Biospec, Bartlesville, OK) in microcentrifuge tubes at maximum speed at three cycles of 60 sec each, with 3 min pauses between cycles to avoid overheating of the lysates. After centrifugation, lysates were transferred to new tubes. The protein concentration in the lysate was determined by bicinchoninic acid (BCA) protein assay (ThermoScientific, Waltham, MA).
Proteins were subjected to disulfide reduction with 5 mM dithiotreitol (37°C, 25 min) and alkylation with 10 mM iodoacetamide (room temperature, 30 min in the dark). Excess iodoacetamide was quenched with 15 mM dithiotreitol (room temperature, 15 min in the dark). Methanol-chloroform precipitation was performed prior to protease digestion. In brief, four parts neat methanol was added to each sample and vortexed, one part chloroform was added to the sample and vortexed, and three parts water was added to the sample and vortexed. The sample was centrifuged at 4000 RPM for 15 min at room temperature and subsequently washed twice with 100% acetone, prior to air-drying.
Samples were resuspended in 8 M urea, 50 mM HEPES, pH 8.5. The protein extract was then diluted to 1 M urea with 50 mM HEPES pH 8.5 and digested at 37°C for 3 hrs with LysC protease at a 100:1 protein-to-protease ratio. Trypsin was then added at a 100:1 protein-to-protease ratio and the reaction was incubated overnight at 37°C.
2.4 Phosphopeptide enrichment
Phosphopeptides were enriched using a method based on that of Kettenbach and Gerber [18]. In brief, Titanosphere TiO2 5 μm particles (GL Biosciences, Tokyo, Japan) were washed three times with 2 M lactic acid/50% acetonitrile. Peptides were resuspended in 2.5 mL of 2 M lactic acid/50% acetonitrile. For ~10 mg of peptide digest, 40 mg beads were added and incubated with gentle rotation for 1 hr at room temperature. Beads were washed twice with 2.5 mL of 2 M lactic acid/50% acetonitrile, then twice with 2.5 mL of 50% acetonitrile/0.1% trifluoroacetic acid (TFA), and finally twice with 2.5 mL of 25% acetonitrile/0.1% TFA. Enriched phosphopeptides were eluted twice with 500 μL of 50 mM K2HPO4 pH 10 and vacuum centrifuged to dryness.
2.5 Tandem mass tag labeling
In preparation for TMT labeling, desalted peptides (both for protein and phosphopeptide level analysis) were resuspended in 70 μL of 200 mM HEPES, pH 8.5. Peptide concentrations were determined using the microBCA assay (ThermoScientific, Waltham, MA). Approximately 50 μg of peptides from each sample were labeled with TMT reagent. The samples labeled with TMT131 were mixtures of 5.6 μg of unlabeled peptide from each of the 18 individual samples (i.e., we used a mix of all 18 whole proteome samples for protein level TMT10-plexes, and another mix of all 18 phosphopeptide samples for phosphopeptide level TMT10-plexes). TMT reagents (0.8 mg) were dissolved in anhydrous acetonitrile (40 μL) of which 10 μL was added to the peptides along with 20 μL of acetonitrile to achieve a final acetonitrile concentration of approximately 30% (v/v). Following incubation at room temperature for 1 hr, the reaction was quenched with hydroxylamine to a final concentration of 0.3% (v/v). The TMT-labeled samples were pooled at a 1:1:1:1:1:1:1:1:1:1 ratio. The sample was vacuum centrifuged to near dryness and subjected to C18 solid-phase extraction (SPE) (Sep-Pak, Waters).
2.6 Off-line basic pH reversed-phase (BpRP) fractionation
For protein-level and phosphoproteome analysis, we fractionated the pooled sample using BpRP HPLC. We used an Agilent 1100 pump equipped with a degasser and a photodiode array (PDA) detector (set at 220 and 280 nm wavelength) from ThermoFisher (Waltham, MA). Peptides were subjected to a 50 min linear gradient from 5% to 35% acetonitrile in 10mM ammonium bicarbonate pH 8 at a flow rate of 0.8 mL/min over an Agilent 300Extend C18 column (5 μm particles, 4.6 mm ID and 220 mm in length). The peptide mixture was fractionated into a total of 96 fractions which were consolidated into 12. Samples were subsequently acidified with 1% formic acid and vacuum centrifuged to near dryness. Each eluted fraction was desalted via StageTip [19], dried via vacuum centrifugation, and reconstituted in 5% acetonitrile, 5% formic acid for LC-MS/MS processing.
2.7 Liquid chromatography and tandem mass spectrometry
Our mass spectrometry data were collected using an Orbitrap Elite mass spectrometer (Thermo Fisher Scientific, San Jose, CA) coupled to a Proxeon EASY-nLC II liquid chromatography (LC) pump (ThermoFisher Scientific). Peptides were separated on a 100 μm inner diameter microcapillary column packed with ~0.5 cm of Magic C4 resin (5 μm, 100 Å, Michrom Bioresources) followed by ~20 cm of Maccel C18 resin (3 μm, 200 Å, Nest Group). For each analysis, we loaded ~1 μg onto the column.
Peptides were separated using a 3 hr gradient of 6 to 30% acetonitrile in 0.125% formic acid at a flow rate of ~300 nL/min. Each analysis used the multi-notch MS3-based TMT method [20] [21]. The scan sequence began with an MS1 spectrum (Orbitrap analysis; resolution 60,000; mass range 300–1500 m/z; automatic gain control (AGC) target 1 × 10⁶; maximum injection time 150 ms). The top ten precursors were then selected for MS2/MS3 analysis. MS2 analysis consisted of collision-induced dissociation (quadrupole ion trap analysis; AGC 2 × 10³; normalized collision energy (NCE) 35; q-value 0.25; maximum injection time 100 ms). Following acquisition of each MS2 spectrum, we collected an MS3 spectrum using our recently described method in which multiple MS2 fragment ions are captured in the MS3 precursor population using isolation waveforms [20] with multiple frequency notches. MS3 precursors were fragmented by high energy collision-induced dissociation (HCD) and analyzed using the Orbitrap (NCE 50; AGC 1.5 × 10⁵; maximum injection time 250 ms, isolation specificity 0.8 Th, resolution was 30,000 at 400 Th). By using AGC targets well below 1.5 × 10⁵, coalescence of TMT10-plex reporter ions should not be an issue [22].
2.8 Data analysis
Mass spectra were processed using a Sequest-based in-house software pipeline [23]. Spectra were converted to mzXML using a modified version of ReAdW.exe. Database searching included all entries from the yeast SGD (Saccharomyces Genome Database) (August 10, 2012), which was concatenated with a reverse database composed of all protein sequences in the reversed order. Searches were performed using a 50 ppm precursor ion tolerance for total protein level analysis and 20 ppm for phosphopeptide analysis. The product ion tolerance was set to 1 Da. These wide mass tolerance windows were chosen to maximize sensitivity in conjunction with Sequest searches and linear discriminant analysis [23, 24]. TMT tags on lysine residues and peptide N termini (+229.163 Da) and carbamidomethylation of cysteine residues (+57.021 Da) were set as static modifications, while oxidation of methionine residues (+15.995 Da) was set as a variable modification. For phosphopeptide analysis, +79.966 Da was set as a variable modification on serine, threonine, and tyrosine.
Peptide-spectrum matches (PSMs) were adjusted to a 1% false discovery rate (FDR) [25, 26]. PSM filtering was performed using a linear discriminant analysis, as described previously [23], while considering the following parameters: XCorr, ΔCn, missed cleavages, peptide length, charge state, and precursor mass accuracy. For TMT-based reporter ion quantitation, we extracted the signal-to-noise (S/N) ratio for each TMT channel and found the closest matching centroid to the expected mass of the TMT reporter ion.
The search space for each reporter ion was limited to a range of 0.002 Th to prevent overlap between the isobaric reporter ions. For protein-level comparisons, PSMs were identified, quantified, and collapsed to a 1% peptide false discovery rate (FDR) and then collapsed further to a final protein-level FDR of 1%. Moreover, protein assembly was guided by principles of parsimony to produce the smallest set of proteins necessary to account for all observed peptides.
Proteins and phosphorylation sites were quantified by summing reporter ion counts across all matching PSMs using in-house software, as described previously [23]. Briefly, a 0.002 Th window around the theoretical m/z of each reporter ion (126: 126.127 Th, 127N: 127.124 Th, 127C: 127.131 Th, 128N: 128.128 Th, 128C: 128.134 Th, 129N 129.131 Th, 129C: 129.138 Th, 130N: 130.135 Th, 130C: 130.1411 Th, 131: 131.138 Th) was scanned for ions, and the maximum intensity nearest the theoretical m/z was used. PSMs with poor quality, MS3 spectra with more than seven TMT channels missing, less than 100 TMT reporter summed signal to noise ratio, or no MS3 spectra were excluded from quantitation [27]. Protein and phosphosite quantitation values were exported for further analysis in Excel or MatLab.
For both protein and phosphorylation site quantitation, each reporter ion channel was summed across all quantified proteins and normalized assuming equal protein loading of all 10 samples. To compare among different datasets, data were normalized to the TMT131 channel (separately for the total protein and phosphoprotein data). One-way ANOVA was then used to identify proteins that were differentially expressed across strains. A Bonfferoni-corrected p-value <0.01 was considered statistically significant [28].
2.9 Phosphopeptide motif analysis
For the phosphorylation dataset, site localization was evaluated via AScore [24]. Sites with an Ascore >13 were extracted and these local sequences were analyzed further using the PhosphoSitePlus (http://www.phosphosite.org) motif analysis tool [29]. Sequences were centered at the phosphorylated residue and extended six amino acids on each side, thereby giving a length of 13 amino acids for each phosphorylation site.
2.10 Data access
Supplemental Tables 1 and 2 list the proteins and phosphosites, respectively, as well as normalized TMT reporter ion intensities used for quantitative analysis. RAW files will be made available upon request.
3. Results and Discussion
3.1 We quantified over 4100 yeast proteins using a multiplexed TMT 10-plex-based strategy
Using the methods as outlined in Figure 1 (with additional details in Supplemental Figure 1), we performed quantitative mass spectrometry analyses on three yeast strains (wildtype, bmh1Δ, and bmh2Δ treated with DMSO or rapamycin) for which we determined the relative protein abundance of over 4100 proteins. First, we compared protein abundance ratios for the three yeast strains treated with DMSO. We identified 4127 proteins, of which 4061 were quantified across all DMSO-treated samples. Similarly, we compared protein abundance ratios for yeast cultures with the addition of rapamycin, we identified 4061 proteins, of which 3930 were quantified in all rapamycin-treated samples. All proteins and associated quantitative values are listed in Supplemental Table 1. In total, 3736 proteins were quantified across all 20 samples.
Figure 1. Experimental overview.
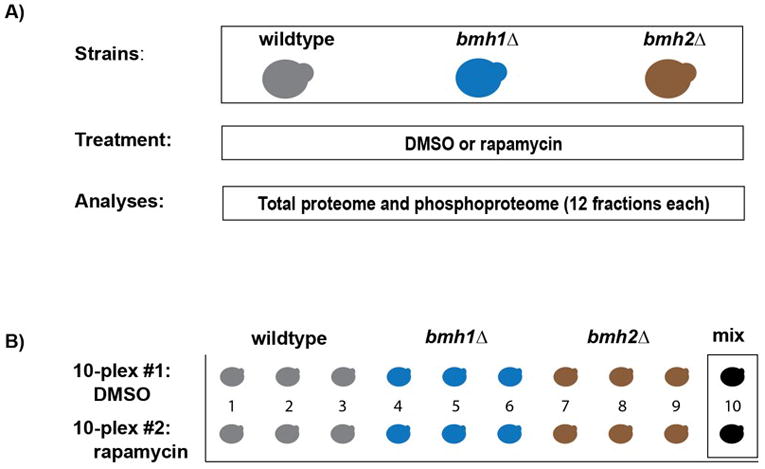
A) Three yeast strains (wildtype, bmh1Δ and bmh2Δ) were grown in biological triplicate. Cultures were split so that half was treated with rapamycin and the other half with DMSO as a control. Mass spectrometric analysis was performed at the protein and phosphopeptide levels. B) Representation of the 18 samples (plus two mixed samples) that were used for each analysis. Illustrated is the experimental set-up for both the protein and phosphosite level experiments.
We performed an ANOVA for each protein across the dataset, and corrected for multiple testing using the Bonferroni method [30]. We used the Tukey’s post-hoc test for each protein to ascertain which of the three strains differed significantly. In addition, we imposed a second threshold requiring a 2-fold increase or decrease in protein abundance among samples. The numbers of proteins up- and down-regulated for each comparison were summarized in Supplemental Table 3. We then subjected these differentially abundant proteins to two-dimensional clustering using the Euclidean distance metric (Figure 2). The samples clustered as expected, that is, triplicates clustered together, and the two deletion mutants clustered closer to each other than wild-type. In addition, we submitted these proteins to KEGG pathway analysis and extracted enriched pathways. First, we examined proteins from the DMSO-treated control cultures showing significant increases in abundance in the deletion compared to the wildtype strain. Glycolysis/gluconeogenesis represented the pathway with the greatest number of proteins of higher abundance when comparing the deletion strains to wildtype (Figure 2A). Two examples include GLK1 (glucokinase) and HXK1 (hexokinase isoenzyme 1), both of which catalyze the phosphorylation of glucose at carbon-6 in the first irreversible step of glucose metabolism [31] [32]. Next, we examined proteins with statistically significant higher abundance in the deletion strains compared to the wildtype strain in the rapamycin-treated cell cultures. Here, oxidative phosphorylation pathway was enriched with the highest number of proteins (Figure 2B). Two examples included NDE1 (NADH Dehydrogenase, External) and NDI1 (NADH Dehydrogenase Internal), which were both NADH dehydrogenases. NDE1 is a mitochondrial external NADH dehydrogenase that catalyzes the oxidation of cytosolic NADH [33], while NDI1 transfers electrons from NADH to ubiquinone in the respiratory chain [34].
Figure 2. Clustering diagrams of proteins with statistically significant differences in abundance.
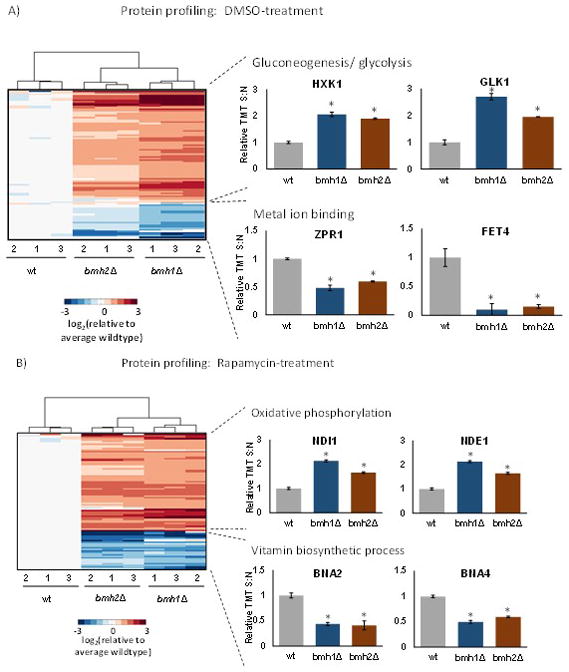
A) Proteins in the DMSO-treated control cultures with examples of those enriched in select KEGG pathways. We highlighted two proteins that were up-regulated in gluconeogenesis/glycolysis and down-regulated in metal ion binding. B) Proteins in the rapamycin-treated cultures. We highlighted two proteins that were up-regulated in oxidative phosphorylation and down-regulated in vitamin biosynthesis. The color scale of the heat map was capped at +/−2 and represented log2(mutant/wildtype). * indicates statistical significance as demonstrated by a Bonferroni-corrected p-value <0.01.
Conversely, when examining proteins that are of lower abundance comparing the deletion strains to wildtype in DMSO-treated samples, the pathway with the highest number of proteins was metal ion-binding (Figure 2A). Examples of such proteins include FET4 (FErrous Transport) and ZPR1 (Zinc finger PRotein). FET4 is a low-affinity Fe(II) transporter of the plasma membrane that can also bind other metals such as copper, cobalt, and zinc [35], while ZPR1 has two zinc finger domains and translocates from the nucleus to the cytoplasm in starved cells [36]. Similarly, the pathway with the greatest number of proteins of lower abundance when comparing the deletion strains to wild-type in rapamycin-treated samples was vitamin biosynthesis (Figure 2B). Two examples include BNA2 (Biosynthesis of Nicotinic Acid 2) and BNA4 (Biosynthesis of Nicotinic Acid 4), both of which are involved in the biosynthesis of NAD from tryptophan via kynurenine. Interestingly, aside from NAD being an essential cofactor for cellular redox reactions and energy metabolism, the mammalian ortholog of BNA4 is a putative therapeutic target for Huntington disease [37].
As expected, the deletion of Bmh1 or Bmh2 genes had a complex effect on the cellular proteome. Rapamycin treatment resulted in additional protein abundance differences to those observed between the deletion and wildtype strains, thereby perturbing further various cellular pathways. As such, we investigated more thoroughly the effects of these proteomic alterations, resulting from the gene deletions and rapamycin treatment, at the signaling level by examining the changes in the phosphoproteome.
3.2 Phosphoproteomic analysis revealed differences in phosphorylation levels upon treatment with rapamycin
Using methods based on the protein level analysis, we investigated comprehensively the global phosphoproteome of the three yeast strains treated with either rapamycin or DMSO as a control. We performed phosphopeptide enrichment to determine phosphorylation state differences among wildtype, bmh1Δ, and bmh2Δ strains in response to rapamycin treatment. From this analysis, we identified over 2300 non-redundant phosphoproteins between our two TMT10-plex experiments (Table 1). A total of 2230 phosphoproteins were identified in the DMSO-treated culture, while 2211 phosphoproteins were identified in the rapamycin-treated cultures with < 1% false discovery rate. Comparing the two experiments revealed a high degree of overlap, as 2114 phosphoproteins (>99%) were common between the two datasets. Moreover, we identified over 4,000 unique phosphothreonine (pT) and approximately 17,000 phosphoserine (pS) peptides in the DMSO- and rapamycin- treated datasets with < 1% false discovery rate, corresponding to a total of 6,717 and 23,878 non-redundant pT and pS phosphopeptides, respectively, between the two datasets. The number of phosphopeptides was relatively consistent for pT and pS peptides at the total peptide, unique peptide, and protein levels when comparing DMSO- and rapamycin-treated samples (Table 1).
Table 1. Quantified proteins, phosphoproteins, phosphopeptides, and phosphosites from DMSO- and rapamycin-treated yeast cultures as quantified via TMT10-plex analysis.
Counts for DMSO- and rapamycin-treated samples have a false discovery rate (FDR) of <1%, however, the combined set has an FDR of <2%.
| treatment | proteins | phosphoproteins | phosphopeptides
|
phosphosites | |||
|---|---|---|---|---|---|---|---|
| pT | pS | ||||||
|
| |||||||
| total | unique | total | unique | ||||
| DMSO | 4019 | 2,230 | 8,160 | 4,231 | 44,203 | 17,319 | 14,595 |
| rapamycin | 3930 | 2,211 | 8,789 | 4,592 | 40,081 | 16,877 | 14,608 |
|
| |||||||
| combined | 4185 | 2,328 | 16,949 | 6,717 | 84,284 | 23,878 | 22,974 |
3.3 Phosphoproteomic and subsequent phosphorylation consensus sequence analyses revealed differences in phosphosites among wildtype, bmh1Δ, and bmh2Δ yeast strains
We quantified 14,595 phosphorylation sites in the DMSO-treated dataset and 14,608 in the dataset of the rapamycin-treated samples yielding a total of 22,974 unique sites at <2% FDR (Table 1). As with the total protein analysis, we performed ANOVA across the datasets and corrected for multiple testing using the Bonferroni method [30]. Again, we used the Tukey’s post-hoc test for each phosphorylation site to determine which strain(s) differed significantly from the others. We also imposed a second threshold requiring a 2-fold increase or decrease in phosphosite abundance among samples. Several thousand phosphorylation sites were altered among the strains, which we listed in Supplemental Table 2 and summarized in Supplemental Table 4. Considering all three yeast strains investigated, significant phosphorylation site alterations (Supplemental Table 4) were more prevalent than protein alterations (Supplemental Table 3). Moreover, the deletion strains showed consistently more phosphosites in higher abundance than lower abundance with respect to wildtype. We postulated that the propensity of Bmh1 and Bmh2 to bind phosphopeptides resulted in a protective effect preventing dephosphorylation via phosphatases, an event which therefore may not be as prominent in the deletion strains.
In addition, we used PhosphoSitePlus motif analysis tool [29] to determine the consensus amino acid sequences around which phosphorylation events occur in our datasets. For this analysis we used the phosphorylated residues that were present at statistically different levels along with the six flanking residues on either side. We compared phosphosites quantified in bmh1Δ and bmh2Δ versus wildtype. The results revealed that phosphosites of higher abundance when comparing the deletion strains to wildtype included those with RRxS and similar consensus sites, while those of lower abundance contained SP and similar sites (Supplemental Figure 2). In addition, we subjected these significantly altered phosphorylation sites to hierarchical clustering using the Euclidian distance metric. As expected, triplicate samples clustered closest together while deletion strains grouped closer to each other than to wildtype (Figure 3). Heat maps of phosphorylation sites demonstrating statistically significant differences between either deletion strain and wildtype were constructed for DMSO-treated controls (Figure 3A) and rapamycin-treated cultures (Figure 3B). Below, we highlighted two proteins displaying these expression patterns for higher or lower abundance with respect to DMSO or rapamycin treatment.
Figure 3. Clustering diagrams of phosphosites with statistically significant differences in abundance.
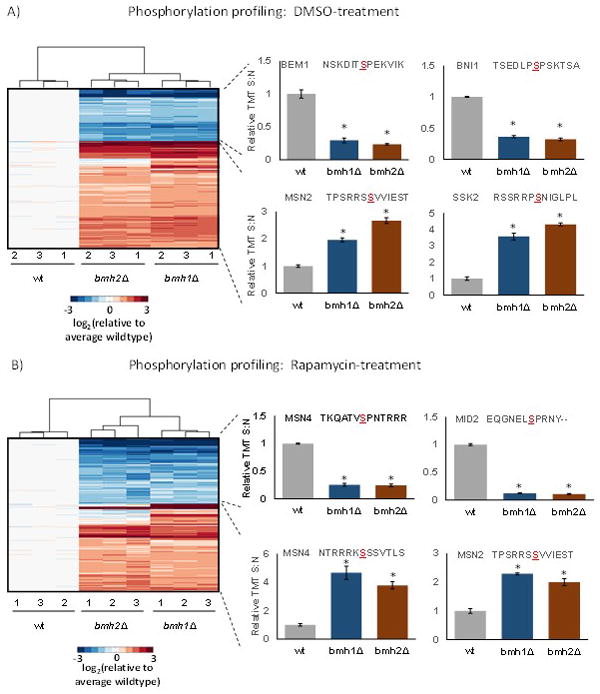
A) Phosphosites in the DMSO-treated control cultures with examples of those enriched in certain KEGG pathways. We highlighted two phosphorylation sites that were up-regulated with RRxS sites and down-regulated with SP sites. B) Phosphosites in the rapamycin-treated control cultures. We highlighted two phosphorylation sites that were up-regulated with RRxS sites and down-regulated with SP sites. The color scale of the heat map was capped at +/−3 and represented log2(mutant/wildtype). * indicates statistical significance as demonstrated by a Bonferroni-corrected p-value <0.01.
We surveyed the sites with increased phosphorylation in the DMSO-treated yeast cultures (Supplemental Figure 2A). Here, both bmh1Δ and bmh2Δ with respect to wildtype showed increased phosphorylation of sites with the motifs RRxS, RxxS and RxS. Examples of proteins with increased phosphorylation of RRxS motifs included MSN2 (Multicopy suppressor of SNF1 mutation 2) and SSK2 (Suppressor of Sensor Kinase) (Figure 3A). MSN2 is a transcriptional activator, which translocates from the cytoplasm to the nucleus under stress conditions [38], while SSK2 is MAP kinase kinase kinase whose autophosphorylation promotes actin cytoskeleton recovery after osmotic stress [39].
Similarly, sites with increased phosphorylation when comparing rapamycin-treated deletion strains and wildtype cultures also included RRxS and RxxS motifs (Supplemental Figure 2B). Examples of RRxS motif-containing proteins included MSN2 (Multicopy suppressor of SNF1 mutation 2) as in the DMSO-treated cell cultures, and MSN4 (Multicopy suppressor of SNF1 mutation 4) (Figure 3B). Both of these proteins are transcriptional activators, which translocate from the cytoplasm to the nucleus under stress conditions and target specific genes [38] [40].
Moreover, for the DMSO-treated yeast cultures, sites with decreased phosphorylation with respect to wildtype included those containing SP, SxP, and SD (Supplemental Figure 2C). Decreases were observed for several SP containing phosphosites, including BEM1 (Bud EMergence) and BNI1 (Bud Neck Involved) (Figure 3A). BEM1 is an SH3-domain-containing protein involved in establishing cell polarity and morphogenesis [41] [42]. Likewise, BNI1 nucleates the formation of linear actin filaments involved in cell processes, such as mitotic spindle orientation, and is required for the initiation of bud growth [43].
Similarly in the rapamycin-treated yeast cultures, SP and SD were included, along with SQ, as sites with decreased phosphorylation in deletion strains with respect to wildtype (Supplemental Figure 2D). Two examples of proteins with decreased abundance in phosphorylation include MSN4 and MID1 (Figure 3B). Interestingly, not only did MSN4 have an RRxS motif-containing phosphosite with higher abundance in the deletion strains than wildtype (as mentioned above), but it also contained a phosphosite with an SP motif-containing peptide, which was quantified at a lower abundance in the deletion strain than wildtype. Likewise, this phosphorylation pattern was similar to that of another SP motif-containing protein MID1 (Mating pheromone-Induced Death), which is an O-glycosylated plasma membrane protein that is a sensor for cell wall integrity signaling and activates the associated pathway [44, 45]. The decrease in phosphorylation of the SQ motif was unique to rapamycin-treated samples with respect to control. Additionally, SxP, albeit with a low score (3.8–4.0), was overrepresented in terms of increased phosphorylation in the DMSO-treated cultures.
Some of the global effects in altered phosphosites of bmh1Δ or bmh2Δ deletion strains were independent of rapamycin treatment. We observed alterations in the phosphorylation states of local sequence patterns in the rapamycin-treated cell cultures that were similar to those in the DMSO-treated cultures. That is, we detected an increase in RRxS motif-containing phosphosites and a decrease in SP motif-containing phosphosites. We noted increases in phosphorylation at RRxS and RxxS sites for both the DMSO- and rapamycin-treated wildtype strain. Interestingly, RRxS and RxxS motifs are known PKA or Akt binding sites, respectively [46, 47]. Moreover, we observed an analogous increase in phosphorylation levels for SP sites in mutant strains with respect to wildtype, again independent of rapamycin treatment. In general, these data demonstrated that when comparing the bmh1Δ or bmh2Δ strains to wildtype, local sequences containing basic (R, K) or hydrophilic residues (N, R, K) upstream from the potentially phosphorylated residue showed increased phosphorylation, while those with a proline (P) immediately following the potentially phosphorylated residue showed decreased phosphorylation.
3.4 Using the cross-over TMT131 channel allowed for comparison between the DMSO- and rapamycin-treated TMT10-plex datasets
We also compared proteins in the wildtype samples across TMT10-plex datasets by normalizing the nine channels in each set to the 131 channel in that dataset. We performed ANOVA for each strain and defined a statistically significant difference in protein abundance as having a Bonferroni-corrected p-value< 0.01. In addition, we required the fold change upon rapamycin treatment to be greater than 2 (either up or down). Supplemental Table 5 summarized the number of differentially expressed proteins and phosphosites.
Proteins demonstrating a statistically significant difference in abundance when comparing either deletion strain to the wildtype were subjected to two-dimensional hierarchical clustering using the Euclidian distance metric (Supplemental Figure 3). In addition, these proteins were submitted to KEGG pathway analysis [48]. Proteins of higher expression in the rapamycin-treated samples compared to the DMSO-treated samples were characterized as having roles in metabolism, while those down-regulated had roles in ribosome structure and function (Supplemental Table 6). Two examples of proteins displaying higher expression in the deletion strains than wildtype included CIT1 (Citrate synthase) and GDH3 (Glutamate DeHydrogenase). CIT1, the rate-limiting enzyme of the TCA cycle, catalyzes the formation of citrate via condensation of acetyl coenzyme A and oxaloacetate [49]. Similarly, GDH3 is involved in energy metabolism as exemplified by its role in synthesizing and balancing the distribution of alpha-ketoglutarate to glutamate biosynthesis and energy metabolism [50]. Conversely, when examining proteins of lower abundance, comparing rapamycin to DMSO-treated samples, the highest number of proteins were classified as being of ribosomal origin. Of particular interest was the concept that all yeast ribosomal proteins have a mammalian homolog [51]. Two examples of proteins displaying lower expression in the deletion strains versus wildtype were RPP1B (Ribosomal protein P1 beta) and RPP2B (Ribosomal protein P2 beta). Both RPP1B and RPP2B are involved in the interaction of translational elongation factors with the ribosome [52, 53]. These results were consistent with a previous analysis by Dephoure and Gygi [16], which also showed higher abundance of metabolic proteins and lower abundance of ribosomal proteins in rapamycin-treated cultures versus controls for wildtype S. cerevisiae.
3.5 Changes in phosphorylation state were typically not a consequence of increased protein abundance
When expanding our investigation from protein abundance changes to phosphoproteomic alterations, we were concerned that differences in phosphorylation states may be correlated with alterations in protein expression, rather than cell signaling-induced changes. We created histograms (smoothed using the probability density function) to compare the distribution of the alterations at the protein and phosphopeptide levels due to rapamycin treatment with respect to DMSO control treatment. At the protein level, rapamycin and DMSO treatments led to similar alterations across the three strains (Figure 4A). However, we noted a narrower distribution of alterations as illustrated by the bmh1Δ curve with respect to the other two curves, indicating that the global alterations due to rapamycin at the protein level for bmh1Δ was less than that for the wildtype and bmh2Δ strains. For the phosphorylation analysis, the curves for the three strains were closer in shape to each other and broader than those of the protein level analysis (Figure 4B). Such curves demonstrated that alterations in phosphorylation states were much greater than those of protein abundances, as the curves level off at six-fold for the phosphosite analysis and three-fold for the protein analysis. For comparison, we showed that the reproducibility among the replicates is strong in contrast with the large differences between DMSO and rapamycin treatment. When comparing the three wildtype replicates from the protein (Supplemental Figure 4A) and phosphorylation site (Supplemental Figure 4B) analyses, we noted that the curves leveled off at 0.5-fold, which was substantially lower than the 3- and 6-fold differences observed when comparing abundance differences due to rapamycin. From these data, we showed that global phosphorylation site differences were substantially greater than protein differences upon rapamycin treatment.
Figure 4. Global alterations in proteome and phosphoproteome of wildtype, bmh1Δ and bmh2Δ yeast strains resulting from rapamycin treatment.
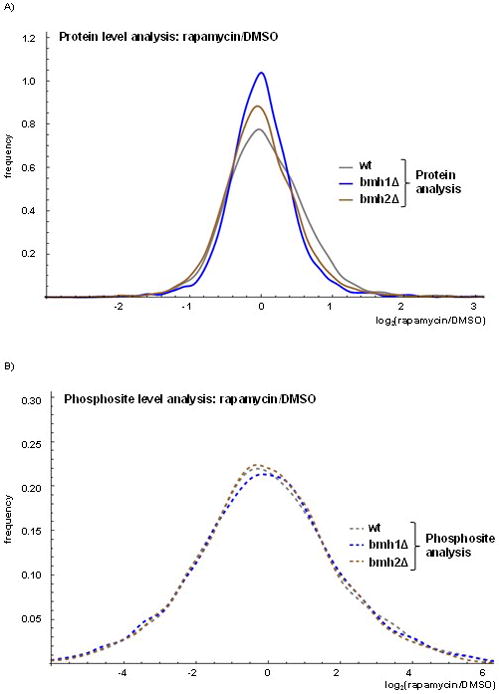
The histograms were smoothed using the probability density function and showed log2 fold change for rapamycin-to-DMSO treatment at the A) protein and B) phosphosite levels.
Our datasets enabled the comparison of statistically significant changes in phosphorylation states with alterations in corresponding protein levels to ensure that phosphorylation changes were due to signaling events and not differences in protein expression. The majority of changes in phosphorylation states, comparing within TMT10-plex datasets (Supplemental Figure 5), were largely independent of protein alterations. This concept is also true when comparing the wildtype sample treated with DMSO versus rapamycin (Supplemental Figure 6). However, when focusing at the individual peptide level, such protein alterations should be considered if concomitant changes were observed. Thus, although only a minority of alterations observed in phosphorylation states may be attributed to changes in protein abundance, protein expression differences should be examined as necessary when investigating changes in phosphosites.
The protein MSN4 exemplified that differences in abundance at the phosphorylation level did not generally reflect differences at the protein levels. At the protein level, we observed a modest increase in protein abundance over wildtype in the bmh2Δ DMSO-treated sample (Supplemental Figure 7A), while in the rapamycin-treated (Supplemental Figure 7B) sample, we observed no significant change in protein expression. At the phosphorylation site level, six sites were common in both treatments (Supplemental Figure 7C). Of these, several phosphosites showed increased abundance in mutants compared to wildtype (e.g., S531, S446, and T479), while S119 showed a decrease in phosphorylation, as was expected for this SP site. When comparing bmh1Δ and bmh2Δ, we observed differences in the phosphorylation levels of S558 and T317. Four phosphorylation sites were identified in only the DMSO-treated samples, with three (T321, T661, and S327) of higher abundance in the mutants compared to wildtype, while one, S537, which contained an SP site, showed a lower abundance in the mutants (Supplemental Figure 7D). Similarly, we identified eight phosphorylation sites as present only in the rapamycin-treated samples (Supplemental Figure 7E). Here, two phosphorylation sites (T142 and S373) showed a modest increase in the deletion strains, four showed (S294, T535, T332, and T539) decreases in the mutants compared to wildtype, while two (S488 and S263) demonstrated an increase in the bmh1Δ strain compared to the other strains. The differences in phosphorylation states, as observed in these data, reflected the interaction of Bmh1 and Bmh2 on different phosphorylation sites, in addition to the global effects of rapamycin on the phosphoproteome. Further studies focusing on specific differences in phosphorylation sites may reveal the mechanisms of action regulating such alterations.
3.6 Data obtained for TMT10-plex correlated well with that from a previous TMT6-plex experiment
We compared a previously collected TMT6-plex dataset to that of the TMT10-plex total proteome level experiments described above to ensure that TMT10-plex provided a greater analytical depth while not altering protein ratios. The TMT6-plex experiment was designed like the TMT10-plex (wildtype versus bmh1Δ versus bmh2Δ), but with duplicates instead of triplicates and without the “mix” channel, that is in a 2+2+2 format. We compared the total proteins identified between the TMT6- and TMT10-plex datasets for both DMSO- and rapamycin-treated cultures. These experiments revealed over 80% protein overlap between the TMT6-plex and TMT10-plex datasets for both the DMSO- (Supplemental Figure 8A) and rapamycin-treated cultures (Supplemental Figure 8B). Combining the DMSO- and rapamycin-treated datasets resulted in over 88% overlap (Supplemental Figure 8C) in protein identifications between TMT6-plex and TMT10-plex. The magnitude of the overlap may be attributed to the comprehensiveness of the proteome coverage in both datasets. We interrogated further the data using only proteins identified by greater than one peptide in both datasets to increase stringency. More specifically, correlation plots for the DMSO-treated control cultures comparing the protein abundance ratios of bmh1Δ:wildtype and bmh2Δ:wildtype (Supplemental Figure 9A and B) showed Pearson correlation (R2) values of over 0.74. Similarly, correlation plots for rapamycin-treated cultures (Supplemental Figure 9C and D) showed R2 values of over 0.82. Therefore, we are confident that TMT10-plex allows for greater throughput, while attaining similar protein abundance ratios with more robust statistics than traditional TMT6-plex.
Future innovation will likely generate new reagents allowing for an even higher degree of multiplexing. Previously, Dephoure and Gygi used a hyperplexing-based strategy to investigate the dynamic response of protein expression to rapamycin in wildtype yeast, while monitoring 18 samples simultaneously [16]. Using an innovative approach that combined SILAC (stable isotope labeled amino acids in cell culture) and TMT6-plex, 2981 proteins were quantified. Among the advantages of our TMT10-plex strategy used herein is overcoming the need for metabolic labeling and the ability to apply this technique beyond yeast and other cultured cells to any sample including human tissue and fluids [54, 55]. However, we foresee the potential of using the hyperplexing strategy combining metabolic labeling with isobaric tagging to increase further the multiplexing capabilities of TMT10-plex in cultured systems.
4. Concluding remarks
In this study, we use multiplexed quantitative mass spectrometry-based techniques to investigate comprehensively the proteomic and phosphoproteomic alterations in three yeast strains (wildtype, bmh1Δ, and bmh2Δ) of S. cerevisiae. The Bmh1 and Bmh2 proteins have roles in a wide-array of cellular functions and thereby have far-reaching effects on the proteome and phosphoproteome of S. cerevisae. Our 3×3+1 strategy allowed for triplicate analysis of each of the three strains, plus an additional sample consisting of an equal mix of all samples analyzed. We quantified 4185 proteins and 22,974 phosphorylation sites, thereby providing a resource to investigate further the proteome and phosphoproteome of these yeast strains. Of these, we quantified 3736 proteins across all 20 samples and over 14,300 phosphorylation events within each of drug treatment, 6105 of which were quantified in all 20 samples. This study highlights the complex cellular roles of Bmh1 and Bmh2, as well as rapamycin, in budding yeast.
The use of multiplexed proteomic techniques was essential to elucidate comprehensive proteomes in a high throughput manner. The TMT10-plex strategy requires only approximately 36 hr of analysis per dataset, while data collection for each individual sample could require weeks. Several previously published studies have successfully used TMT10-plex for various applications. Further studies may be developed using the 3×3+1 strategy as outlined herein with these or other yeast deletion strains and with other treatments or forms of cellular stress. In conclusion, we have used a TMT10-plex strategy to quantitatively compare the proteomic and phosphoproteomic profiles of three yeast strains (wildtype, bmh1Δ, and bmh2Δ) with DMSO and rapamycin treatment and, as such, have assembled one of the largest catalogs of yeast proteins and potential phosphorylation sites to date in a single experiment.
Supplementary Material
Acknowledgments
We would also like to thank members of the Gygi Lab at Harvard Medical School, in particular Noah Dephoure for his technical assistance and critical reading of the manuscript. This work was funded in part by an NIH/NIDDK grant K01 DK098285 (JP).
Abbreviations
- bmh
brain modulosignalin homologue
- BCA
bicinchoninic acid
- DMSO
dimethyl sulfoxide
- TMT
tandem mass tag
- wt
wildtype
Footnotes
Conflicts of interest
The authors acknowledge no conflict of interest.
References
- 1.Dayon L, Hainard A, Licker V, Turck N, et al. Relative quantification of proteins in human cerebrospinal fluids by MS/MS using 6-plex isobaric tags. Anal Chem. 2008;80:2921–2931. doi: 10.1021/ac702422x. [DOI] [PubMed] [Google Scholar]
- 2.Thompson A, Schafer J, Kuhn K, Kienle S, et al. Tandem mass tags: a novel quantification strategy for comparative analysis of complex protein mixtures by MS/MS. Analytical chemistry. 2003;75:1895–1904. doi: 10.1021/ac0262560. [DOI] [PubMed] [Google Scholar]
- 3.Ross PL, Huang YN, Marchese JN, Williamson B, et al. Multiplexed protein quantitation in Saccharomyces cerevisiae using amine-reactive isobaric tagging reagents. Molecular & cellular proteomics: MCP. 2004;3:1154–1169. doi: 10.1074/mcp.M400129-MCP200. [DOI] [PubMed] [Google Scholar]
- 4.van Heusden GP, Griffiths DJ, Ford JC, Chin AWTF, et al. The 14-3-3 proteins encoded by the BMH1 and BMH2 genes are essential in the yeast Saccharomyces cerevisiae and can be replaced by a plant homologue. Eur J Biochem. 1995;229:45–53. [PubMed] [Google Scholar]
- 5.Gelperin D, Weigle J, Nelson K, Roseboom P, et al. 14-3-3 proteins: potential roles in vesicular transport and Ras signaling in Saccharomyces cerevisiae. Proc Natl Acad Sci U S A. 1995;92:11539–11543. doi: 10.1073/pnas.92.25.11539. [DOI] [PMC free article] [PubMed] [Google Scholar]
- 6.van Heusden GP, Wenzel TJ, Lagendijk EL, de Steensma HY, van den Berg JA. Characterization of the yeast BMH1 gene encoding a putative protein homologous to mammalian protein kinase II activators and protein kinase C inhibitors. FEBS Lett. 1992;302:145–150. doi: 10.1016/0014-5793(92)80426-h. [DOI] [PubMed] [Google Scholar]
- 7.Aitken A. 14-3-3 proteins: a historic overview. Seminars in cancer biology. 2006;16:162–172. doi: 10.1016/j.semcancer.2006.03.005. [DOI] [PubMed] [Google Scholar]
- 8.Mhawech P. 14-3-3 proteins--an update. Cell research. 2005;15:228–236. doi: 10.1038/sj.cr.7290291. [DOI] [PubMed] [Google Scholar]
- 9.Yaffe MB, Rittinger K, Volinia S, Caron PR, et al. The structural basis for 14-3-3:phosphopeptide binding specificity. Cell. 1997;91:961–971. doi: 10.1016/s0092-8674(00)80487-0. [DOI] [PubMed] [Google Scholar]
- 10.Vezina C, Kudelski A, Sehgal SN. Rapamycin (AY-22,989), a new antifungal antibiotic. I. Taxonomy of the producing streptomycete and isolation of the active principle. The Journal of antibiotics. 1975;28:721–726. doi: 10.7164/antibiotics.28.721. [DOI] [PubMed] [Google Scholar]
- 11.Guba M, von Breitenbuch P, Steinbauer M, Koehl G, et al. Rapamycin inhibits primary and metastatic tumor growth by antiangiogenesis: involvement of vascular endothelial growth factor. Nature medicine. 2002;8:128–135. doi: 10.1038/nm0202-128. [DOI] [PubMed] [Google Scholar]
- 12.Marone R, Cmiljanovic V, Giese B, Wymann M. Targeting phosphoinositide 3-kinase: moving towards therapy. Biochim Biophys Acta. 2008;1784:159–185. doi: 10.1016/j.bbapap.2007.10.003. [DOI] [PubMed] [Google Scholar]
- 13.Guertin D, Sabatini D. Defining the role of mTOR in cancer. Cancer cell. 2007;12:9–22. doi: 10.1016/j.ccr.2007.05.008. [DOI] [PubMed] [Google Scholar]
- 14.Bjornsti MA, Houghton P. The TOR pathway: a target for cancer therapy. Nature reviews Cancer. 2004;4:335–348. doi: 10.1038/nrc1362. [DOI] [PubMed] [Google Scholar]
- 15.Fournier ML, Paulson A, Pavelka N, Mosley AL, et al. Delayed correlation of mRNA and protein expression in rapamycin-treated cells and a role for Ggc1 in cellular sensitivity to rapamycin. Mol Cell Proteomics. 2010;9:271–284. doi: 10.1074/mcp.M900415-MCP200. [DOI] [PMC free article] [PubMed] [Google Scholar]
- 16.Dephoure N, Gygi SP. Hyperplexing: a method for higher-order multiplexed quantitative proteomics provides a map of the dynamic response to rapamycin in yeast. Science signaling. 2012;5:rs2. doi: 10.1126/scisignal.2002548. [DOI] [PMC free article] [PubMed] [Google Scholar]
- 17.Bertram PG, Zeng C, Thorson J, Shaw AS, Zheng XF. The 14-3-3 proteins positively regulate rapamycin-sensitive signaling. Curr Biol. 1998;8:1259–1267. doi: 10.1016/s0960-9822(07)00535-0. [DOI] [PubMed] [Google Scholar]
- 18.Kettenbach A, Gerber S. Rapid and reproducible single-stage phosphopeptide enrichment of complex peptide mixtures: application to general and phosphotyrosine-specific phosphoproteomics experiments. Anal Chem. 2011;83:7635–7644. doi: 10.1021/ac201894j. [DOI] [PMC free article] [PubMed] [Google Scholar]
- 19.Rappsilber J, Ishihama Y, Mann M. Stop and go extraction tips for matrix-assisted laser desorption/ionization, nanoelectrospray, and LC/MS sample pretreatment in proteomics. Anal Chem. 2003;75:663–670. doi: 10.1021/ac026117i. [DOI] [PubMed] [Google Scholar]
- 20.Ting L, Rad R, Gygi S, Haas W. MS3 eliminates ratio distortion in isobaric multiplexed quantitative proteomics. Nat Methods. 2011;8:937–940. doi: 10.1038/nmeth.1714. [DOI] [PMC free article] [PubMed] [Google Scholar]
- 21.McAlister GC, Nusinow DP, Jedrychowski MP, Wuhr M, et al. MultiNotch MS3 Enables Accurate, Sensitive, and Multiplexed Detection of Differential Expression across Cancer Cell Line Proteomes. Analytical chemistry. 2014;86:7150–7158. doi: 10.1021/ac502040v. [DOI] [PMC free article] [PubMed] [Google Scholar]
- 22.Werner T, Sweetman G, Savitski MF, Mathieson T, et al. Ion coalescence of neutron encoded TMT 10-plex reporter ions. Analytical chemistry. 2014;86:3594–3601. doi: 10.1021/ac500140s. [DOI] [PubMed] [Google Scholar]
- 23.Huttlin EL, Jedrychowski MP, Elias JE, Goswami T, et al. A tissue-specific atlas of mouse protein phosphorylation and expression. Cell. 2010;143:1174–1189. doi: 10.1016/j.cell.2010.12.001. [DOI] [PMC free article] [PubMed] [Google Scholar]
- 24.Beausoleil SA, Villen J, Gerber SA, Rush J, Gygi SP. A probability-based approach for high-throughput protein phosphorylation analysis and site localization. Nat Biotechnol. 2006;24:1285–1292. doi: 10.1038/nbt1240. [DOI] [PubMed] [Google Scholar]
- 25.Elias JE, Gygi SP. Target-decoy search strategy for mass spectrometry-based proteomics. Methods Mol Biol. 2010;604:55–71. doi: 10.1007/978-1-60761-444-9_5. [DOI] [PMC free article] [PubMed] [Google Scholar]
- 26.Elias JE, Gygi SP. Target-decoy search strategy for increased confidence in large-scale protein identifications by mass spectrometry. Nat Methods. 2007;4:207–214. doi: 10.1038/nmeth1019. [DOI] [PubMed] [Google Scholar]
- 27.McAlister GC, Huttlin EL, Haas W, Ting L, et al. Increasing the multiplexing capacity of TMTs using reporter ion isotopologues with isobaric masses. Anal Chem. 2012;84:7469–7478. doi: 10.1021/ac301572t. [DOI] [PMC free article] [PubMed] [Google Scholar]
- 28.Dunn O. Multiple Comparisons among Means. Journal of the American Statistical Association. 1961 [Google Scholar]
- 29.Hornbeck P, Kornhauser J, Tkachev S, Zhang B, et al. PhosphoSitePlus: a comprehensive resource for investigating the structure and function of experimentally determined post-translational modifications in man and mouse. Nucleic acids research. 2012;40:70. doi: 10.1093/nar/gkr1122. [DOI] [PMC free article] [PubMed] [Google Scholar]
- 30.Bonferroni C. Teoria statistica delle classi e calcolo delle probabilità. [Google Scholar]
- 31.Clifton D, Walsh RB, Fraenkel DG. Functional studies of yeast glucokinase. Journal of bacteriology. 1993;175:3289–3294. doi: 10.1128/jb.175.11.3289-3294.1993. [DOI] [PMC free article] [PubMed] [Google Scholar]
- 32.Rodriguez A, De La Cera T, Herrero P, Moreno F. The hexokinase 2 protein regulates the expression of the GLK1, HXK1 and HXK2 genes of Saccharomyces cerevisiae. The Biochemical journal. 2001;355:625–631. doi: 10.1042/bj3550625. [DOI] [PMC free article] [PubMed] [Google Scholar]
- 33.Luttik MA, Overkamp KM, Kotter P, de Vries S, et al. The Saccharomyces cerevisiae NDE1 and NDE2 genes encode separate mitochondrial NADH dehydrogenases catalyzing the oxidation of cytosolic NADH. J Biol Chem. 1998;273:24529–24534. doi: 10.1074/jbc.273.38.24529. [DOI] [PubMed] [Google Scholar]
- 34.Li W, Sun L, Liang Q, Wang J, et al. Yeast AMID homologue Ndi1p displays respiration-restricted apoptotic activity and is involved in chronological aging. Mol Biol Cell. 2006;17:1802–1811. doi: 10.1091/mbc.E05-04-0333. [DOI] [PMC free article] [PubMed] [Google Scholar]
- 35.Dix DR, Bridgham JT, Broderius MA, Byersdorfer CA, Eide DJ. The FET4 gene encodes the low affinity Fe(II) transport protein of Saccharomyces cerevisiae. J Biol Chem. 1994;269:26092–26099. [PubMed] [Google Scholar]
- 36.Galcheva-Gargova Z, Gangwani L, Konstantinov KN, Mikrut M, et al. The cytoplasmic zinc finger protein ZPR1 accumulates in the nucleolus of proliferating cells. Mol Biol Cell. 1998;9:2963–2971. doi: 10.1091/mbc.9.10.2963. [DOI] [PMC free article] [PubMed] [Google Scholar]
- 37.Giorgini F, Guidetti P, Nguyen Q, Bennett SC, Muchowski PJ. A genomic screen in yeast implicates kynurenine 3-monooxygenase as a therapeutic target for Huntington disease. Nat Genet. 2005;37:526–531. doi: 10.1038/ng1542. [DOI] [PMC free article] [PubMed] [Google Scholar]
- 38.Martinez-Pastor MT, Marchler G, Schuller C, Marchler-Bauer A, et al. The Saccharomyces cerevisiae zinc finger proteins Msn2p and Msn4p are required for transcriptional induction through the stress response element (STRE) Embo J. 1996;15:2227–2235. [PMC free article] [PubMed] [Google Scholar]
- 39.Yuzyuk T, Foehr M, Amberg DC. The MEK kinase Ssk2p promotes actin cytoskeleton recovery after osmotic stress. Mol Biol Cell. 2002;13:2869–2880. doi: 10.1091/mbc.02-01-0004. [DOI] [PMC free article] [PubMed] [Google Scholar]
- 40.Estruch F, Carlson M. Two homologous zinc finger genes identified by multicopy suppression in a SNF1 protein kinase mutant of Saccharomyces cerevisiae. Mol Cell Biol. 1993;13:3872–3881. doi: 10.1128/mcb.13.7.3872. [DOI] [PMC free article] [PubMed] [Google Scholar]
- 41.Bender A, Pringle JR. Use of a screen for synthetic lethal and multicopy suppressee mutants to identify two new genes involved in morphogenesis in Saccharomyces cerevisiae. Mol Cell Biol. 1991;11:1295–1305. doi: 10.1128/mcb.11.3.1295. [DOI] [PMC free article] [PubMed] [Google Scholar]
- 42.Madden K, Snyder M. Cell polarity and morphogenesis in budding yeast. Annual review of microbiology. 1998;52:687–744. doi: 10.1146/annurev.micro.52.1.687. [DOI] [PubMed] [Google Scholar]
- 43.Kohno H, Tanaka K, Mino A, Umikawa M, et al. Bni1p implicated in cytoskeletal control is a putative target of Rho1p small GTP binding protein in Saccharomyces cerevisiae. Embo J. 1996;15:6060–6068. [PMC free article] [PubMed] [Google Scholar]
- 44.Ono T, Suzuki T, Anraku Y, Iida H. The MID2 gene encodes a putative integral membrane protein with a Ca(2+)-binding domain and shows mating pheromone-stimulated expression in Saccharomyces cerevisiae. Gene. 1994;151:203–208. doi: 10.1016/0378-1119(94)90657-2. [DOI] [PubMed] [Google Scholar]
- 45.Philip B, Levin DE. Wsc1 and Mid2 are cell surface sensors for cell wall integrity signaling that act through Rom2, a guanine nucleotide exchange factor for Rho1. Mol Cell Biol. 2001;21:271–280. doi: 10.1128/MCB.21.1.271-280.2001. [DOI] [PMC free article] [PubMed] [Google Scholar]
- 46.Montminy M. Transcriptional regulation by cyclic AMP. Annu Rev Biochem. 1997;66:807–822. doi: 10.1146/annurev.biochem.66.1.807. [DOI] [PubMed] [Google Scholar]
- 47.Pearson RB, Kemp BE. Protein kinase phosphorylation site sequences and consensus specificity motifs: tabulations. Methods Enzymol. 1991;200:62–81. doi: 10.1016/0076-6879(91)00127-i. [DOI] [PubMed] [Google Scholar]
- 48.Kanehisa M, Goto S. KEGG: Kyoto Encyclopedia of Genes and Genomes. Nucleic acids research. 2000 doi: 10.1093/nar/28.1.27. [DOI] [PMC free article] [PubMed] [Google Scholar]
- 49.Kim KS, Rosenkrantz MS, Guarente L. Saccharomyces cerevisiae contains two functional citrate synthase genes. Mol Cell Biol. 1986;6:1936–1942. doi: 10.1128/mcb.6.6.1936. [DOI] [PMC free article] [PubMed] [Google Scholar]
- 50.Avendano A, Deluna A, Olivera H, Valenzuela L, Gonzalez A. GDH3 encodes a glutamate dehydrogenase isozyme, a previously unrecognized route for glutamate biosynthesis in Saccharomyces cerevisiae. Journal of bacteriology. 1997;179:5594–5597. doi: 10.1128/jb.179.17.5594-5597.1997. [DOI] [PMC free article] [PubMed] [Google Scholar]
- 51.Mager WH, Planta RJ, Ballesta JG, Lee JC, et al. A new nomenclature for the cytoplasmic ribosomal proteins of Saccharomyces cerevisiae. Nucleic acids research. 1997;25:4872–4875. doi: 10.1093/nar/25.24.4872. [DOI] [PMC free article] [PubMed] [Google Scholar]
- 52.Zhao Y, Sohn JH, Warner JR. Autoregulation in the biosynthesis of ribosomes. Mol Cell Biol. 2003;23:699–707. doi: 10.1128/MCB.23.2.699-707.2003. [DOI] [PMC free article] [PubMed] [Google Scholar]
- 53.Planta RJ, Mager WH. The list of cytoplasmic ribosomal proteins of Saccharomyces cerevisiae. Yeast. 1998;14:471–477. doi: 10.1002/(SICI)1097-0061(19980330)14:5<471::AID-YEA241>3.0.CO;2-U. [DOI] [PubMed] [Google Scholar]
- 54.Bantscheff M, Lemeer S, Savitski MM, Kuster B. Quantitative mass spectrometry in proteomics: critical review update from 2007 to the present. Anal Bioanal Chem. 2012;404:939–965. doi: 10.1007/s00216-012-6203-4. [DOI] [PubMed] [Google Scholar]
- 55.Bantscheff M, Schirle M, Sweetman G, Rick J, Kuster B. Quantitative mass spectrometry in proteomics: a critical review. Anal Bioanal Chem. 2007;389:1017–1031. doi: 10.1007/s00216-007-1486-6. [DOI] [PubMed] [Google Scholar]
Associated Data
This section collects any data citations, data availability statements, or supplementary materials included in this article.