

Jang et al. generated H3.3-null mouse models and found that H3.3 plays an essential role in mouse development. H3.3 depletion did not dramatically disrupt gene regulation in the developing embryo but caused dysfunction of heterochromatin structures at telomeres, centromeres, and pericentromeric regions of chromosomes, leading to mitotic defects.
Keywords: histone H3.3, genome integrity, transcriptional regulation, cell proliferation, apoptosis, mouse embryonic development
Abstract
Histone H3.3 is a highly conserved histone H3 replacement variant in metazoans and has been implicated in many important biological processes, including cell differentiation and reprogramming. Germline and somatic mutations in H3.3 genomic incorporation pathway components or in H3.3 encoding genes have been associated with human congenital diseases and cancers, respectively. However, the role of H3.3 in mammalian development remains unclear. To address this question, we generated H3.3-null mouse models through classical genetic approaches. We found that H3.3 plays an essential role in mouse development. Complete depletion of H3.3 leads to developmental retardation and early embryonic lethality. At the cellular level, H3.3 loss triggers cell cycle suppression and cell death. Surprisingly, H3.3 depletion does not dramatically disrupt gene regulation in the developing embryo. Instead, H3.3 depletion causes dysfunction of heterochromatin structures at telomeres, centromeres, and pericentromeric regions of chromosomes, leading to mitotic defects. The resulting karyotypical abnormalities and DNA damage lead to p53 pathway activation. In summary, our results reveal that an important function of H3.3 is to support chromosomal heterochromatic structures, thus maintaining genome integrity during mammalian development.
H3.3 differs from the canonical replication-coupled H3 histones (H3.1/H3.2 in mammals) by only four to five amino acids, respectively, but has distinct expression patterns and chromatin incorporation mechanisms. Canonical H3 variants are expressed only during S phase, and their incorporation is mediated by the CAF-1 chromatin assembly complex (Smith and Stillman 1989; Verreault et al. 1996; Tagami et al. 2004). In contrast, H3.3 is expressed throughout the cell cycle and is incorporated via a number of different pathways, including the CHD1 and ATRX chromatin remodeling complexes and the HIRA chaperone complex (Tagami et al. 2004; Konev et al. 2007; Drane et al. 2010; Lewis et al. 2010).
H3.3 is unevenly distributed in the genome, suggesting that it may have diverse roles. It is enriched in transcribed genes, enhancers, regulatory elements, and also heterochromatic repeats, including telomeres and pericentromeric regions (Wirbelauer et al. 2005; Loyola and Almouzni 2007; Goldberg et al. 2010; Szenker et al. 2011). A study with mouse embryonic stem (ES) cells showed that the HIRA complex deposits H3.3 in transcribed genes, while the ATRX complex delivers H3.3 to telomeres and pericentromeric repeats (Goldberg et al. 2010).
H3.3 has been implicated in the epigenetic regulation of diverse biological processes. When incorporated into a nucleosome, H3.3 accumulates modifications associated with gene activation or open chromatin—including methylation on K4, K36, and K79 and acetylation on K9 and K14—and is deprived of suppressive modifications, including K9 and K27 methylations (McKittrick et al. 2004; Loyola and Almouzni 2007). H3.3-containing nucleosomes are intrinsically unstable and promote gene activation, especially with histone H2A.Z coincorporation (Jin and Felsenfeld 2007; Jin et al. 2009; Chen et al. 2013). H3.3 maintains the somatic epigenetic memory in nuclear transferred Xenopus nuclei (Ng and Gurdon 2008) and supports differentiation of cultured murine muscle precursor cells (Harada et al. 2012). HIRA-dependent incorporation of H3.3 is also required for the reprogramming of nuclear transferred murine nuclei (Jullien et al. 2012; Wen et al. 2014), DNA replication and rRNA transcription in mouse zygotes (Lin et al. 2014), transcriptional recovery after genomic DNA damage in human cancer cell lines (Adam et al. 2013), and Polycomb-repressive complex 2 recruitment to developmentally regulated bivalent loci in mouse ES cells (Banaszynski et al. 2013). Furthermore, somatic mutations in H3.3-encoding genes cause various types of cancer in humans, underscoring its role in maintaining tissue homeostasis (Schwartzentruber et al. 2012; Behjati et al. 2013).
H3.3 is highly conserved across metazoans (Elsaesser et al. 2010; Szenker et al. 2011; Waterborg 2012), and its in vivo function has been studied in a number of different model organisms. In Drosophila, H3.3 is required only for fertility but is dispensable for both embryonic and postnatal development (Hodl and Basler 2009; Sakai et al. 2009). The fertility defects in H3.3-null flies can be rescued by ectopic expression of H3.2 (Hodl and Basler 2012). Likewise, growth defects of H3.2-null somatic clones can be rescued by overexpression of H3.3 in S phase (Hodl and Basler 2012), indicating that only the overall level of H3 histone, but not any specific variant, is essential in fly development. In Xenopus, HIRA-dependent H3.3 deposition is specifically required for early gastrulation and mesodermal marker gene activation, and, importantly, H3.2 overexpression cannot rescue the mutant phenotype (Szenker et al. 2012). Xenopus H3.3 promotes mesodermal gene activation by suppressing linker histone H1 incorporation and thus counterbalancing its chromatin-compacting effect, and an optimal ratio of the two is required to maintain a competent chromatin state for gastrulation to proceed (Lim et al. 2013). In zebrafish, reduced levels of H3.3 in the nuclei, caused by an aggregating dominant mutant H3.3, leads to defects in cranial neural crest cell differentiation (Cox et al. 2012), indicating tissue-specific sensitivity of H3.3 reduction in fish development.
As in flies and humans, the murine H3.3 protein is redundantly encoded by two genes: H3f3a and H3f3b. Single knockouts and knockdowns of these two genes in mice have been reported (Couldrey et al. 1999; Bush et al. 2013; Lin et al. 2013; Tang et al. 2013, 2015; Inoue and Zhang 2014; Yuen et al. 2014). However, no one has reported a double knockout for both genes in the mouse embryo to reveal more fundamental functions of H3.3 in mouse development. Homozygotes of a H3f3a hypomorphic gene trap-inserted allele (Couldrey et al. 1999) and a targeted H3f3a-null allele (Tang et al. 2013) had reduced viability and male subfertility/infertility phenotypes. H3f3b knockout mice also have reduced viability, and surviving adults are infertile (Bush et al. 2013; Yuen et al. 2014); even heterozygous males were reported to be infertile (Tang et al. 2013, 2015). Different phenotypes were observed in H3.3 knockdown mouse zygotes using different approaches; a nuclear envelope formation defect was observed in a study using siRNA, and a chromosome condensation change was observed in another study using morpholinos (Lin et al. 2013; Inoue and Zhang 2014). However, the knockdown experiments come with caveats. Both of these early stage phenotypes can be attributed to paternal genome nucleosome assembly defects during the histone–protamine exchange process after fertilization (Inoue and Zhang 2014) rather than an H3.3-specific effect. Furthermore, the off-target effects associated with either approach also render the conclusions less definitive (Jackson and Linsley 2010; Kok et al. 2015). Therefore, the role of H3.3 in mammalian development remains elusive.
In order to study H3.3's role in mouse development, we generated new targeted alleles for H3f3a and H3f3b in mice. In contrast to previous findings, our single-knockout mice, regardless of the gene, were overtly normal and fertile in both sexes. Complete depletion of H3.3 with double knockouts results in developmental retardation and embryonic lethality. H3.3-null embryos show reduced cell proliferation and increased cell death. Ablation of H3.3 in mouse ES cells leads to cell death and mitotic defects. The growth retardation phenotype can be rescued by a p53 deletion. Transcriptional profiling of these p53-null-rescued H3.3-null embryos by RNA sequencing (RNA-seq) revealed only limited changes to the global transcriptome. H3.3-null mouse embryonic fibroblasts (MEFs) without p53 can proliferate but show mitotic abnormalities associated with defects in chromosomal heterochromatic structures and genome instability phenotypes. Taken together, our data suggest that a major function of H3.3 in mammalian development is maintaining genome integrity through its function in supporting heterochromatin structures at telomeres, centromeres, and pericentromeric regions.
Results
H3.3 complete null leads to peri-implantation lethality, while perinatal lethality and male infertility occur in compound mutants
To guide our search for phenotypes, we first conducted expression analysis in various adult organs in wild-type mice for H3f3a, H3f3b, and, for comparison, H3.1/3.2-encoding genes and stem–loop-binding protein (SLBP; which is expressed during S phase to facilitate the translation of polyA-less histone genes) (Whitfield et al. 2000). Both H3f3a and H3f3b genes are ubiquitously expressed but differ in levels among tissues and are uncoupled from the expression of canonical H3 histones (Fig. 1A). The highest expression of both genes occurs in the testis, followed by the ovary. Canonical H3 expression is more associated with cell proliferation status; the thymus, with actively dividing immune cells, has the highest level of H3.1/H3.2 expression. SLBP is also highly expressed in the reproductive and immune systems. The data suggest a special role for H3.3 in germ cell development.
Figure 1.
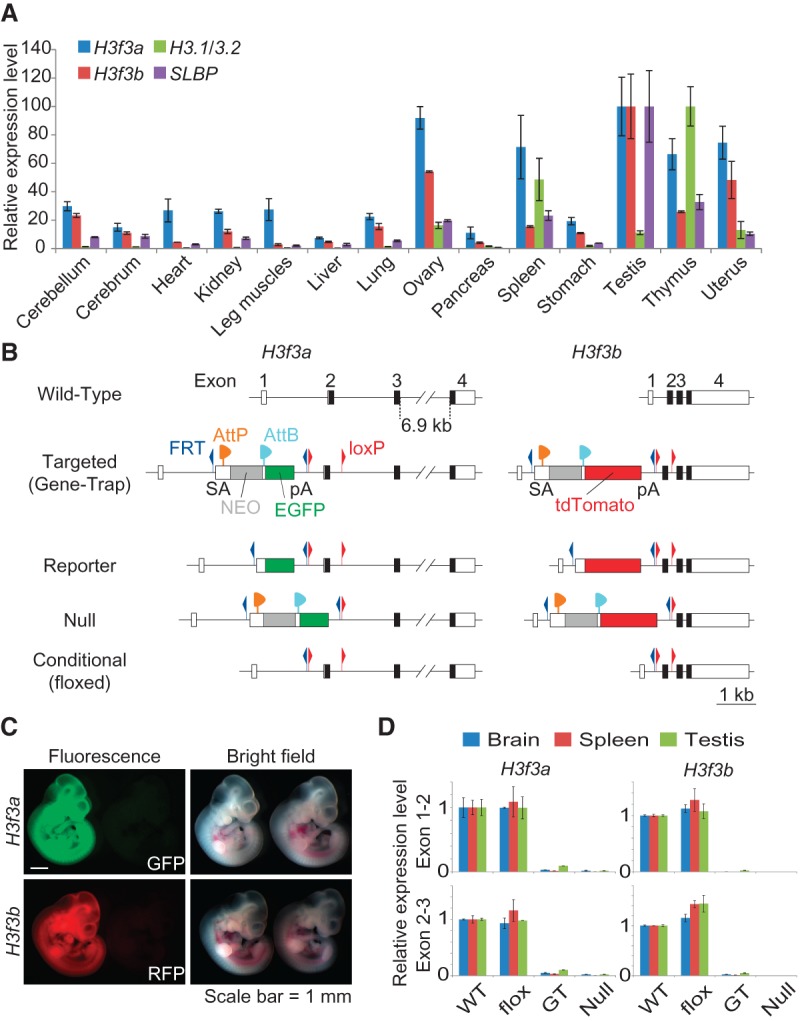
H3.3 gene expression and generation of H3.3 alleles. (A) Expression of H3f3a, H3f3b, H3.1/3.2, and SLBP in wild-type C57BL/6 adult mouse organs by quantitative PCR (qPCR). H3.1/H3.2 level was detected by using primers amplifying the consensus region of all of the annotated H3.1/H3.1-encoding gene copies in the mouse genome. Levels of individual genes across tissues were normalized to 18S rRNA, with the highest level set to 100. (B) Diagram of mutant H3f3a and H3f3b alleles created in this study. The initial targeted alleles were gene trap alleles with a splice acceptor and a polyA signal in intron 1. Fluorescent reporter alleles (EGFP for H3f3a, and tdTomato for H3f3b) were generated by φC31 integrase-mediated recombination between AttP and AttB sites. Null alleles were created by Cre-mediated deletion of the critical first coding exon (exon 2). Conditional (flox) alleles were created by deleting the gene trap cassette with FLP-mediated recombination between FRT sites. (NEO) Neomycin/G418 resistance gene. (C) Expression of fluorescent reporter alleles. A reporter allele carrier embryonic day 10.5 (E10.5) embryo is shown with a wild-type littermate for either gene. (D) Expression of H3f3a and H3f3b alleles in brain (cerebellum), spleen, and testis tissue from wild-type (WT; C57BL/6) and mutant animals homozygous with the indicated alleles by qPCR. Primer sets spanning intron 1 (exons 1 and 2) and intron 2 (exons 2 and 3) of each gene were used to access the transcription and splicing efficiency through introns 1 and 2, respectively. The standard error of the mean (SEM) is from two biological replicates (n = 2) for both A and D.
We targeted the H3f3a and H3f3b genes via homologous recombination in mouse ES cells using the same strategy for both: We inserted a promoter-less, splice acceptor–Neo-positive selection cassette with a conditional reporter gene (EGFP for H3f3a, and tdTomato for H3f3b) into intron 1 (Fig. 1B; see Supplemental Fig. S1 for details) and flanked the first coding exon (exon 2) with loxP sites. Upon Cre-mediated deletion, the next available in-frame ATG produces a 16-amino-acid peptide (the full-length H3.3 has 136 amino acids), creating a functionally null allele. Correctly targeted clones were identified by PCR screens and reconfirmed with Southern blots (Supplemental Fig. S2). Mutant mice were generated through blastocyst injection. For both genes, the resulting gene trap allele was successfully transmitted through the germline and converted to a fluorescent protein reporter allele, a conditional allele, and a null allele by exposure to recombinases in vivo through crosses (Fig. 1B). The reporter alleles revealed ubiquitous expression of both genes during embryonic development (Fig. 1C). The gene-disrupting function of each allele was verified by transcription analysis in select organs from homozygous adult animals (Fig. 1D). The null allele completely abolishes expression of exon 2, and, importantly, the intronic insertions of FRT/loxP sites do not impede normal transcription or splicing through the introns, allowing for conditional deletion of H3.3 genes.
Single-gene knockout (H3f3a−/− or H3f3b−/−) mice are overtly normal and fertile (data not shown). Furthermore, they can generate healthy and fertile progeny (in H3f3a−/−× H3f3a−/− or H3f3b−/−× H3f3b−/− crosses), indicating that neither gene is required for the complete mouse life cycle.
To generate H3.3 complete null mutants, we intercrossed double-heterozygous animals (H3f3a−/+; H3f3b−/+). Different staged embryos and postnatal pups were collected, and the distribution of their genotypes is summarized in Figure 2A. At the late blastocyst stage (embryonic day 3.5 [E3.5]), H3f3a−/−; H3f3b−/− double-knockout embryos were recovered at the expected Mendelian ratio. They were morphologically indistinguishable from control littermates (Fig. 2B). However, at E6.5, ∼2 d after implantation, double-knockout mutants were almost completely absent. The single double-knockout mutant recovered, of eight expected from 123 embryos, showed retarded growth (Fig. 2B). At E8.5, only two double-knockout mutants, of 12 expected, were recovered from 198 embryos. Similarly, these mutants had delayed growth. They morphologically resembled E7.5 wild-type embryos and had initiated Brachyury expression, a mesoderm marker (Herrmann 1991), indicating the correct progression of cell differentiation and patterning in double-knockout mutants (Fig. 2B). No double-knockout embryo was found at later stages. The low recovery rate and the phenotypes of double-knockout embryos after E6.5 indicate most of them either fail to implant or die shortly after due to a growth defect.
Figure 2.

Lethality and fertility phenotypes of H3.3 gene knockout mutants. (A) The number of embryos/pups of specific genotypes observed at different stages from H3f3a−/+; H3f3b−/+ mouse intercrosses. Numbers in parenthesis are expected numbers at the Mendelian ratio. The red background indicates that the observed numbers were significantly lower than expected. All of the AnullBhet pups died after birth. Significant differences from the expected numbers are indicated by (*) P < 0.05 and (**) P < 0.01 in χ2 test. (B) Double-knockout embryos (H3f3a−/−; H3f3b−/−) and their littermate control (H3f3a−/+; H3f3b−/+) at different stages. E8.5 embryos were hybridized with Brachyury probe, showing expression at the tail (arrow) and notochord (arrowhead) in the control and presumably the primitive streak in the double-knockout mutant (arrow). (C) Box plot of body weight distribution of E18.5 C-sectioned embryos. Raw values were first normalized to the average weight in the litter. Significant difference from wild type (WT) is indicated. (***) P < 0.001 in ANOVA test. (D) Survival of C-sectioned E18.5 embryos. Shown are total numbers of observed embryos (blue bars) and those that did not survive after C-section (red bars) in each genotype group. (E) Hematoxylin and eosin (H&E) sections of testes from 6- to 8-mo-old adult males of the indicated genotypes.
Compound mutants from the same crosses described above had other phenotypes. H3f3a−/−; H3f3b−/+ mutants (ANullBHet) die perinatally. All ANullBHet pups identified postnatally were dead (as early as postnatal day 0 [P0]), and their number was significantly lower than expected. When pups were delivered by C-section at E18.5, 1 d before birth, ANullBHet mutants were found at the expected Mendelian ratio (Fig. 2A). However, they usually appeared smaller and weighed less than their wild-type littermates (Fig. 2C). In contrast to their littermates, most ANullBHet mutants could not breathe properly and died (Fig. 2D), albeit having normal gross morphology (data not shown).
H3f3a−/+; H3f3b−/− mutant (AHetBNull) males are infertile. AHetBNull mice were born at the expected Mendelian ratio and survived to adulthood. However, they appeared slightly smaller than their littermates before weaning (data not shown). The mutant males could mate and produce vaginal plugs, but the mated wild-type females never became pregnant. Sections of AHetBNull testes revealed complete loss of germ cells (Fig. 2E). AHetBNull females are fertile (data not shown).
H3.3 deletion leads to reduced cell proliferation and increased cell death in the embryo
While double-knockout blastocysts appeared normal, possibly due to maternal deposits of H3.3 mRNA and protein, the post-implantation stage double-knockout embryos, which have more obvious phenotypes, were very rare. To facilitate the study of H3.3 function in embryonic development, we used a conditional knockout approach to deplete H3.3 in the embryo with a Sox2-Cre transgene (Hayashi et al. 2002). When the transgene is transmitted through the paternal germline, Cre expression starts at the blastocyst stage in the inner cell mass, inducing global deletion of floxed alleles in the whole embryo. We crossed homozygous double-floxed females (H3f3afl/fl; H3f3bfl/fl) to double-heterozygous males with the Cre transgene (H3f3a−/+; H3f3b−/+; Sox2-CreTg/0) and harvested embryos at different time points. With this approach, H3.3 depletion occurs later than in the double-knockout crosses, resulting in later manifestation of mutant phenotypes. Indeed, we recovered H3.3 conditional knockout (cKO) mutant embryos (H3f3afl/−; H3f3bfl/−; Sox2-CreTg/0, referred to as Sox2-cKO hereafter) at the expected Mendelian ratio up to E10.5. After E10.5, most mutants were resorbed or being resorbed (data not shown). Sox2-cKO embryos were developmentally retarded at every time point examined (Fig. 3A). They appeared to grow in size, albeit without turning, but continuously fell behind their littermates as gestation proceeded. The overall patterning and cell differentiation, however, appears normal in Sox2-cKO embryos, as judged by their morphology and Brachyury expression pattern visualized by whole-mount in situ hybridization at E8.5 (Fig. 3B). Notably, every Sox2-cKO embryo that we identified up to E10.5 had a beating heart at the time of dissection, suggesting that H3.3-null cells can differentiate properly.
Figure 3.
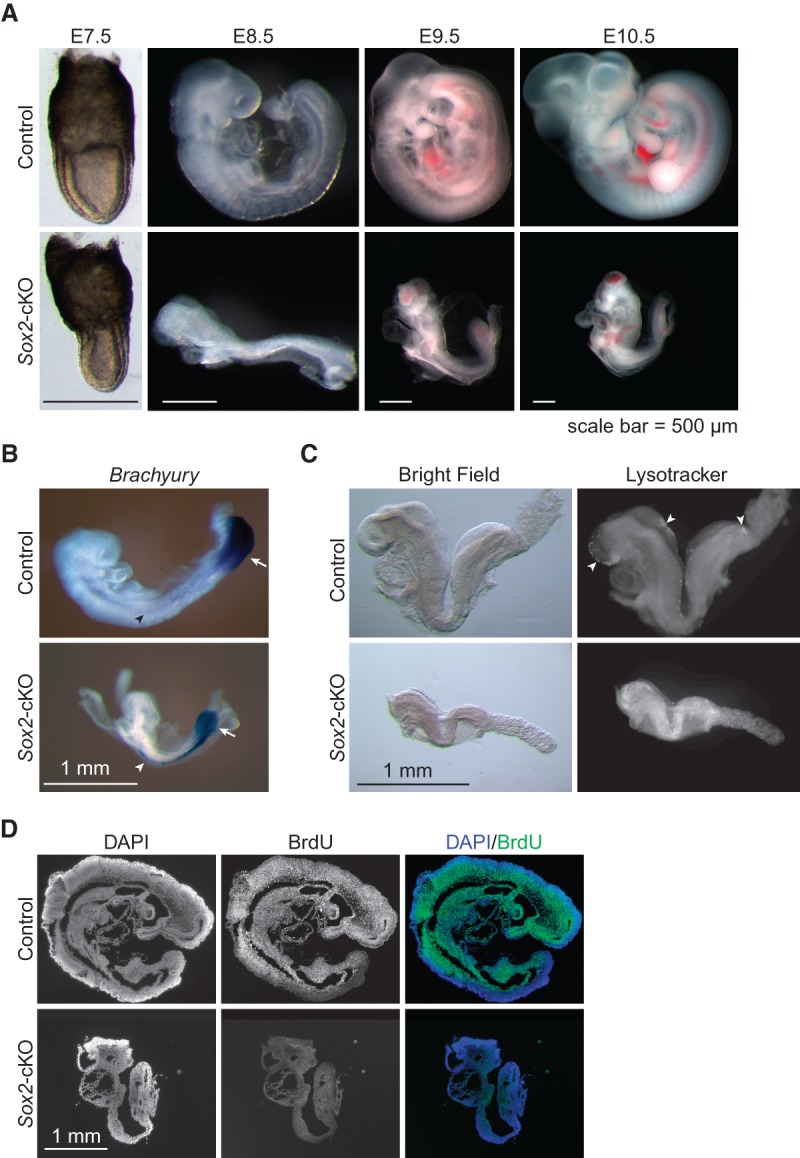
Sox2-cKO embryos died due to increased cell death and decreased cell proliferation. (A) Embryos at different stages from crosses between H3f3afl/fl; H3f3bfl/fl females and H3f3afl/+; H3f3bfl/+; Sox2-CreTg/0 males. For each stage, a control littermate (H3f3afl/+; H3f3bfl/+; Sox2-CreTg/0) is shown with a Sox2-cKO mutant. (B) Brachyury expression detected by whole -mount in situ hybridization. Both the control and the Sox2-cKO mutant showed expression at the tail (arrow) and notochord (arrowhead). (C) E8.5 embryos stained with Lysotracker. Scattered positive spots in the control are indicated (arrowheads). (D) BrdU staining of sagittal sections of control and Sox2-cKO E9.5 embryos. The faint cytoplasmic signal in the Sox2-cKO/BrdU embryo section comes from nonspecific background staining.
We examined cell death and proliferation in Sox2-cKO mutants to identify the underlying cause of the growth retardation phenotype. Lysotracker staining detects acidification of cellular compartments, which correlates with occurrence of cell death (Fogel et al. 2012). Sox2-cKO mutants showed dramatically elevated signal in the whole embryo (Fig. 3C), indicating globally increased ectopic cell death. The BrdU incorporation assay gauges cell proliferation by staining cells that have gone through S phase during the short pulse period and had BrdU incorporated in their genomic DNA. Sox2-cKO mutants showed a nearly complete absence of positive signal, in stark contrast to the ubiquitous strong staining of the controls (Fig. 3D), indicating strong cell cycle arrest or delay in H3.3-null cells. Altogether, these data suggest that globally increased cell death and decreased cell proliferation contribute to the developmental retardation phenotype of the mutant embryos.
H3.3 depletion leads to cell death and mitotic defects in ES cells
We established conditional knockout ES cell lines with an inducible Cre transgene, CAG-CreER (Hayashi and McMahon 2002), with genotype: H3f3afl/−; H3f3bfl/−; CAG-CreERTg/0 (referred to as CreER-cKO) to study the cellular functions of H3.3. Upon 4-hydroxy-tamoxifen (TAM) treatment, Cre efficiently deleted the floxed alleles, and the cells quickly lost their H3.3 expression at both mRNA and protein levels (Fig. 4A,B).
Figure 4.
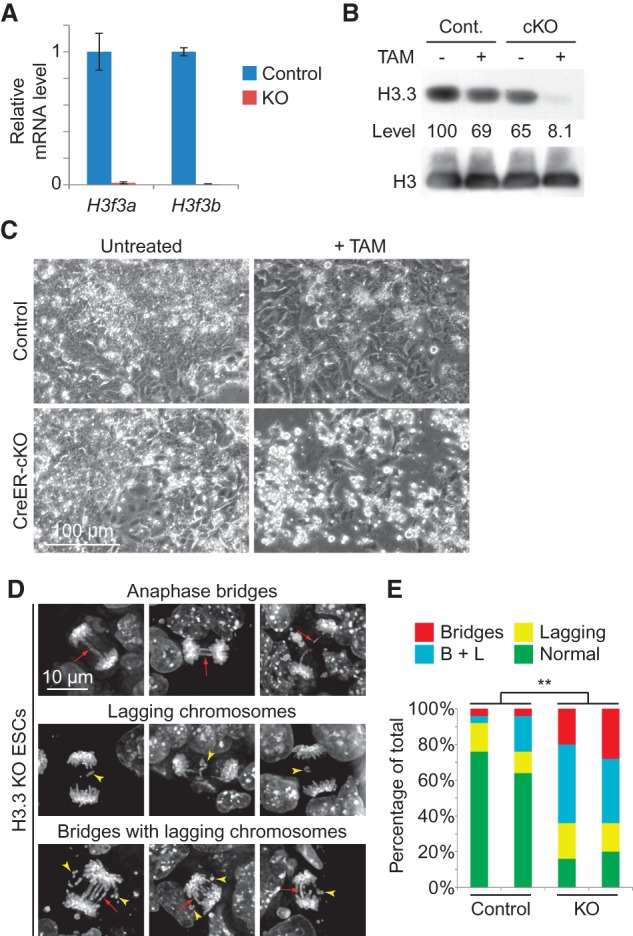
Cell death and mitotic defects in H3.3 knockout (KO) ES cells. (A) H3f3a and H3f3b expression in TAM-treated control (H3f3afl/+; H3f3bfl/+; CAG-CreERTg/0) and CreER-cKO ES cells detected by RT-qPCR. SEM is from two biological replicates. (B) H3.3 protein levels in control and CreER-cKO ES cells with or without TAM detected by Western blot. The numbers below are calculated relative protein levels normalized to total H3. (C) Representative images of control and CreER-cKO ES cells with or without TAM treatment. Equal numbers of cells were seeded for each group at the beginning. (D) Mitotic abnormalities with anaphase bridges (red arrow), lagging chromosomes (yellow arrowhead), or both were observed in H3.3 knockout ES cells. Cells were fixed and stained with DAPI. (E) Percentages of mitotic cells with abnormalities in control and H3.3 knockout ES cells; two lines of each were analyzed. Control is TAM-treated control cells. Twenty-five mitotic events were scored for each line. (**) P < 0.01 in χ2 test.
H3.3 deletion triggered rapid cell death (Fig. 4C). When we attempted to expand H3.3 CreER-cKO cells after TAM treatment, the subsequent passages only resulted in cells with incomplete H3.3 deletion rapidly taking over (data not shown). This indicates that H3.3-null ES cells are either not viable or have a severe growth disadvantage. Interestingly, we observed sharply increased incidence of mitotic abnormalities in H3.3 CreER-cKO ES cells, including anaphase bridges and lagging chromosomes (Fig. 4D,E), indicating the involvement of mitotic failure in the cause of cell death.
The p53 pathway mediates H3.3 mutant phenotypes
With the mitotic phenotype in H3.3-null ES cells, we suspected the involvement of the p53 pathway in the manifestation of H3.3 knockout phenotypes and examined the expression of known p53 target genes p21 and Puma, involved in controlling cell senescence and apoptosis, respectively (Fig. 5A). Markedly, p21/Waf1, a tumor suppressor gene that induces cell cycle arrest (Warfel and El-Deiry 2013), is highly elevated in Sox2-cKO embryos at E8.5. Puma/BBC3, a BH3-only Bcl-2 family proapoptotic subclass gene (Hikisz and Kilianska 2012), is also up-regulated. These results indicate that, in Sox2-cKO mutants, the p53 pathway is activated and triggers cell cycle arrest and cell death through its downstream targets.
Figure 5.
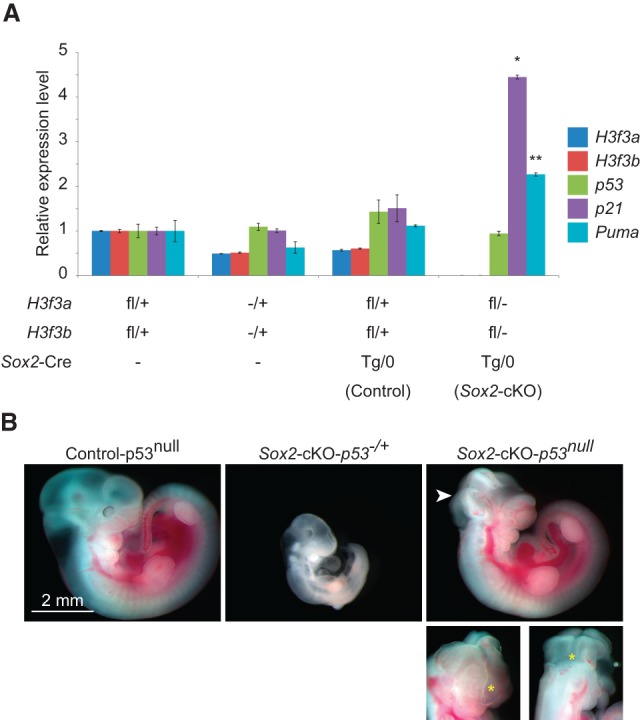
p53 involvement in mediating the H3.3 knockout phenotype. (A) Expression of H3f3a, H3f3b, p53, and two p53 target genes (p21 and Puma) in E8.5 embryos with the indicated genotypes. SEM is from two biological replicates. Significant difference from control in the Sox2-cKO is indicated. (*) P < 0.05; (**) P < 0.01 in one-tailed t-test. (B) E10.5 littermates with control–p53null (H3f3afl/+; H3f3bfl/+; Sox2-CreTg/0; p53−/−), Sox2-cKO–p53−/+ (H3f3afl/−; H3f3bfl/−; Sox2-CreTg/0; p53−/+), or Sox2-cKO–p53null (H3f3afl/−; H3f3bfl/−; Sox2-CreTg/0; p53−/−) genotypes from a cross between a H3f3afl/fl; H3f3bfl/fl; p53−/+ female and a H3f3a−/+; H3f3b−/+; Sox2-CreTg/0; p53−/− male. Neural tube disclosure in Sox2-cKO–p53null is indicated (arrowhead); the two images below show the arrowhead-indicated region (yellow asterisk) from different angles.
To provide further evidence of p53 involvement, we attempted to rescue the Sox2-cKO phenotypes by incorporating a p53-null mutation (Jonkers et al. 2001) into our conditional knockout crosses. The p53-null background dramatically rescued the Sox2-cKO mutant growth retardation phenotype up to E11.5, which was the latest stage they survived. Although there was some variation in the extent of rescue, the majority of H3f3afl/−; H3f3bfl/−; Sox2-CreTg/0; p53−/− (Sox2-cKO–p53null) mutant embryos were slightly smaller than their control littermates, with morphologically normal body structures and organs. However, neural tube closure defects were always observed in these rescued embryos (Fig. 5B). This dramatic rescue illustrates the pivotal role that p53 plays in H3.3 knockout phenotypes. However, the p53-null rescue did not fully support development to later stages; we observed resorptions of Sox2-cKO–p53null mutants and a sharp drop in their ratio after E10.5 (data not shown).
Limited changes in the global transcriptome upon loss of H3.3
To understand the role that H3.3 plays in transcriptional regulation, we examined the gene expression profiles of the Sox2-cKO–p53null rescued embryos by RNA-seq. Three mutant (H3f3afl/−; H3f3bfl/−; Sox2-CreTg/0; Trp53−/−) and three control (H3f3afl/+; H3f3bfl/+; Sox2-CreTg/0; Trp53−/−) E10.5 male embryos were used in the sequencing experiment (Supplemental Fig. S3A). The targeted second exon's expression is completely abolished for both H3f3a and H3f3b genes, as shown in the University of California at Santa Cruz (UCSC) Genome Browser RNA-seq tracks (Supplemental Fig. S3B).
Because H3.3 is enriched in all transcribed genes (Wirbelauer et al. 2005; Goldberg et al. 2010; Szenker et al. 2011), we expected a large number of them to show significant changes in expression. After mapping the reads to the mouse reference genome (mm9), we identified close to 14,000 expressed genes (defined as a gene with more than one count per million [CPM] in two or more samples) (Supplemental Tables S1, S2). A multidimensional scaling (MDS) plot showed that the H3.3-null and control embryos formed separate clusters, indicating that the two groups have distinctive gene expression patterns (Supplemental Fig. S3C). However, only ∼5% of the transcribed genes showed statistically significant changes (with false discover rate [FDR] < 0.05 cutoff) (Fig. 6A), and their distribution was tilted toward the genes with lower expression levels compared with the total population (Supplemental Fig. S3D). Among the genes significantly changed, ∼65% of them had a less than twofold difference, suggesting minimal biological effects (Fig. 6B). More genes were up-regulated in the H3.3-null embryos (∼66% of significantly changed genes) (Fig. 6B). In addition, most of the more severely affected genes, with greater than twofold differences, had relatively low expression levels (Supplemental Fig. S3E).
Figure 6.
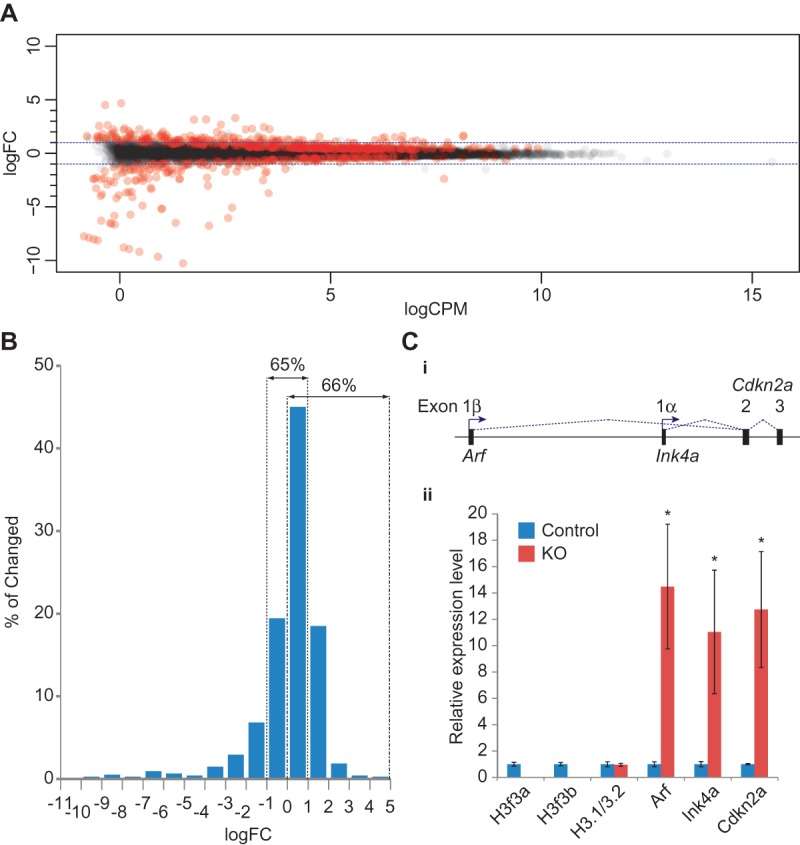
Differential expression analyses of H3.3-null embryos in a p53-null background. (A) The edgeR smear plot visualization of RNA-seq results. Each dot represents a gene; the X-axis is mean log2 CPM, indicating expression level of the genes, and the Y-axis is log2 fold change (log2FC), indicating gene expression change upon H3.3 deletion. Genes with a significant change (FDR < 0.05) are plotted in red. The horizontal dashed blue lines mark the plus or minus twofold change range. (B) Effect size distribution of significantly changed genes. Sixty-five percent of genes have changes between plus and minus twofold, and 66% of genes have positive changes. (C, panel i) Gene structure of Cdkn2a (cyclin-dependent kinase inhibitor 2A); two splice isoforms, Ink4a and Arf, are driven by different promoters and have different first exons (1α and 1β, respectively). (Panel ii) Relative expression levels of H3f3a, H3f3b, H3.1/3.2, Arf (detected by primers spanning exons 1β/2), Ink4a (detected by primers spanning exons 1α/2), and Cdkn2a total output (detected by primers spanning exons 2/3) in H3.3 knockout (KO) versus control embryos. n = 3. (*) P < 0.05 in one-tailed t-test.
Because the RNA-seq analysis method (edgeR) normalizes for total read counts in each library, it cannot detect global expression shifts; e.g., a down-regulation of all transcribed genes in the H3.3-null embryos. To rule out this possibility, we selected six genes that did not show significant differences in the RNA-seq analysis and spanned a wide range of CPMs for RT-qPCR validation. The results were consistent with the RNA-seq analysis and showed that there was not a global expression shift (Supplemental Fig. S3F). Furthermore, there were no significant differences in total RNA output per embryo between the H3.3-null and control embryos (Supplemental Fig. S3G). Therefore, we can rule out the possibility of a global and proportional up-regulation/down-regulation of every gene in the H3.3-null embryos. To determine whether transcription in specific genomic domains was susceptible to loss of H3.3, we examined the genomic distribution of significantly changed genes (Supplemental Fig. S3H), expecting to find down-regulated and up-regulated genes in separate clusters. However, we could not find any specific patterns and ruled out localized gene expression changes.
A recent report proposed a role for H3.3 in the silencing of endogenous retroviral elements in mouse ES cells (Elsasser et al. 2015); therefore, we specifically examined the expression of repetitive elements (REs) in our RNA-seq data. However, statistical analysis did not find clear separation between the control and H3.3 mutant embryos by their RE expression patterns (Supplemental Fig. S3I). Furthermore, among the >1000 REs found expressed in the embryos, only one element [“(A)n” element] showed a statistically significant change in the mutant embryos (Supplemental Fig. S3J; Supplemental Table S3). Therefore, H3.3's effect on the expression or suppression of REs in the developing embryo appears to be minimal.
Intriguingly, Cdkn2a (cyclin-dependent kinase inhibitor 2A), an important tumor suppressor gene (Kim and Sharpless 2006), was the second most highly up-regulated gene in the RNA-seq data analysis (the most up-regulated gene, leading by a very small margin of fold change, was a pseudogene) (Supplemental Table S2). Cdkn2a has two transcriptional isoforms produced by alternative promoter usage: The α promoter produces the Ink4a transcript, while the β promoter leads to Arf expression (Fig. 6C, panel i). We confirmed the up-regulation of Cdkn2a by RT-qPCR. Specific primers were designed to gauge Arf- or Ink4a-specific expression or the total output of both transcripts. The results indicated that both transcription isoforms were up-regulated to similar levels in H3.3 knockout embryos relative to the control (Fig. 6C, panel ii). At the same time, we confirmed the complete deletion of H3.3 genes. We also examined the level of canonical H3, which was reported to be up-regulated in H3.3 mutant flies (Hodl and Basler 2009), but found no change.
The biological effects of the gene expression changes were analyzed by the Ingenuity Pathway Analysis software (http://www.ingenuity.com), with a FDR < 0.05 cutoff. The canonic pathway (Supplemental Fig. S4; Supplemental Table S4) and disease and biofunction pathway (Supplemental Fig. S5; Supplemental Table S5) analyses suggested that the hematological and immune system development is most likely affected by these changes.
H3.3 depletion leads to mitotic defects and genome instability
The p53-null mutation enables derivation of H3.3 knockout/p53null MEF lines (from Sox2-cKO–p53nullembryos). H3.3-null MEFs derived from Sox2-cKO embryos with wild-type p53 grew very poorly and were extremely difficult to expand (data not shown). In contrast, H3.3 knockout/p53null MEFs grew well and were easily expanded, albeit slightly less proliferatively than MEFs derived from the control littermates. These robustly growing H3.3-null MEFs allowed us to explore the mechanisms behind the H3.3 depletion-triggered cell death and growth arrest. We used only early passage MEFs (passage 2 [P2] to P5) in our experiments to minimize the effect of the in vitro culture environment.
Interestingly, similar to the H3.3 knockout ES cells, H3.3 knockout MEFs showed dramatically increased mitotic defects, including lagging chromosomes and anaphase bridges (Fig. 7A,B). To test for the involvement of ATRX in the phenotype for its role in maintaining heterochromatic chromosome structures, we performed fluorescent in situ hybridization (FISH) with a telomeric probe and immunofluorescence with an antibody against ATRX. ATRX localization to the pericentrimetric heterochromatin appeared to be unaffected by loss of H3.3 even on the lagging chromosomes (Fig. 7A). We also performed chromatin immunoprecipitation (ChIP) to assess ATRX binding to telomeric sequence repeats in H3.3 knockout/p53null MEFs but observed no change compared with controls (Supplemental Fig. S6). In the mitotic cells with anaphase bridges, we observed telomere FISH signals in the middle of the bridging chromosomes (Fig. 7A), indicating dicentric chromosomes formed through telomeric fusions.
Figure 7.

Mitotic defects, karyotypic abnormality, and DNA damage in H3.3 knockout (KO)/p53null MEFs. (A) Mitotic abnormalities of H3.3 knockout/p53null MEFs. ATRX immunofluorescence signal on lagging chromosomes (arrows) and telomere FISH signal (TelC) in the middle of bridging chromosomes (arrowheads) are indicated. (B) Percentages of mitotic cells with abnormalities in control and H3.3 knockout/p53null MEFs. Twenty-five mitotic events were scored in each line. (**) P < 0.01 in χ2 test. (C) Distribution of chromosome numbers counted in metaphase spreads made from H3.3 knockout/p53null MEF lines (bottom) and their littermate control lines (top). Colors denote close to normal 2N (40) counts (green), 4N (80) counts (yellow), and 8N (160) counts (red). (D) rH2A.X levels in H3.3 knockout/p53null and control MEFs by Western blot. Lanes 2 and 4 are mutant cell lines, and lanes 1 and 3 are their littermate control lines, respectively. (E) Relative expression levels of H3.3 and rH2A.X calculated from D, normalized to total H3 level. (*) P < 0.05 in one-tailed t-test.
We made metaphase spreads and found dramatically increased numbers of cells with abnormal numbers of chromosomes in H3.3 knockout/p53null MEFs (Fig. 7C). The majority of them have chromosome gains. Loss of H3.3 appears to cause polyploidy and aneuploidy, presumably resulting from the faulty mitotic processes (Davoli and de Lange 2011; Ganem and Pellman 2012).
Finally, we observed elevated levels of S139 phosphorylation of histone H2A.X (rH2A.X) in H3.3 knockout/p53null MEFs (Fig. 7D,E), a canonical marker for DNA double-strand breaks (Rogakou et al. 1998). This indicates increased DNA damage in H3.3 knockout cells.
H3.3 is required for normal heterochromatin function at telomeres, centromeres, and pericentromeric regions
To find the underlying cause of the mitotic defects in H3.3-null MEFs, we examined the integrity of telomeres, distribution of heterochromatic histone marks, and chromatin compaction at the telomeres, centromeres, and pericentromeric regions where H3.3 was reported to be enriched.
To determine whether H3.3 knockout/p53null MEF lines had aberrant telomere sister chromatid exchange (tSCE), we applied the chromosome orientation FISH (CO-FISH) technique (Williams et al. 2011). Significantly increased rates of tSCE events were observed in the H3.3-null MEFs (Fig. 8A,B), indicating excessive recombination events in telomeres as a result of compromised telomere structure or maintenance mechanisms (Bailey et al. 2004).
Figure 8.
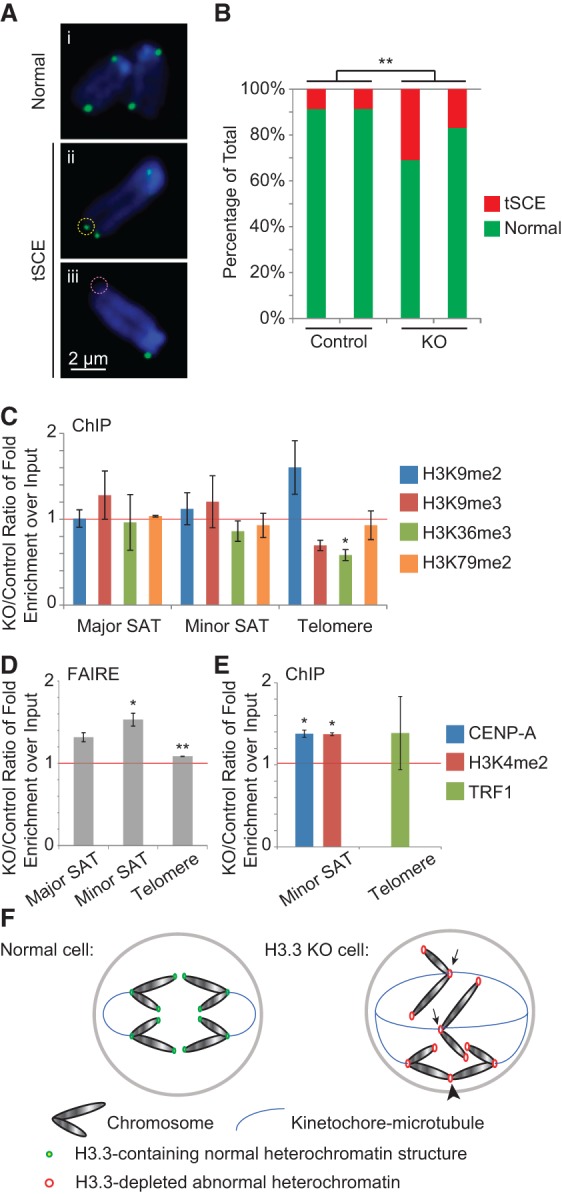
Telomere dysfunction and heterochromatin defects in H3.3 knockout (KO)/p53null MEFs. (A) CO-FISH results showing normal chromosomes (panel i) and chromosomes with tSCEs, which have either gained additional (yellow dashed circle) (panel ii) or lost (pink dashed circle) (panel iii) FISH signals. (B) Percentages of chromosomes with tSCEs in control and H3.3 knockout/p53null MEF lines. (**) P < 0.01 in χ2 test. (C,E) ChIP-qPCR results with different antibodies and primers amplifying different repeat sequences. (D) FAIRE (formaldehyde-assisted isolation of regulatory elements)-qPCR results showing increased enrichment of repeat sequences in H3.3 knockout MEFs normalized to littermate control cell lines. In C–E, (*) P < 0.05 and (**) P < 0.01 in one-tailed t-test. (F) Model showing how loss of H3.3 affects chromosome segregation and genome integrity. Arrows point to aberrant organized kinetochores that lead to chromosome lagging. The arrowhead points to telomere fusion leading to the anaphase bridge.
Changes in local histone marks can compromise the functions of telomeres and centromeres (Jones et al. 2008; O'Sullivan et al. 2014). Therefore, we also examined changes in the characteristic histone marks, including dimethylation at H3K9 and H3K79 and trimethylation at H3K9 and H3K36 (Jones et al. 2008; Chantalat et al. 2011), at pericentromeric (major satellite) and centromeric (minor satellite) regions and telomere repeats with ChIP-qPCR assays. No dramatic changes were found at the satellite repeats; however, there was a general trend of reduced H3K9 trimethylation and significant reduction of H3K36 dimethylation marks at the telomere (Fig. 8C). When global levels of these marks in H3.3-null cells were examined by Western blotting, we did not see a statistically significant reduction in any of the histone marks, but a general reduction of all of the marks was observed (Supplemental Fig. S7A,B).
Heterochromatin compaction at telomeres, centromeres, and pericentromeric regions plays an essential role for their functional integrity (Lange et al. 2013; Episkopou et al. 2014). To quantitatively measure the compactness of chromatin at these regions, we used the formaldehyde-assisted isolation of regulatory elements (FAIRE) technique, which is a sensitive method for detecting open chromatin regions in the genome (Giresi et al. 2007). In the FAIRE procedure, by chemical cross-linking, mechanical shearing, and organic extraction, nucleosome-free genomic DNA is enriched in the extract. H3.3-null cells always produced slightly higher yield than the controls (Supplemental Fig. S7C). This may be an indicator of more open chromatin regions in the genome. We used qPCR to quantify the relative enrichment of telomeric, centromere, and pericentromeric repeat sequences in each extract sample and found a significant increase in FAIRE signal with the H3.3-null cells (Fig. 8D). This indicates that the heterochromatin at these regions have adopted a more open structure in the absence of H3.3.
To further investigate the possible causes of the centromeric and telomeric abnormalities in H3.3-null cells, we examined the expression levels and site-specific enrichments of centromeric histone H3 variant CENP-A, H3K4 dimethylation, and the double-stranded telomeric repeat-binding proteins TRF1 and TRF2. CENP-A defines centromere identity, and its incorporation is partly through replacing the so-called “placeholder” centromeric H3.3 during G1 phase (Dunleavy et al. 2011). H3K4 dimethylation is found between CENP-A nucleosome blocks (Sullivan and Karpen 2004). Thus, depletion of H3.3 could result in a reduction in CENP-A and corresponding H3K4 dimethlyation, causing segregation defects. TRF1 and TRF2 are DNA-binding proteins in the telomere-protecting complex shelterin, and their binding may be influenced by the local chromatin environment (Galati et al. 2015). Thus, without H3.3, shelterin may not bind to the telomeres, and this would result in a DNA damage response that leads to replicative senescence or apoptosis. Contrary to our expectations, CENP-A binding and H3K4 dimethylation levels at centromeres increased proportionally in H3.3-depleted cells (Fig. 8E), suggesting a counterbalancing role for H3.3 in mediating the level of CENP-A binding and H3K4 dimethylation in the centromere. TRF1 binding to telomeres did not show consistent changes (Fig. 8E). To rule out nonspecific binding of the CENP-A and TRF antibodies, we confirmed their ChIP specificity (Supplemental Fig. S7D). We also quantified the global levels of CENP-A, H3K4 dimethylation, and the TRF proteins in the H3.3-null and control MEFs, and, while there appeared to be more of CENP-A and less of the TRF proteins, the differences were not statistically significant (Supplemental Fig. S7E,F).
Discussion
Our data provide an initial understanding of H3.3 function during mouse development. H3.3 is essential for mouse embryogenesis, as revealed in the double-knockout and Sox2-cKO experiments. All of the H3.3-null mutants die in utero with severe developmental retardation. This developmental retardation was caused in large part by p53-mediated cell death and cell cycle arrest, as we observed up-regulation of p53 targets that are directly involved in these processes, and, furthermore, a p53-null mutation effectively rescued the growth phenotype.
H3.3 appears largely dispensable for normal gene regulation in embryonic development. The rare double-knockout mutant embryos that survived past implantation showed correct embryonic patterning, indicated by their mesoderm marker gene expression pattern. The Sox2-cKO embryos, albeit still growth-retarded, also showed correct patterning and functional cell differentiation. In addition, when the growth retardation phenotype was rescued by a p53 mutation, the Sox2-cKO–p53null embryos, with the exception of the neural tube closure defect and smaller size, developed with normal body plans and generated normal structures and organs.
The RNA-seq results provide further evidence that H3.3 has a limited role in transcriptional regulation during development. Although H3.3 was found enriched in all transcribed genes (Wirbelauer et al. 2005), only ∼5% of transcribed genes were affected by its deletion. Because higher H3.3 incorporation and nucleosome turnover are positively associated with higher transcriptional levels (Deal et al. 2010), we expected highly transcribed genes in the control embryos to be more significantly reduced in double-knockout embryos. However, we did not observe an inverse correlation between fold changes and expression levels, and, surprisingly, even more genes were up-regulated in embryos without H3.3. Whether the affected genes were directly influenced by the absence of H3.3 incorporation into them or by cellular physiological changes altering other gene regulation mechanisms remains to be determined. However, with the transcriptome as a whole remaining largely intact without H3.3, we can conclude that H3.3 does not play a pivotal role in transcriptional regulation during mouse embryonic development. Our finding falls in line with an observation in H3.3-null flies, where H3.3 depletion affected relatively very few genes during embryonic development (Hodl and Basler 2009), although the reported compensatory up-regulation of canonic H3 variants in H3.3 mutant flies was not observed in the H3.3-null mouse embryos. From an evolutionary standpoint, H3.3 may have never played a dominant role in developmental gene regulation.
On the other hand, H3.3 appears to play a major role in maintaining genome integrity during development. In both ES cells and MEFs, H3.3 loss caused a dramatic increase of mitotic defects indicative of chromosome structure dysfunctions, including anaphase bridges and lagging chromosomes. Prolonged nonclearance of chromosomes at the midzone can delay mitosis and cause cleavage furrow regression, leading to endoreplication due to nonseparation of the duplicated genome (Pampalona et al. 2012). Lagging chromosomes may fail to integrate into the daughter nuclei and become lost, causing aneuploidy in subsequent cell divisions (Terradas et al. 2010). Accordingly, we observed a dramatic increase of polyploidy and aneuploidy in the H3.3 knockout/p53null MEFs. The p53-null background likely exacerbated the phenotype; otherwise, these cells with abnormal karyotypes should have been largely eliminated in the presence of wild-type p53 (Aylon and Oren 2011). In addition, anaphase bridges and lagging chromosomes in mitosis result in DNA damage (Hayashi and Karlseder 2013), as we observed increased rH2A.X levels in these mutant cells. Karyotype abnormality and DNA damage accumulation are among the most common p53 pathway activators (Aylon and Oren 2011; Hayashi and Karlseder 2013), conferring on p53 the central role in mediating the H3.3-null mutant embryonic phenotype. In conclusion, an essential function of H3.3 in mouse development is to maintain genome integrity by supporting functional chromosome structures, ensuring a faithful partition of replicated genomes during cell division.
The dramatic induction of Cdkn2a upon H3.3 loss in a p53-null background lends further support to our model and helps explain the rescue phenotype. The two distinctive proteins encoded by Cdkn2a—INK4A and ARF—are both critical tumor suppressors, albeit acting via different pathways (Kim and Sharpless 2006). INK4A binds CDK4/6 and stabilizes pRB protein, while ARF inactivates the p53 inhibitor MDM2 and thus activates the p53 pathway. Their expression can be stimulated by DNA damage and telomere dysfunction independent of p53 (Stott et al. 1998; Meng et al. 2003; Jacobs and de Lange 2004), and their cell cycle inhibition function is not solely dependent on p53 (Sherr et al. 2005; Britigan et al. 2014). In the Sox2-cKO–p53null embryos, the H3.3 ablation-induced telomere dysfunction and DNA damage are the canonic biological triggers for Cdkn2 expression, and the p53-independent cell cycle suppression mediated by ARF and INK4A likely leads to the imperfect rescue by the p53-null mutation that we observed; i.e., smaller embryo size, neural tube disclosure, and the inability to develop to term.
Epigenetic changes may be involved in the H3.3 deficiency-induced mitotic chromosomal abnormalities. The increase in tSCE is a strong indicator of compromised telomere function (Bailey et al. 2004). The decrease in H3K36 trimethylation at telomeres in H3.3-null cells suggests a role for H3.3 in its maintenance. Furthermore, we detected more open chromatin at the telomere, centromeres, and pericentromeric repeat regions in the H3.3-null MEFs, indicating the involvement of H3.3 in heterochromatin compaction. The observed increase in H3K4 dimethylation and CENP-A binding at centromeres indicates abnormal changes in the centromeric chromatin environment. The observed changes may be the cause or, alternatively, a result of centromeric dysfunction in H3.3-depleted cells (Sullivan and Karpen 2004). How the lack of H3.3 as the “placeholder” for CENP-A deposition at the centromeres leads to the abnormal changes remains to be determined (Dunleavy et al. 2011).
Our results also suggest an intricate relationship between the ATRX chromatin remodeling complex and H3.3. The ATRX chromatin remodeling complex is known to mediate H3.3 incorporation at telomeres and pericentromeric heterochromatin (Goldberg et al. 2010), and the embryonic Sox2-cKO phenotypes bear a striking resemblance to that of an Atrx mutant (with Gata1-Cre-induced global deletion at morula stage) (Garrick et al. 2006). Both H3.3 and Atrx knockouts induced growth retardation due to reduced cell proliferation and increased cell death without patterning defects; they even appear highly similar morphologically. ATRX's role in maintaining functional chromosome structures has been well documented. ATRX loss is associated with telomere dysfunction in cancer cells (Heaphy et al. 2011; Lovejoy et al. 2012). Loss of ATRX leads to centromere instability and aneuploidy in mouse oocytes and preimplantation embryos (Baumann et al. 2010). ATRX deficiency by conditional knockouts in neuronal cell lineages or RNAi knockdown in cultured cells induced cell death, telomere dysfunction, and prolonged mitosis, with defects including anaphase bridges and lagging chromosomes (Ritchie et al. 2008; Watson et al. 2013). These are the same defects that we observed in the H3.3 knockout MEFs. Furthermore, the cell death/tissue growth phenotypes of the Atrx conditional mutants can be effectively rescued in a p53-null background (Seah et al. 2008), reminiscent of the rescue that we observed in Sox2-cKO–p53null mutants. The increased tSCE phenotype in H3.3-null cells indicated telomere dysfunction, which is another well-documented feature of ATRX-deficient cells (Watson et al. 2013). All of the evidence suggests that H3.3 and ATRX cooperate to maintain or prepare chromosome structures for mitosis to proceed without errors. Therefore, even though the recruitment of ATRX to telomeres and the pericentromeric region appeared unaffected in the absence of H3.3, active incorporation of H3.3 into these heterochromatic structures by ATRX is essential for its normal function at these loci.
With these lines of evidence, we propose a model in which H3.3 maintains the histone marks and compact structures of the heterochromatin at telomeres, centromeres, and pericentromeric regions by either changing the chromatin properties through its presence at the sites or supporting the ATRX complex that remodels chromatin with repetitive sequences (Law et al. 2010). Loss of H3.3 leads to a decrease in these essential characteristics and disrupts the normal structure and function of telomeres and centromeres. The resulting telomere fusion and centromeric abnormalities eventually lead to the observed mitotic defects, including anaphase bridges and lagging chromosomes (Fig. 8F).
Contrary to previous studies showing compromised viability and fertility (Couldrey et al. 1999; Bush et al. 2013; Tang et al. 2013, 2015; Yuen et al. 2014), our single knockouts of H3f3a and H3f3b genes did not cause any obvious phenotype. This may be due to genetic background differences. The mice used in our experiments were from mixed backgrounds (mainly C57BL/6 and 129). The increased genetic heterogeneity may have contributed to the better viability and fertility of our knockouts as a result of hybrid vigor. Aside from the lack of phenotypes in the single-knockout mutants, the distinctive AnullBhet and AhetBnull compound mutant phenotypes shed some light on the evolution of the duplicated H3.3-encoding genes. There is an obvious functional redundancy between the H3f3a and H3f3b genes, since they encode the exact same amino acid sequence, and loss of either one fails to produce a phenotype. However, AHetBnull mice with only a single wild-type H3f3a allele can survive to adulthood with only a male infertility phenotype, while the AnullBhet mutants with only a single wild-type H3f3b allele do not survive postnatally. These phenotypical differences probably reflect changes in promoter activity (either levels or patterns of expression) or post-transcriptional regulation (H3f3b has isoforms with long 3′ untranslated regions [UTRs]) of these two genes. Their differential expression patterns in different organs also support this argument—H3f3a has more uniform expression across organs, which may explain why a single H3f3a allele is more supportive to mouse life than a single H3f3b.
The disappearance of germ cells in the AhetBnull testis is also a very interesting phenotype. Germ cells may require more chromatin remodeling activities to maintain their special genomic functions; e.g., erasure of parental imprinting (Seki et al. 2005), leading to more H3.3 incorporation to the genome. Therefore, reduction of H3.3 may cause more dramatic transcriptional or chromosomal disturbances, leading to their demise. The high demand of H3.3 in germ cells is also reflected by the highest expression levels of both H3f3a and H3f3b genes in the testis compared with other organs. It will require more detailed studies to determine at what stage the germ cells are depleted and the exact causes.
Materials and methods
qPCR
For gene expression analysis, total RNA was extracted with Trizol (Life Technologies), treated with DNase I (Promega), and reverse-transcribed with ProtoScript II (New England Biolabs) and Random primer mix (New England Biolabs). Gene-specific primers are listed in Supplemental Table S6. Pancreas tissue was first dropped into RNAlater (Life Technologies) before further processing. 18S rRNA was used as the reference gene.
For genotyping, genomic DNA was extracted from adult tissue by alkaline lysis method. Tissue was placed in PCR strips; heated in 50 µL of 25 mM NaOH, 0.2 mM EDTA, and 0.04% Triton-X 100 for 1 h at 95°C; neutralized with 50 µL of 40 mM Tris-HCl (pH unadjusted); and diluted with 100 µL of water. Extract was cleaned by centrifugation at 3000g for 10 min. The supernatant was used as template in qPCR reaction. For embryonic tissue, genomic DNA was extracted by proteinase K digestion method. Tissue was digested in 20 µL of 10 mM TE 8.0 with 0.2% Triton-X 100 and 0.4 mg/mL proteinase K (added freshly before use) overnight at 56°C, heat-inactivated for 10 min at 95°C, diluted with water, and cleared by centrifugation.
SsoFast reagent (Bio-Rad) and CFX384 real-time system (Bio-Rad) were used for qPCR. qPCR reactions were run with the following protocol: 3 min at 95.0°C and 40 times for 10 sec at 95.0°C, 5 sec at 60.0°C, and 20 sec at 72°C per plate read. Five microliters or 10 µL of total reaction volume was used in reaction.
Mouse strains
The E14Tg2A.4 (E14) ES cell line (Skarnes 2000) was used for gene targeting. BAC clones of 129 genetic background bMQ107m17 and mMQ457f13 (Source BioScience) for H3f3a and H3f3b genes, respectively, were used for constructing targeting vectors. φC31 (Raymond and Soriano 2007) and FLPe (Farley et al. 2000) mice were used for deleting the Neo and gene trap cassettes, respectively. Primers for genotyping are listed in Supplemental Table S7.
Cell culture
For gene targeting, E14 cells were cultured in GMEM (Life Technologies) with 15% fetal calf serum (FCS), glutamine, sodium pyruvate, nonessential amino acids, penicillin/streptomycin, and ESGROW/LIF (Millipore) supplements on gelatin-coated plates without feeder.
Conditional ES cell lines were derived from blastocysts flushed from the uterus on 3.5 d post-coitum (dpc) in crosses between H3f3afl/fl; H3f3bfl/fl females and H3f3a−/+; H3f3b−/+; CAG-CreERTg/0 males. They were maintained on γ-irradiated wild-type MEF feeders. Before the H3.3 knockout/sequencing experiments, they were passaged onto feeder-free plates with preplating on gelatin-coated plates to eliminate feeder cells. TAM was added into culture medium at 1 µg/mL concentration and changed daily. After 2 d of TAM treatment, cells were changed back into normal medium without TAM and cultured for another day for recovery before being harvested.
MEFs for experiments were derived from E10.5 embryos. Whole embryos were minced into chunks of tissue by passing slowly through 19-gauge needles five to six times and plated on gelatin-coated plates. They were cultured in DMEM with 10% FCS, glutamine, sodium pyruvate, nonessential amino acids, and penicillin/streptomycin. When MEFs that grew out from the chunks reached confluence, they were passaged, and the tissue chunks were filtered out with 100-µm cell strainers (Fisher Scientific).
Whole-mount in situ hybridization
We followed the standard protocol for whole-mount in situ hybridization (Nagy 2003). Embryos were fixed in 4% paraformaldehyde (PFA) and hybridized with probe labeled with digoxigenin-11-UTP (Roche). Full-length cDNA of Brachyury was used as the template for probe synthesis. An anti-Dig-AP Fab (Roche) fragment and BM Purple (Roche) were used for detection and visualization of the hybridized probe.
Lysotracker staining
For Lysotracker staining, we follow the protocol as previously described (Fogel et al. 2012). Embryos were dissected in HBSS (Life Technologies), stained with LysoTracker Red DND-99 (Life Technologies), fixed in 4% PFA, cleared in 50% glycerol, and imaged.
BrdU labeling
Pregnant females were intraperitoneally injected with 50 mg/kg BrdU 3 h before being euthanized and having embryos dissected out. Embryos were fixed, sucrose-protected, and frozen-sectioned, antigen-retrieved by heating for 5 min to 85°C in 75% formamide/PBS, and detected with anti-BrdU antibody (1:200 dilution; Abcam, BU1/75 ICR1).
Western blot
Whole histone preparations were extracted by acid extraction as described (Shechter et al. 2007). Proteins were separated on 12.5% SDS-PAGE and detected with anti-H3.3 (1:40 dilution; Abnova, 2D7-H1), anti-H3 (1:10,000; Abcam, ab1791), and anti-rH2A.X (1:1000; Cell Signaling Technology, 20E3) antibodies; anti-H3K9 dimethylation (1:1000; Abcam, ab1220); anti-H3K9 trimethylation (1:1000; Abcam, ab8898); and anti-H3K79 dimethylation (1:1000; Abcam, ab3594).
FISH and immunofluorescence
Cells were grown on gelatin-coated coverslips, fixed with 4% PFA, in situ-hybridized with Alexa 488-conjugated TelC PNA oligo (PNA Bio, Inc.) following the manufacturer's instructions (except omitting RNase/pepsin treatments) and ethanol dehydration steps, and then immunostained with anti-ATRX primary (Santa Cruz Biotechnology, H-300) and then Alexa 568-conjugated secondary antibodies. Z-stack images were deconvolved and flattened by maximal intensity projection with AxioVision software (Carl Zeiss).
Metaphase spreads and CO-FISH
Cells were treated with KaryoMax (Life Technologies) for 4 h, trypsinized, hypotonized in 75 mM KCl for 10 min, fixed in methanol with glacial acetic acid (5:2) overnight or longer at 4°C, dropped on distilled water-flooded uncoated slides, stained with DAPI, and imaged, and chromosomes were counted.
For CO-FISH, we followed the previously described protocol (Williams et al. 2011). Alexa 488-conjugated TelC PNA oligos (PNA Bio, Inc.) were used in hybridization. For scoring the tSCE phenotype, FISH signals were scored blind for statistical analyses. Comparable numbers of chromosomes (from 20–50 spreads) were scored for each pair of sibling MEF lines.
ChIP-qPCR
For histone ChIP, we followed the previously described protocol (Schmidt et al. 2009) with specific details as follows. Cells were fixed with 0.6% formaldehyde for 10 min at room temperature. Chromatin shearing was carried out in LB3 in 15-mL clear tubes with Bioruptor (Diagenode), with two rounds of six cycles of 30-sec pulses (high) and 1-min breaks separated by a 10-min cool down on ice. Protein A/G+ agarose beads (Santa Cruz Biotechnology, sc-2003) were used. Antibodies were the same ones used in the Western blotting.
For Atrx ChIP, cells were fixed as previously described (Law et al. 2010). ChIP was carried out following the previously described MNase protocol (Kouskouti and Talianidis 2005) except omitting the sucrose gradient extraction step. Protein A/G Dynabeads (Life Technologies) were used. Anti-Atrx (Santa Cruz Biotechnology, H-300) and control rabbit IgG (Sigma, I5006) antibodies were used.
Primers for quantification of major/minor satellite and telomere repeat sequences are listed in Supplemental Table S6.
FAIRE
For FAIRE, we followed the previously described protocol (Simon et al. 2013). Cell fixation and chromatin shearing conditions were the same as in ChIP. Primer pairs are list in Supplemental Table S6.
RNA-seq
The RNA-seq library was prepared with KAPA stranded mRNA-seq kit (KapaBiosystems, catalog no. KK8420), following the manufacturer's instructions, for 6 min at 85°C at the RNA fragmentation step. Total RNA was extracted from embryos with Trizol, DNase I-digested, and cleaned up with RNeasy columns (Qiagen). RNA samples (0.5 µg) were used for library generation. Libraries were pooled (four per lane) and sequenced by Illumina HiSeq 2500 sequencer. The RNA-seq FASTQ files were aligned to the UCSC mm9 genome using TopHat2 (Trapnell et al. 2009) and Bowtie2 (Langmead and Salzberg 2012) using the iGenomes reference sequences (http://support.illumina.com/sequencing/sequencing_software/igenome.ilmn) and annotations provided by Illumina. Annotation for REs came from RepeatMasker downloaded from the UCSC Genome Browser. Read counts per gene and RE were generated using HTSeq-count (http://www-huber.embl.de/users/anders/HTSeq/doc/count.html), and differential expression analysis was performed using edgeR (Robinson et al. 2010). Normalized BEDGraph files for UCSC genome browser tracks were generated using BEDTools (Quinlan and Hall 2010).
Data access
The RNA-seq data have been deposited in NCBI's Gene Expression Omnibus and are accessible through GEO series accession number GSE69771 (http://www.ncbi.nlm.nih.gov/geo/query/acc.cgi?acc=GSE69771).
Supplementary Material
Acknowledgments
We thank all members of the Magnuson laboratory for helpful comments on manuscript preparation. We thank Dr. Gregory E. Crawford for his assistance in experiments and his critical input on the manuscript. This work was supported by National Institutes of Health grant RO1 GM101974.
Footnotes
Supplemental material is available for this article.
Article is online at http://www.genesdev.org/cgi/doi/10.1101/gad.264150.115.
References
- Adam S, Polo SE, Almouzni G. 2013. Transcription recovery after DNA damage requires chromatin priming by the H3.3 histone chaperone HIRA. Cell 155: 94–106. [DOI] [PubMed] [Google Scholar]
- Aylon Y, Oren M. 2011. p53: guardian of ploidy. Mol Oncol 5: 315–323. [DOI] [PMC free article] [PubMed] [Google Scholar]
- Bailey SM, Brenneman MA, Goodwin EH. 2004. Frequent recombination in telomeric DNA may extend the proliferative life of telomerase-negative cells. Nucleic Acids Res 32: 3743–3751. [DOI] [PMC free article] [PubMed] [Google Scholar]
- Banaszynski LA, Wen D, Dewell S, Whitcomb SJ, Lin M, Diaz N, Elsasser SJ, Chapgier A, Goldberg AD, Canaani E, et al. 2013. Hira-dependent histone H3.3 deposition facilitates PRC2 recruitment at developmental loci in ES cells. Cell 155: 107–120. [DOI] [PMC free article] [PubMed] [Google Scholar]
- Baumann C, Viveiros M, De La Fuente R. 2010. Loss of maternal ATRX results in centromere instability and aneuploidy in the mammalian oocyte and pre-implantation embryo. PLoS Genet 6: e1001137. [DOI] [PMC free article] [PubMed] [Google Scholar]
- Behjati S, Tarpey PS, Presneau N, Scheipl S, Pillay N, Van Loo P, Wedge DC, Cooke SL, Gundem G, Davies H, et al. 2013. Distinct H3F3A and H3F3B driver mutations define chondroblastoma and giant cell tumor of bone. Nat Genet 45: 1479–1482. [DOI] [PMC free article] [PubMed] [Google Scholar]
- Britigan EM, Wan J, Zasadil LM, Ryan SD, Weaver BA. 2014. The ARF tumor suppressor prevents chromosomal instability and ensures mitotic checkpoint fidelity through regulation of Aurora B. Mol Biol Cell 25: 2761–2773. [DOI] [PMC free article] [PubMed] [Google Scholar]
- Bush KM, Yuen BT, Barrilleaux BL, Riggs JW, O'Geen H, Cotterman RF, Knoepfler PS. 2013. Endogenous mammalian histone H3.3 exhibits chromatin-related functions during development. Epigenetics Chromatin 6: 7. [DOI] [PMC free article] [PubMed] [Google Scholar]
- Chantalat S, Depaux A, Hery P, Barral S, Thuret JY, Dimitrov S, Gerard M. 2011. Histone H3 trimethylation at lysine 36 is associated with constitutive and facultative heterochromatin. Genome Res 21: 1426–1437. [DOI] [PMC free article] [PubMed] [Google Scholar]
- Chen P, Zhao J, Wang Y, Wang M, Long H, Liang D, Huang L, Wen Z, Li W, Li X, et al. 2013. H3.3 actively marks enhancers and primes gene transcription via opening higher-ordered chromatin. Genes Dev 27: 2109–2124. [DOI] [PMC free article] [PubMed] [Google Scholar]
- Couldrey C, Carlton MB, Nolan PM, Colledge WH, Evans MJ. 1999. A retroviral gene trap insertion into the histone 3.3A gene causes partial neonatal lethality, stunted growth, neuromuscular deficits and male sub-fertility in transgenic mice. Hum Mol Genet 8: 2489–2495. [DOI] [PubMed] [Google Scholar]
- Cox SG, Kim H, Garnett AT, Medeiros DM, An W, Crump JG. 2012. An essential role of variant histone H3.3 for ectomesenchyme potential of the cranial neural crest. PLoS Genet 8: e1002938. [DOI] [PMC free article] [PubMed] [Google Scholar]
- Davoli T, de Lange T. 2011. The causes and consequences of polyploidy in normal development and cancer. Annu Rev Cell Dev Biol 27: 585–610. [DOI] [PubMed] [Google Scholar]
- Deal RB, Henikoff JG, Henikoff S. 2010. Genome-wide kinetics of nucleosome turnover determined by metabolic labeling of histones. Science 328: 1161–1164. [DOI] [PMC free article] [PubMed] [Google Scholar]
- Drane P, Ouararhni K, Depaux A, Shuaib M, Hamiche A. 2010. The death-associated protein DAXX is a novel histone chaperone involved in the replication-independent deposition of H3.3. Genes Dev 24: 1253–1265. [DOI] [PMC free article] [PubMed] [Google Scholar]
- Dunleavy EM, Almouzni G, Karpen GH. 2011. H3.3 is deposited at centromeres in S phase as a placeholder for newly assembled CENP-A in G(1) phase. Nucleus 2: 146–157. [DOI] [PMC free article] [PubMed] [Google Scholar]
- Elsaesser SJ, Goldberg AD, Allis CD. 2010. New functions for an old variant: no substitute for histone H3.3. Curr Opin Genet Dev 20: 110–117. [DOI] [PMC free article] [PubMed] [Google Scholar]
- Elsasser SJ, Noh KM, Diaz N, Allis CD, Banaszynski LA. 2015. Histone H3.3 is required for endogenous retroviral element silencing in embryonic stem cells. Nature 522: 240–244. [DOI] [PMC free article] [PubMed] [Google Scholar]
- Episkopou H, Draskovic I, Van Beneden A, Tilman G, Mattiussi M, Gobin M, Arnoult N, Londono-Vallejo A, Decottignies A. 2014. Alternative Lengthening of Telomeres is characterized by reduced compaction of telomeric chromatin. Nucleic Acids Res 42: 4391–4405. [DOI] [PMC free article] [PubMed] [Google Scholar]
- Farley FW, Soriano P, Steffen LS, Dymecki SM. 2000. Widespread recombinase expression using FLPeR (flipper) mice. Genesis 28: 106–110. [PubMed] [Google Scholar]
- Fogel JL, Thein TZ, Mariani FV. 2012. Use of LysoTracker to detect programmed cell death in embryos and differentiating embryonic stem cells. J Vis Exp 68: 4254. [DOI] [PMC free article] [PubMed] [Google Scholar]
- Galati A, Micheli E, Alicata C, Ingegnere T, Cicconi A, Pusch MC, Giraud-Panis MJ, Gilson E, Cacchione S. 2015. TRF1 and TRF2 binding to telomeres is modulated by nucleosomal organization. Nucleic Acids Res 10.1093/nar/gkv507. [DOI] [PMC free article] [PubMed] [Google Scholar]
- Ganem NJ, Pellman D. 2012. Linking abnormal mitosis to the acquisition of DNA damage. J Cell Biol 199: 871–881. [DOI] [PMC free article] [PubMed] [Google Scholar]
- Garrick D, Sharpe JA, Arkell R, Dobbie L, Smith AJ, Wood WG, Higgs DR, Gibbons RJ. 2006. Loss of Atrx affects trophoblast development and the pattern of X-inactivation in extraembryonic tissues. PLoS Genet 2: e58. [DOI] [PMC free article] [PubMed] [Google Scholar]
- Giresi PG, Kim J, McDaniell RM, Iyer VR, Lieb JD. 2007. FAIRE (formaldehyde-assisted isolation of regulatory elements) isolates active regulatory elements from human chromatin. Genome Res 17: 877–885. [DOI] [PMC free article] [PubMed] [Google Scholar]
- Goldberg AD, Banaszynski LA, Noh KM, Lewis PW, Elsaesser SJ, Stadler S, Dewell S, Law M, Guo X, Li X, et al. 2010. Distinct factors control histone variant H3.3 localization at specific genomic regions. Cell 140: 678–691. [DOI] [PMC free article] [PubMed] [Google Scholar]
- Harada A, Okada S, Konno D, Odawara J, Yoshimi T, Yoshimura S, Kumamaru H, Saiwai H, Tsubota T, Kurumizaka H, et al. 2012. Chd2 interacts with H3.3 to determine myogenic cell fate. EMBO J 31: 2994–3007. [DOI] [PMC free article] [PubMed] [Google Scholar]
- Hayashi MT, Karlseder J. 2013. DNA damage associated with mitosis and cytokinesis failure. Oncogene 32: 4593–4601. [DOI] [PMC free article] [PubMed] [Google Scholar]
- Hayashi S, McMahon AP. 2002. Efficient recombination in diverse tissues by a tamoxifen-inducible form of Cre: a tool for temporally regulated gene activation/inactivation in the mouse. Dev Biol 244: 305–318. [DOI] [PubMed] [Google Scholar]
- Hayashi S, Lewis P, Pevny L, McMahon AP. 2002. Efficient gene modulation in mouse epiblast using a Sox2Cre transgenic mouse strain. Mech Dev 119: S97–S101. [DOI] [PubMed] [Google Scholar]
- Heaphy C, de Wilde R, Jiao Y, Klein A, Edil B, Shi C, Bettegowda C, Rodriguez F, Eberhart C, Hebbar S, et al. 2011. Altered telomeres in tumors with ATRX and DAXX mutations. Science 333: 425. [DOI] [PMC free article] [PubMed] [Google Scholar]
- Herrmann BG. 1991. Expression pattern of the Brachyury gene in whole-mount TWis/TWis mutant embryos. Development 113: 913–917. [DOI] [PubMed] [Google Scholar]
- Hikisz P, Kilianska ZM. 2012. PUMA, a critical mediator of cell death—one decade on from its discovery. Cell Mol Biol Lett 17: 646–669. [DOI] [PMC free article] [PubMed] [Google Scholar]
- Hodl M, Basler K. 2009. Transcription in the absence of histone H3.3. Curr Biol 19: 1221–1226. [DOI] [PubMed] [Google Scholar]
- Hodl M, Basler K. 2012. Transcription in the absence of histone H3.2 and H3K4 methylation. Curr Biol 22: 2253–2257. [DOI] [PubMed] [Google Scholar]
- Inoue A, Zhang Y. 2014. Nucleosome assembly is required for nuclear pore complex assembly in mouse zygotes. Nat Struct Mol Biol 21: 609–616. [DOI] [PMC free article] [PubMed] [Google Scholar]
- Jackson AL, Linsley PS. 2010. Recognizing and avoiding siRNA off-target effects for target identification and therapeutic application. Nat Rev Drug Discov 9: 57–67. [DOI] [PubMed] [Google Scholar]
- Jacobs JJ, de Lange T. 2004. Significant role for p16INK4a in p53-independent telomere-directed senescence. Curr Biol 14: 2302–2308. [DOI] [PubMed] [Google Scholar]
- Jin C, Felsenfeld G. 2007. Nucleosome stability mediated by histone variants H3.3 and H2A.Z. Genes Dev 21: 1519–1529. [DOI] [PMC free article] [PubMed] [Google Scholar]
- Jin C, Zang C, Wei G, Cui K, Peng W, Zhao K, Felsenfeld G. 2009. H3.3/H2A.Z double variant-containing nucleosomes mark ‘nucleosome-free regions’ of active promoters and other regulatory regions. Nat Genet 41: 941–945. [DOI] [PMC free article] [PubMed] [Google Scholar]
- Jones B, Su H, Bhat A, Lei H, Bajko J, Hevi S, Baltus GA, Kadam S, Zhai H, Valdez R, et al. 2008. The histone H3K79 methyltransferase Dot1L is essential for mammalian development and heterochromatin structure. PLoS Genet 4: e1000190. [DOI] [PMC free article] [PubMed] [Google Scholar]
- Jonkers J, Meuwissen R, van der Gulden H, Peterse H, van der Valk M, Berns A. 2001. Synergistic tumor suppressor activity of BRCA2 and p53 in a conditional mouse model for breast cancer. Nat Genet 29: 418–425. [DOI] [PubMed] [Google Scholar]
- Jullien J, Astrand C, Szenker E, Garrett N, Almouzni G, Gurdon JB. 2012. HIRA dependent H3.3 deposition is required for transcriptional reprogramming following nuclear transfer to Xenopus oocytes. Epigenetics Chromatin 5: 17. [DOI] [PMC free article] [PubMed] [Google Scholar]
- Kim WY, Sharpless NE. 2006. The regulation of INK4/ARF in cancer and aging. Cell 127: 265–275. [DOI] [PubMed] [Google Scholar]
- Kok FO, Shin M, Ni CW, Gupta A, Grosse AS, van Impel A, Kirchmaier BC, Peterson-Maduro J, Kourkoulis G, Male I, et al. 2015. Reverse genetic screening reveals poor correlation between morpholino-induced and mutant phenotypes in zebrafish. Dev Cell 32: 97–108. [DOI] [PMC free article] [PubMed] [Google Scholar]
- Konev AY, Tribus M, Park SY, Podhraski V, Lim CY, Emelyanov AV, Vershilova E, Pirrotta V, Kadonaga JT, Lusser A, et al. 2007. CHD1 motor protein is required for deposition of histone variant H3.3 into chromatin in vivo. Science 317: 1087–1090. [DOI] [PMC free article] [PubMed] [Google Scholar]
- Kouskouti A, Talianidis I. 2005. Histone modifications defining active genes persist after transcriptional and mitotic inactivation. EMBO J 24: 347–357. [DOI] [PMC free article] [PubMed] [Google Scholar]
- Lange UC, Siebert S, Wossidlo M, Weiss T, Ziegler-Birling C, Walter J, Torres-Padilla ME, Daujat S, Schneider R. 2013. Dissecting the role of H3K64me3 in mouse pericentromeric heterochromatin. Nat Commun 4: 2233. [DOI] [PubMed] [Google Scholar]
- Langmead B, Salzberg SL. 2012. Fast gapped-read alignment with Bowtie 2. Nat Methods 9: 357–359. [DOI] [PMC free article] [PubMed] [Google Scholar]
- Law MJ, Lower KM, Voon HP, Hughes JR, Garrick D, Viprakasit V, Mitson M, De Gobbi M, Marra M, Morris A, et al. 2010. ATR-X syndrome protein targets tandem repeats and influences allele-specific expression in a size-dependent manner. Cell 143: 367–378. [DOI] [PubMed] [Google Scholar]
- Lewis PW, Elsaesser SJ, Noh KM, Stadler SC, Allis CD. 2010. Daxx is an H3.3-specific histone chaperone and cooperates with ATRX in replication-independent chromatin assembly at telomeres. Proc Natl Acad Sci 107: 14075–14080. [DOI] [PMC free article] [PubMed] [Google Scholar]
- Lim CY, Reversade B, Knowles BB, Solter D. 2013. Optimal histone H3 to linker histone H1 chromatin ratio is vital for mesodermal competence in Xenopus. Development 140: 853–860. [DOI] [PubMed] [Google Scholar]
- Lin CJ, Conti M, Ramalho-Santos M. 2013. Histone variant H3.3 maintains a decondensed chromatin state essential for mouse preimplantation development. Development 140: 3624–3634. [DOI] [PMC free article] [PubMed] [Google Scholar]
- Lin CJ, Koh FM, Wong P, Conti M, Ramalho-Santos M. 2014. Hira-mediated h3.3 incorporation is required for DNA replication and ribosomal RNA transcription in the mouse zygote. Dev Cell 30: 268–279. [DOI] [PMC free article] [PubMed] [Google Scholar]
- Lovejoy CA, Li W, Reisenweber S, Thongthip S, Bruno J, de Lange T, De S, Petrini JH, Sung PA, Jasin M, et al. 2012. Loss of ATRX, genome instability, and an altered DNA damage response are hallmarks of the alternative lengthening of telomeres pathway. PLoS Genet 8: e1002772. [DOI] [PMC free article] [PubMed] [Google Scholar]
- Loyola A, Almouzni G. 2007. Marking histone H3 variants: how, when and why? Trends Biochem Sci 32: 425–458. [DOI] [PubMed] [Google Scholar]
- McKittrick E, Gafken PR, Ahmad K, Henikoff S. 2004. Histone H3.3 is enriched in covalent modifications associated with active chromatin. Proc Natl Acad Sci 101: 1525–1530. [DOI] [PMC free article] [PubMed] [Google Scholar]
- Meng A, Wang Y, Van Zant G, Zhou D. 2003. Ionizing radiation and busulfan induce premature senescence in murine bone marrow hematopoietic cells. Cancer Res 63: 5414–5419. [PubMed] [Google Scholar]
- Nagy A. 2003. Manipulating the mouse embryo: a laboratory manual. Cold Spring Harbor Laboratory Press, Cold Spring Harbor, NY. [Google Scholar]
- Ng RK, Gurdon JB. 2008. Epigenetic memory of an active gene state depends on histone H3.3 incorporation into chromatin in the absence of transcription. Nat Cell Biol 10: 102–109. [DOI] [PubMed] [Google Scholar]
- O'Sullivan RJ, Arnoult N, Lackner DH, Oganesian L, Haggblom C, Corpet A, Almouzni G, Karlseder J. 2014. Rapid induction of alternative lengthening of telomeres by depletion of the histone chaperone ASF1. Nat Struct Mol Biol 21: 167–174. [DOI] [PMC free article] [PubMed] [Google Scholar]
- Pampalona J, Frias C, Genesca A, Tusell L. 2012. Progressive telomere dysfunction causes cytokinesis failure and leads to the accumulation of polyploid cells. PLoS Genet 8: e1002679. [DOI] [PMC free article] [PubMed] [Google Scholar]
- Quinlan AR, Hall IM. 2010. BEDTools: a flexible suite of utilities for comparing genomic features. Bioinformatics 26: 841–842. [DOI] [PMC free article] [PubMed] [Google Scholar]
- Raymond CS, Soriano P. 2007. High-efficiency FLP and φC31 site-specific recombination in mammalian cells. PLoS One 2: e162. [DOI] [PMC free article] [PubMed] [Google Scholar]
- Ritchie K, Seah C, Moulin J, Isaac C, Dick F, Berube NG. 2008. Loss of ATRX leads to chromosome cohesion and congression defects. J Cell Biol 180: 315–324. [DOI] [PMC free article] [PubMed] [Google Scholar]
- Robinson MD, McCarthy DJ, Smyth GK. 2010. edgeR: a Bioconductor package for differential expression analysis of digital gene expression data. Bioinformatics 26: 139–140. [DOI] [PMC free article] [PubMed] [Google Scholar]
- Rogakou EP, Pilch DR, Orr AH, Ivanova VS, Bonner WM. 1998. DNA double-stranded breaks induce histone H2AX phosphorylation on serine 139. J Biol Chem 273: 5858–5868. [DOI] [PubMed] [Google Scholar]
- Sakai A, Schwartz B, Goldstein S, Ahmad K. 2009. Transcriptional and developmental functions of the H3.3 histone variant in Drosophila. Curr Biol 19: 1816–1836. [DOI] [PMC free article] [PubMed] [Google Scholar]
- Schmidt D, Wilson MD, Spyrou C, Brown GD, Hadfield J, Odom DT. 2009. ChIP-seq: using high-throughput sequencing to discover protein–DNA interactions. Methods 48: 240–248. [DOI] [PMC free article] [PubMed] [Google Scholar]
- Schwartzentruber J, Korshunov A, Liu XY, Jones DT, Pfaff E, Jacob K, Sturm D, Fontebasso AM, Quang DA, Tonjes M, et al. 2012. Driver mutations in histone H3.3 and chromatin remodelling genes in paediatric glioblastoma. Nature 482: 226–231. [DOI] [PubMed] [Google Scholar]
- Seah C, Levy MA, Jiang Y, Mokhtarzada S, Higgs DR, Gibbons RJ, Berube NG. 2008. Neuronal death resulting from targeted disruption of the Snf2 protein ATRX is mediated by p53. J Neurosci 28: 12570–12580. [DOI] [PMC free article] [PubMed] [Google Scholar]
- Seki Y, Hayashi K, Itoh K, Mizugaki M, Saitou M, Matsui Y. 2005. Extensive and orderly reprogramming of genome-wide chromatin modifications associated with specification and early development of germ cells in mice. Dev Biol 278: 440–458. [DOI] [PubMed] [Google Scholar]
- Shechter D, Dormann HL, Allis CD, Hake SB. 2007. Extraction, purification and analysis of histones. Nat Protoc 2: 1445–1457. [DOI] [PubMed] [Google Scholar]
- Sherr CJ, Bertwistle D, DEN Besten W, Kuo ML, Sugimoto M, Tago K, Williams RT, Zindy F, Roussel MF. 2005. p53-Dependent and -independent functions of the Arf tumor suppressor. Cold Spring Harb Symp Quant Biol 70: 129–137. [DOI] [PubMed] [Google Scholar]
- Simon JM, Giresi PG, Davis IJ, Lieb JD. 2013. A detailed protocol for formaldehyde-assisted isolation of regulatory elements (FAIRE). Curr Protoc Mol Biol 102: 21.26.1–21.26.15. [DOI] [PubMed] [Google Scholar]
- Skarnes WC. 2000. Gene trapping methods for the identification and functional analysis of cell surface proteins in mice. Methods Enzymol 328: 592–615. [DOI] [PubMed] [Google Scholar]
- Smith S, Stillman B. 1989. Purification and characterization of CAF-I, a human cell factor required for chromatin assembly during DNA replication in vitro. Cell 58: 15–25. [DOI] [PubMed] [Google Scholar]
- Stott FJ, Bates S, James MC, McConnell BB, Starborg M, Brookes S, Palmero I, Ryan K, Hara E, Vousden KH, et al. 1998. The alternative product from the human CDKN2A locus, p14(ARF), participates in a regulatory feedback loop with p53 and MDM2. EMBO J 17: 5001–5014. [DOI] [PMC free article] [PubMed] [Google Scholar]
- Sullivan BA, Karpen GH. 2004. Centromeric chromatin exhibits a histone modification pattern that is distinct from both euchromatin and heterochromatin. Nat Struct Mol Biol 11: 1076–1083. [DOI] [PMC free article] [PubMed] [Google Scholar]
- Szenker E, Ray-Gallet D, Almouzni G. 2011. The double face of the histone variant H3.3. Cell Res 21: 421–434. [DOI] [PMC free article] [PubMed] [Google Scholar]
- Szenker E, Lacoste N, Almouzni G. 2012. A developmental requirement for HIRA-dependent H3.3 deposition revealed at gastrulation in Xenopus. Cell Rep 1: 730–740. [DOI] [PubMed] [Google Scholar]
- Tagami H, Ray-Gallet D, Almouzni G, Nakatani Y. 2004. Histone H3.1 and H3.3 complexes mediate nucleosome assembly pathways dependent or independent of DNA synthesis. Cell 116: 51–61. [DOI] [PubMed] [Google Scholar]
- Tang MC, Jacobs SA, Wong LH, Mann JR. 2013. Conditional allelic replacement applied to genes encoding the histone variant H3.3 in the mouse. Genesis 51: 142–146. [DOI] [PubMed] [Google Scholar]
- Tang MC, Jacobs SA, Mattiske DM, Soh YM, Graham AN, Tran A, Lim SL, Hudson DF, Kalitsis P, O'Bryan MK, et al. 2015. Contribution of the two genes encoding histone variant H3.3 to viability and fertility in mice. PLoS Genet 11: e1004964. [DOI] [PMC free article] [PubMed] [Google Scholar]
- Terradas M, Martin M, Tusell L, Genesca A. 2010. Genetic activities in micronuclei: is the DNA entrapped in micronuclei lost for the cell? Mutat Res 705: 60–67. [DOI] [PubMed] [Google Scholar]
- Trapnell C, Pachter L, Salzberg SL. 2009. TopHat: discovering splice junctions with RNA-seq. Bioinformatics 25: 1105–1111. [DOI] [PMC free article] [PubMed] [Google Scholar]
- Verreault A, Kaufman PD, Kobayashi R, Stillman B. 1996. Nucleosome assembly by a complex of CAF-1 and acetylated histones H3/H4. Cell 87: 95–104. [DOI] [PubMed] [Google Scholar]
- Warfel NA, El-Deiry WS. 2013. p21WAF1 and tumourigenesis: 20 years after. Curr Opin Oncol 25: 52–58. [DOI] [PubMed] [Google Scholar]
- Waterborg JH. 2012. Evolution of histone H3: emergence of variants and conservation of post-translational modification sites. Biochem Cell Biol 90: 79–95. [DOI] [PubMed] [Google Scholar]
- Watson LA, Solomon LA, Li JR, Jiang Y, Edwards M, Shin-ya K, Beier F, Berube NG. 2013. Atrx deficiency induces telomere dysfunction, endocrine defects, and reduced life span. J Clin Invest 123: 2049–2063. [DOI] [PMC free article] [PubMed] [Google Scholar]
- Wen D, Banaszynski LA, Liu Y, Geng F, Noh KM, Xiang J, Elemento O, Rosenwaks Z, Allis CD, Rafii S. 2014. Histone variant H3.3 is an essential maternal factor for oocyte reprogramming. Proc Natl Acad Sci 111: 7325–7330. [DOI] [PMC free article] [PubMed] [Google Scholar]
- Whitfield ML, Zheng LX, Baldwin A, Ohta T, Hurt MM, Marzluff WF. 2000. Stem-loop binding protein, the protein that binds the 3′ end of histone mRNA, is cell cycle regulated by both translational and posttranslational mechanisms. Mol Cell Biol 20: 4188–4198. [DOI] [PMC free article] [PubMed] [Google Scholar]
- Williams ES, Cornforth MN, Goodwin EH, Bailey SM. 2011. CO-FISH, COD-FISH, ReD-FISH, SKY-FISH. Methods Mol Biol 735: 113–124. [DOI] [PubMed] [Google Scholar]
- Wirbelauer C, Bell O, Schubeler D. 2005. Variant histone H3.3 is deposited at sites of nucleosomal displacement throughout transcribed genes while active histone modifications show a promoter-proximal bias. Genes Dev 19: 1761–1766. [DOI] [PMC free article] [PubMed] [Google Scholar]
- Yuen BT, Bush KM, Barrilleaux BL, Cotterman R, Knoepfler PS. 2014. Histone H3.3 regulates dynamic chromatin states during spermatogenesis. Development 141: 3483–3494. [DOI] [PMC free article] [PubMed] [Google Scholar]
Associated Data
This section collects any data citations, data availability statements, or supplementary materials included in this article.