

Abstract
Objectives
Discrimination has been associated with adverse psychological and physical health outcomes, but few studies have examined the effects of discrimination on Hispanic adolescents. This study assessed the relation of perceived discrimination with depressive symptoms and drug use. Covariates included immigrant generation status (GS). A second objective was to examine the potentially moderating effect of neighborhoods’ ethnic composition as suggested by Mair et al.
Design
Secondary data analyses of a longitudinal survey examined self-reports of Hispanic adolescents in 9th grade (the first year of high school) and 11th grade at seven high schools in Los Angeles.
Results
(1) Perceiving discrimination in 9th grade significantly predicted depressive symptoms (β = 0.23, p<0.01) and drug use (β = 0.12, p<0.01) in 11th grade, even after controlling for socioeconomic status, gender, acculturation, and GS in the USA. The third GS group reported significantly higher perceptions of discrimination compared to newer immigrants. (2) Neighborhoods’ ethnic composition was included as a moderator of the association between perceived discrimination and the outcomes, but did not moderate the relation.
Conclusion
Teaching Hispanic adolescents effective strategies for coping with discrimination, such as increasing their sense of belongingness in the American mainstream, may prove useful in preventing drug use and depressive symptoms.
Keywords: discrimination, Hispanic Americans, depression, substance use, neighborhoods, acculturation
Introduction
Ethnic disparities in health-related behaviors are a concern to policy-makers, academics, and society at large. Compared with Caucasians and African-Americans, Hispanics in the United States report engaging in drug use at earlier ages (Johnston et al. 2011) and have a higher prevalence of use of cocaine, methamphetamines, ecstasy, and inhalants (Centers for Disease Control and Prevention 2010). Among adults in the USA, Hispanics are more likely than nonHispanic Whites to report major depressive symptoms (Gonzalez and Berry 2010). There is also evidence that Hispanic adolescents are at an elevated risk for depression compared with nine other ethnic groups in the USA (Roberts et al. 1997); therefore, it is urgent to address this health disparity.
Previous research
According to the bio-psychosocial model and psychosocial stress theory (Clark et al. 1999, Dressler et al. 2005), stressful life experiences can cause negative emotional and biological reactions that affect mental and physical health. Discrimination, ‘a negative action towards a social group or its members on account of group membership’ (Jones 2002, p. 8), can be viewed as a potentially stressful experience and ‘unique environmental stressor for minority youth’ (DeGarmo and Martinez 2006, p. 277). Flores et al. (2010) identify discrimination as potentially traumatic for adolescents because it is ‘an assault’ on the developing sense of self. A growing body of evidence indicates perceptions of discrimination increase the likelihood of depression and risky behaviors (Kulis et al. 2009, Chartier and Caetano 2010). In ethnic minorities, perceiving discrimination is also associated with increased anxiety, decreased self-esteem, and increased depression (Umaña-Taylor and Updegraff 2007, Alamilla et al. 2010, Flores et al. 2010), higher alcohol use (Tran et al. 2010), and decreased overall physical health in Hispanic adults (Finch 2001). The underlying mechanism by which perceived discrimination leads to risky behaviors seems to be that those who perceive chronic social exclusion feel emotional distress and may use drugs to reduce their ‘social pain’ (MacDonald and Jensen-Campbell 2011).
The present study used data from a panel of Hispanic adolescents attending high school in California to investigate whether levels of perceived discrimination predicted depressive symptoms and substance use, and whether the ethnic composition of neighborhoods moderated the relationship between discrimination and risk. Jessor (1991) indicated that the health outcomes of adolescents were predicted by protective and risk factors such as biological/genetics, social/environmental, perceived environmental, personality, and behavioral determinants. Perceiving discrimination could be included as an environmental risk factor in his model.
Potentially confounding factors: socioeconomic status, acculturation, gender, and generation status
Socioeconomic status (SES) is controlled in the study because its role in perception of discrimination among ethnic minorities is inconclusive. For example, D’Anna et al. (2010) suggest that the effects of discrimination are attenuated for people of higher SES, but Clark et al. (1999) found no association between income and perceptions of discrimination. Kaiser and Major (2006) argue that people err on the side of being unaware of discrimination because awareness entails psychological costs of admitting a loss of personal control. They found people of high status more likely to admit perceiving discrimination because the psychological toll is more damaging for groups of low status. However, among Hispanics, Cardarelli et al. (2007) did not find differences in perceived discrimination when comparing high- and low-income respondents.
Issues related to acculturation also may play a role in the relationship between discrimination and risk behaviors. Moradi and Risco (2006) found that both a highly Latino acculturation strategy and a highly Anglo-acculturation strategy were protective against adverse effects of discrimination for Latinos, because both were related to a higher sense of personal control. However, Kulis et al. (2009) found that acculturation stress was more predictive of marijuana use among Spanish-dominant than among English-dominant students. Consistent with that result, Unger et al. (2009a) found that discrimination and acculturative stress predicted substance use only among those whose identification with a Hispanic culture was central to their self-concepts. Because acculturation is associated with drug use and perceived discrimination it will be controlled in the present study.
Overall, females report significantly more depression than males (Roberts et al. 1997). Gender differences in depression begin to be observed in early adolescence (Kessler et al. 1993). Data from the National Survey of Parents and Youth identify a gender disparity among Hispanic adolescents in the USA, whereby boys engage in more use of marijuana, tobacco, alcohol, and inhalants than girls (Basáñez and Lac 2010). A gender disparity in drug use was also reported in Amaro and Cortés (2003). To avoid the confounding effect of gender on risk behaviors, this factor will be controlled in the present study. Generation status (GS) will be controlled too since it may explain behavioral differences, and because we aim to assess the Sears and Savalei (2006) hypotheses that with more generations since immigration Hispanics increasingly assimilate to the USA.
Can neighborhood composition moderate perceived discrimination?
Perceiving discrimination involves feelings of social exclusion (MacDonald and Jensen-Campbell 2011). The rationale for examining neighborhoods’ ethnic composition as a moderator of the association between perceived discrimination, depression, and drug use is based on the assumption that neighborhoods with higher percentages of Hispanics could promote a sense of ‘belongingness’ that buffers the effects of perceived discrimination. Experiments manipulating ostracism find that after episodes of exclusion, subjects change their behaviors to restore their sense of group belongingness (Williams et al. 2000; Pickett and Brewer 2005). Although perpetrators of discrimination can come from inside or outside the group, this study is based on the assumption that perpetrators were nonHispanics, and that living in neighborhoods with a higher percentage of Hispanics should relate to perception of less discrimination owing to fewer opportunities to experience discrimination.
Mair et al. (2010) describe two competing hypotheses regarding the association of neighborhoods’ racial/ethnic composition and depressive symptoms: the residential segregation hypothesis holds that poorer access to resources due to residential segregation causes people to be depressed. The concentration of disadvantaged groups results in fewer available economic opportunities, and such areas’ physical characteristics also tend to be disadvantaged (Mair et al. 2010). Simons and Burt (2011) concur with this prognosis and find that neighborhoods tend to create knowledge structures capable of legitimizing delinquent behavior. Conversely, the ethnic density hypothesis argues that greater levels of social support and social cohesion in ethnically homogeneous neighborhoods may lessen inhabitants’ depression. Social capital is also credited as accounting for well-being and is estimated to be more available in more ethnically homogenous neighborhoods (Putnam 2007). According to this view, summarized by Pickett and Wilkinson (2008), living around dissimilar others makes members of low status groups more aware of their stigmatized identity, which renders them more prone to illness. Analyzing data from 1506 African-American adults living in 6 US cities led Mair et al. (2010) to conclude that the residential segregation hypothesis was an adequate explanation for the increased depression in African-American men who lived in neighborhoods with high concentrations of African-Americans. However, data from the same survey, which included 1179 Latino adults, led Mair et al. (2010) to conclude the opposite for Hispanics: the ethnic density hypothesis was a more adequate explanation for the effect of neighborhood composition in decreased depression for male and female Hispanic adults. Few studies have replicated the unexpected trend found among Hispanics and few have examined the ethnic density hypothesis among adolescents, so the study of neighborhood data may prove valuable.
Research questions and hypotheses
In the USA, 9th grade refers to the ninth year of school postkindergarten. It is the first year of high school. In 9th grade students are typically 14–15 years of age. Eleventh grade is the third year of high school, students typically are 16–17 years old. The research questions and related hypotheses in the present study are: (1) does perceived discrimination in 9th grade predict drug use and depression in 11th grade, after controlling for gender, SES, GS, and acculturation? Consistent with Moradi and Risco (2006), Flores et al. (2010), and Tran et al. (2010), we hypothesize that perceiving discrimination in 9th grade will be related to higher levels of drug use and depression in 11th grade. (2) Does neighborhood composition moderate the effect of perceived discrimination in 9th grade on drug use and depression in 11th grade? Mair et al. (2010) suggest that neighborhoods with higher concentrations of Hispanics will have less drug use and less depression. The expected interaction is that perceived discrimination will be less strongly associated with risk behaviors among those who live in neighborhoods with a higher (vs. lower) percentage of Hispanics (Figure 1).
Figure 1.
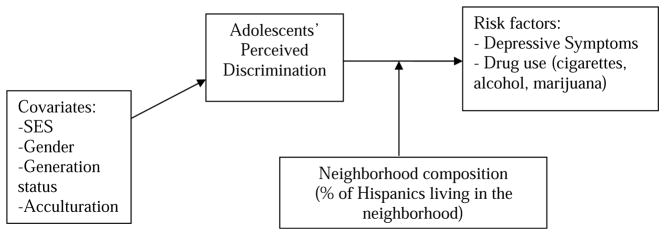
Moderation model tested: perceived discrimination predicting risk factors in Hispanic adolescents
Exploratory question
A secondary goal of the study was to explore the claim that only new Latino immigrants have difficulty assimilating to US mainstream society (Sears and Savalei 2006). To the extent that Sears’s assimilation theory is correct, Latinos from later generations since immigration should perceive less discrimination.
Method
The study is a secondary data analysis of responses of high school students who participated in Reteniendo y Entendiendo la Diversidad (RED), a longitudinal panel study of acculturation patterns and substance use among Latino adolescents attending high school in Southern California (Unger et al. 2009b). To recruit participants, a list of high schools in Los Angeles County with a population of at least 70% Hispanic students was compiled. The schools were ranked by SES using the proportion of students receiving free lunch as indicator. Two lists were produced, one of the schools above the median SES and another of schools below the median SES. Schools from each list were randomly ordered and school representatives contacted and invited to participate. After the target sample size of seven schools was reached, which was determined by a power analysis, no additional schools were contacted. Participating schools ranged from 1166 to 4286 students (mean = 1911). The percent Hispanic ranged from 70 to 99% (mean = 89.6%). The 9th, 10th, and 11th grade surveys were conducted in the autumn of 2005, 2006, and 2007, respectively.
In the USA, the system of postal codes (zip codes) consists of five numerical digits that refer to specific streets, irrespective of population size. The median annual household incomes in the zip codes served by participating schools ranged from $29,000 to $73,000. Overall in Los Angeles County, the median household income was $42,189 according to 2000 U.S. Census data (Welniak and Posey 2005).
Only students who reported Hispanic heritage, a gender category, who filled out a survey in 9th grade and 11th grade, and responded to country of birth questions were selected for analysis. Across the seven schools, 2222 students completed the survey in 9th grade. Of those, 1491 (67%) self-identified as Hispanic and provided sufficient information to ascertain their GS. Of those, 1045 (70%) participated in waves 1 and 3, and of those, 961 (92%) provided information on all variables of interest in this analysis. See Unger et al. (2009b) for survey details.
Measures
English and Spanish versions of the survey were available, but only 17 students (0.8%) chose the survey in Spanish.
Predictor variables
Discrimination
Perceived discrimination was computed using a 10-item scale (Guyll et al. 2001) stating that some people feel they are treated differently because of their ethnic or cultural background, asking respondents to specify how often they perceive such treatment. Examples of the items include questions like: ‘You are treated with less respect than other people,’ ‘You or your family members are called names or insulted.’ The scale had good internal reliability (α = 0.86).
Neighborhood composition
Information about percentage of Hispanics living in the respondents’ neighborhood was determined by linking their zip code information to US census 2000 data using Arc GIS software. The continuous variable ranged from 0 to 100%.
Covariates
Socioeconomic status
Socioeconomic status is a composite of the following four items: parent’s highest level of education, number of rooms per person at home, family owns versus rents home, and respondent receives free lunch at school. Parent’s level of education was assessed on a 6-point scale. The third item, free lunch, was reverse coded so that in all four variables lower scores signified lower SES. The alpha level of the composite measure was deemed acceptable (α = 0.50) since there were only three items in the composite and because these three items likely represent different aspects of the complex construct of SES.
Acculturation
The scale developed by Cuéllar et al. (1995) was used to measure Hispanic (α = 0.88) and Anglo (α = 0.77) acculturation. It includes items such as ‘I enjoy speaking Spanish.’ Because Anglo and Hispanic orientation were two separate scores assessed with different questions, respondents potentially could be high on both Anglo and Hispanic acculturation. The measure is on a 5-point scale (1 = Not at all, 5 = Almost always/Extremely often).
Gender
Participants’ sex was measured as a dichotomous variable, (0 = female, 1 = male).
Generation status
Reporting country of birth enabled computing a GS variable of four categories: GS 1 included foreign-born respondents with two foreign-born parents; GS 2 consisted of respondents born in the USA from two foreign-born parents; GS 2.5 consisted of US-born respondents with one foreign-born and one US-born parent; GS 3 referred to respondents born in the USA, from two US-born parents.
Dependent variables
Depression
Depressive symptoms were assessed using the 20-item Center for Epidemiologic Studies Depression Scale (CES-D; Radloff 1977). This instrument uses a 4-point scale; higher scores indicated higher depression (α = 0.89 for both 9th grade and 11th grade data).
Substance use
A composite variable assessing experimental substance use was created using the mean of the following three items: last 30 days use of marijuana, last 30 days use of alcohol, and last 30 days use of tobacco.1 The marijuana item was scored on a 6-point scale and the tobacco and alcohol items on a 7-point scale. Items were standardized before computing the composite score. Standardizing before averaging offsets the bias that would result from averaging variables with different means and variances. The technique of creating a composite substance use variable has been used previously in similar studies (Garrison et al. 1993, Kulis et al. 2012) and avoids the inflated Type 1 error rate that would result from conducting multiple tests using each substance separately. Measures of Drug Use were obtained in both 9th and 11th grade. Low scores indicated low drug use.
Data analysis
Descriptive statistics were examined to determine the need to transform variables with positive kurtosis. Since the Drug Use composite variables had a large positive kurtosis (24.65 in year 1, and 15.77 in year 3) the composites were log transformed after adding a score of one to each composite to avoid negative numbers and zeros. An additional constant of one was added to the drug use variable after log transforming to ensure the final range would include only positive numbers.
Means and standard deviations for the research variables were calculated. Bivariate correlations between the demographic variables and the outcome variables were calculated to determine if it was necessary to control for demographics in the regression analyses. The analyses included only participants with complete data on the nine variables investigated in this analysis. Missing data were dealt with by creating a ‘missingness’ variable for each of the variables included in the present study. Correlations were run to compare if having complete/incomplete data related to the variables in the study. Being a participant with complete data correlated positively with GS (r = .07, p = .02) and with Anglo acculturation (r = .07, p = .03), and negatively with gender (r = −.08, p<.01) indicating that more complete data were provided by female participants. Students who were excluded from the analyses for missing data on baseline had higher scores for depression in 9th grade (mean = 16.3, SD = 11.2) compared to those who were included (mean = 14.3, SD = 10.1; t = 4.29, p<.01). Students excluded for missing data had a higher prevalence of cigarette smoking in 9th grade (9% smoked in past month) compared to those who were included (5% smoked; χ2 = 16.38, p<.01). The excluded respondents also had a higher prevalence of marijuana use in 9th grade (15%) compared to those who were included in the analyses (9%; χ2 = 16.87, p <.01). However, there were no statistically significant differences in alcohol use between those excluded from the analysis (25%) and those who were included (23%, χ2 = 1.59). Based on the significant differences found between completers and drop-outs, it is possible that the findings may not generalize to youth who dropped out of school between 9th and 11th grade.
Previous analyses of this data-set have included multilevel modeling; however, the nesting of students within schools has not changed the results because the intra-class correlations were very low (Unger et al. 2009a, Lorenzo-Blanco et al. 2011). Thus, the main research questions in the present study were analyzed using multiple linear regressions. The covariates (gender, SES, GS, Hispanic acculturation, and Anglo acculturation) were entered in the first step of the linear regression analysis, and perception of discrimination in 9th grade was entered in the next step. Eleventh-grade drug use was entered as the dependent variable. In a second regression analysis the procedure was repeated but depression was entered as the dependent variable.
Since participants’ depressive symptoms and drug use were measured also in 9th grade it was possible to assess whether perception of discrimination was associated with change in depression or drug use between 9th and 11th grade, rather than with overall levels of depression or drug use in 11th grade. Thus, additional linear regression analyses were conducted: when predicting 11th grade drug use we controlled for 9th grade depression, and when predicting 11th grade depression we controlled for 9th grade drug use.
To analyze research question 2 (i.e., the moderation analyses), the perceived discrimination variable and neighborhood composition were centered and multiplied together to create an interaction term. Regression analyses were performed controlling for the covariates to assess each of the following questions: (2a) the interaction of perceived discrimination in 9th grade and neighborhood composition on drug use in 11th grade, (2b) the interaction of perceived discrimination in 9th grade and neighborhood composition on depression in 11th grade.
The exploratory question examined a secondary goal of the study, analyzing perceived discrimination by GS comparing 9th grade and 11th grade. To ascertain if those with a higher SES and GS perceived less discrimination, a linear regression analysis was run controlling for gender and acculturation strategy, entering SES and GS in the second step of the regression analysis and perceived discrimination as the dependent variable. A separate linear regression was also performed using the four GS group categories as predictors and discrimination in 9th grade as the dependent variable.
Results
Participants
The analytical sample included a total of 1045 Latino adolescents (567 females, and 478 males; 86% with ancestors from Mexico; 27% with ancestors from the USA; 16% with ancestors from El Salvador or Guatemala). Most of the respondents were born in the USA from foreign-born parents (US-born = 89%, foreign born = 11%; GS 1 = 118, GS 2 = 683, GS 2.5 = 111, GS 3 = 133).
Means and standard deviations for all variables are presented in Table 1.
Table 1.
Means and standard deviations of research variables.
| Depression (1–4; 1 = low)
|
Drug use (min = 0.45, max = 2.99)
|
Perceived discrimination (1–4; 1 = low)
|
||||||
|---|---|---|---|---|---|---|---|---|
| Mean | SD | Mean | SD | Mean | SD | |||
| Gender | ||||||||
| 9th grade | 46% | M | 1.62 | 0.44 | 0.85 | 0.42 | 1.83 | 0.56 |
| 54% | F | 1.83 | 0.48 | 0.84 | 0.41 | 1.6 | 0.51 | |
| 11th grade | 46% | M | 1.64 | 0.47 | 0.87 | 0.56 | 1.63** | 0.63 |
| 54% | F | 1.84 | 0.54 | 0.75 | 0.44 | 1.49** | 0.51 | |
| SES | ||||||||
| 9th grade | 56% | LM | 1.72 | 0.5 | 0.83 | 0.4 | 1.72 | 0.56 |
| 44% | HM | 1.74 | 0.54 | 0.86 | 0.49 | 1.69 | 0.54 | |
| 11th grade | 56% | LM | 1.77 | 0.53 | 0.79 | 0.43 | 1.58 | 0.58 |
| 44% | HM | 1.73 | 0.51 | 0.82 | 0.51 | 1.53 | 0.56 | |
| Generation status | ||||||||
| 9th grade | 77% | N | 1.69 | 0.48 | 0.83 | 0.39 | 1.68 | 0.54 |
| 23% | O | 1.82 | 0.59 | 0.89 | 0.47 | 1.75 | 0.55 | |
| 11th grade | 77% | N | 1.76* | 0.51 | 0.78 | 0.49 | 1.55** | 0.59 |
| 23% | O | 1.73* | 0.57 | 0.88 | 0.52 | 1.55** | 0.51 | |
| Anglo acculturation | ||||||||
| 9th grade | 49% | L | 1.75 | 0.51 | 0.87a | 0.44 | 1.77 | 0.58 |
| 51% | H | 1.71 | 0.53 | 0.82a | 0.38 | 1.64 | 0.51 | |
| 11th grade | 45% | L | 1.78 | 0.52 | 0.80a | 0.51 | 1.6 | 0.58 |
| 55% | H | 1.73 | 0.53 | 0.81a | 0.49 | 1.51 | 0.56 | |
| Hispanic acculturation | ||||||||
| 9th grade | 60% | L | 1.74 | 0.52 | 0.86 | 0.43 | 1.73 | 0.56 |
| 40% | H | 1.73 | 0.51 | 0.82 | 0.39 | 1.66 | 0.53 | |
| 11th grade | 47% | L | 1.76 | 0.54 | 0.85 | 0.53 | 1.53 | 0.54 |
| 53% | H | 1.74 | 0.51 | 0.76 | 0.45 | 1.57 | 0.6 | |
M, male; F, female; LM, socioeconomic status lower than the mean; HM, socioeconomic status higher than the mean; N, immigrant generation status 1 or 2 (new to USA); O, immigrant generation status 2.5 or 3 (old to USA); L, low level; H, high level.
Cross-sectional drug use is reported on a log scale; those who had a high Anglo acculturation style in 9th grade reported significantly more drug use in 11th grade (mean = 0.84, SD = 0.53) than those who had a low Anglo acculturation style in 9th grade (mean = 0.77, SD = 0.47), F = 4.98, p<0.05, Cohen’s d = 1.4
p<0.05,
p<0.01 (i.e., a significant difference compared to same category in 9th grade).
Results for research question 1
Effect of perceived discrimination in 9th grade on drug use in 11th grade
The linear regression analysis indicates a statistically significant main effect of perceiving discrimination in 9th grade on drug use in 11th grade (β = 0.10, p<0.01). Whether this proportion of the variance is clinically meaningful is open to debate. Of the covariates, only gender was significantly related to drug use (β = 0.10, p<0.01) (Table 2).
Table 2.
Multiple linear regression model predicting drug use in 11th grade using perceived discrimination in 9th grade (N = 1034).
| Step | Variable | Model predicting drug use
|
||
|---|---|---|---|---|
| ΔR2a | βb | pc | ||
| 1d | 0.023 | 0.00 | ||
| SES | −0.02 | 0.55 | ||
| Gender | 0.12 | 0.00 | ||
| Anglo acculturation | −0.04 | 0.27 | ||
| Hispanic acculturation | −0.05 | 0.16 | ||
| Generation status | 0.07 | 0.08 | ||
| 2e | 0.01 | 0.00 | ||
| SES | −0.02 | 0.52 | ||
| Gender | 0.10 | 0.00 | ||
| Anglo acculturation | −0.03 | 0.44 | ||
| Hispanic acculturation | −0.04 | 0.20 | ||
| Generation status | 0.05 | 0.11 | ||
| Perceived discrimination | 0.11 | 0.00 | ||
| Total R2f | 0.035 | 0.00 | ||
Note: Gender is coded 1 = female, 2 = male; Drug use reported is on a log scale.
Change or increase in the R squared that is associated with the variable added to the model.
Beta coefficient.
Significance level p values associated with the t-test.
Model with covariates only, without accounting for discrimination.
Model accounting for discrimination.
Coefficient of determination multiple R squared is the proportion of variance that can be predicted in the dependent variable with this sample using this multiple regression model.
Past drug use
The correlation between past drug use (i.e., drug use measured in 9th grade) and drug use in 11th grade was statistically significant (r = 0.39, p<0.01). When entering past drug use into the regression analysis, the effect of discrimination reduced to a trend toward statistical significance (β = 0.05, p = 0.10). There was a trend toward statistical significance of the interaction between discrimination and past drug use (β = 0.06, p = 0.06), a main effect of past drug use (β = 0.36, p<0.01) but no main effect of discrimination (β = 0.04, p = 0.15). Thus, drug use in 9th grade predicted drug use in 11th grade regardless of 9th grade discrimination.
Role of interaction with covariates on drug use
In exploratory analyses, we added interaction terms representing each covariate multiplied by perceived discrimination.
None of these interaction terms were statistically significant, indicating that the association between perceived discrimination and drug use did not vary across adolescents with differing SES, generation, or acculturation statuses.
Mediating role of depression in drug use
A mediation model was calculated to examine if depression acted as a mediator between discrimination and drug use. Results showing a partial mediation are presented in Figure 2.
Figure 2.
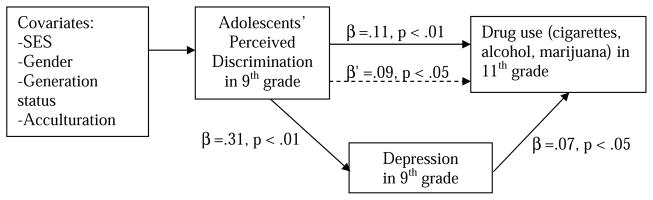
Mediation model showing the role of depression in the path between perceived discrimination and drug use in Hispanic adolescents.
Note: β′ = Coefficient beta once the mediating variable is taken into account. And the dashed line indicates the change in the relationship between perceived discrimination and drug use once the mediating role of depression is entered in the model.
Effect of perceived discrimination in 9th grade on depression in 11th grade
The multiple linear regression model indicated a significant main effect of perceiving discrimination in 9th grade on depression in 11th grade (β = 0.23, p<0.01). The regression model also indicated than gender was significantly related to depression (β = −0.23, p<0.01); females were significantly more depressed than males (Table 3).
Table 3.
Multiple linear regression model predicting depressive symptoms in 11th grade using perceived discrimination in 9th grade (N = 1045)
| Step | Variable | Model predicting depressive symptoms
|
||
|---|---|---|---|---|
| ΔR2a | βb | pc | ||
| 1d | 0.04 | 0.00 | ||
| SES | −0.01 | 0.84 | ||
| Gender | −0.19 | 0.00 | ||
| Anglo acculturation | −0.03 | 0.38 | ||
| Hispanic acculturation | 0.01 | 0.88 | ||
| Generation status | −0.01 | 0.68 | ||
| 2e | 0.05 | 0.00 | ||
| SES | −0.01 | 0.76 | ||
| Gender | −0.23 | 0.00 | ||
| Anglo acculturation | −0.01 | 0.85 | ||
| Hispanic acculturation | 0.01 | 0.65 | ||
| Generation status | −0.03 | 0.41 | ||
| Perceived discrimination | 0.23 | 0.00 | ||
| Total R2f | 0.09 | 0.00 | ||
Change or increase in the R squared that is associated with the variable added to the model
Gender is coded 1 = female, 2 = male;
Beta coefficient
Significance level p values associated with the t-test
Model with covariates only, without accounting for discrimination
Model accounting for discrimination
Coefficient of determination multiple R squared is the proportion of variance that can be predicted in the dependent variable with this sample using this multiple regression model
Past depression
The correlation between past depression (i.e., in 9th grade) and current depression (i.e., in 11th grade) was statistically significant (r = 0.42, p<0.01) so a multiple linear regression model calculating the impact of past depression was assessed to determine its relation to perception of discrimination. The main effect of discrimination remained significant after controlling for past depression (β = 0.10, p<0.01). The interaction between past depression and discrimination on current depression revealed a main effect of past depression (β = 0.38, p<0.01) and a main effect of discrimination (β = 0.10, p<0.01). However, the interaction was not statistically significant (β = −0.04, p = 0.21). Thus, perceiving discrimination in 9th grade has an effect on depression in 11th grade regardless of whether or not adolescents manifested depressive symptoms in 9th grade.
Role of interaction with covariates on depression
Similar to the analyses of drug use reported above, exploratory analyses did not identify any significant interactions between discrimination and SES, GS, or acculturation in the prediction of depression.
Results for research question 2
Neighborhoods’ ethnic composition ranged from 5 to 96%. However, the mean Hispanic population in students’ neighborhoods was 75% and the median was 80%. Splitting the neighborhood composition variable into two groups using the mean as cut-off point showed that perceived discrimination did not vary significantly by neighborhoods’ ethnic composition (mean = 1.706, SD = 0.04 in neighborhoods with a lower concentration of Hispanics and mean = 1.710, SD = 0.02 in more Hispanic neighborhoods). Multiple linear regression analyses tested whether neighborhood composition could moderate the effect of perceived discrimination on drug use and depression, controlling for covariates.
Neighborhood composition and drug use
There was a main effect of perceiving discrimination in 9th grade on drug use in 11th grade (β = 0.12, p<0.01), and a trend toward a statistically significant main effect of neighborhood composition on drug use (β = − 0.06, p = 0.09) suggesting that controlling for the covariates, those living in more Hispanic neighborhoods tended to engage in less drug use than those living in neighborhoods with fewer Hispanics. The interaction of neighborhood and discrimination on drug use was not statistically significant (β = 0.01, p = 0.86) indicating that whether adolescents lived in neighborhoods with high or low concentrations of Hispanics did not attenuate the effect of perceived discrimination on drug use. In conclusion, Hispanic neighborhoods tend to be less prone to drug use, but the neighborhood did not appear to buffer the effect of discrimination on drug use.
Neighborhood composition and depression
There was a significant main effect of perceiving discrimination in 9th grade on depression in 11th grade (β = 0.24, p<0.01), but the main effect of neighborhood composition was not statistically significant (β = 0.01, p = 0.73). There was a trend toward statistical significance of the interaction between discrimination and neighborhood composition on depression (β = − 0.07, p = 0.06). Thus, in comparisons of people who perceive equally high levels of discrimination, those who live in neighborhoods with a higher percentage of Hispanics were less depressed than those who lived in neighborhoods with a lower percentage of Hispanics. A second interpretation could be that comparing people from neighborhoods with an equal proportion of Hispanics, those who perceived more discrimination were more depressed than those who perceived less discrimination.
Results for the exploratory question regarding Hispanics’ assimilation
Controlling for gender and acculturation, the results from a multiple regression analysis indicated that higher SES and higher GS did not predict less discrimination in 11th grade (the coefficients are β = 0.02, p = 0.63 for SES, and β = 0.01, p = 0.76 for GS).2 When examining discrimination in 9th grade as the dependent variable, adolescents of a higher GS group tended to perceive more discrimination compared to those of lower GS groups (β = 0.05, p = 0.09). The separate regression revealed that this difference in perceived discrimination by GS almost reached statistical significance, F(3, 1041) = 2.55, p = 0.05 (Figure 3). In addition, we explored the interaction between SES and GS on perception of discrimination but it was not statistically significant, so the effect of GS on perceived discrimination does not appear to depend on SES.
Figure 3.
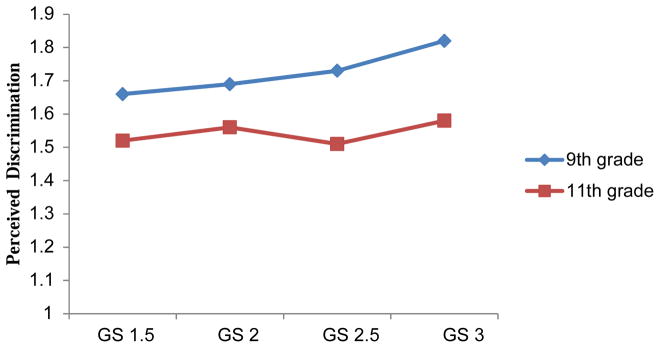
Relationship between perceived discrimination and generation status (GS).
Discussion
This study contributes to the literature on perceived discrimination and health among Hispanic adolescents. Adolescent Hispanic males engaged in significantly more substance use than females, who reported significantly more depressive symptoms than males. Even after controlling for gender, SES, GS, and acculturation, longitudinal data analyses revealed that one factor, perception of discrimination, explained a statistically significant proportion of the variance in depressive symptoms and drug use (alcohol, tobacco, and marijuana) among Hispanic adolescents. Thus, even for adolescents who presumably have not yet been exposed to discrimination in the workplace, lacking a sense of belongingness to the larger mainstream society has pervasive negative effects.
A large number of environment-related risk factors contribute to substance use variation in adolescents (e.g., parental monitoring, peer influence, availability of drugs) and approximately 50% of variance is already accounted for by genetic factors (Uhl et al. 1994). Thus, it is not unreasonable to find that psychological factors, like perceived discrimination, may account for only a small proportion of the variance (R2 = 0.04). The more risk factors that can be identified and addressed in prevention programs, the more relevant and effective the programs can become. Even among the restricted sample selected for analysis (students who did not drop out of high school), we see the effects of discrimination on substance use and depression and we assume the effects would probably be larger in a more diverse sample.
Our study did not find evidence that neighborhood composition consistently moderated the effects of discrimination on depressive symptoms and drug use. This finding is open to several interpretations. The first is that there was not enough variability in the sample because most participants lived in neighborhoods with high concentrations of Hispanics. Another possibility is that adolescents living in Hispanic enclaves perceive similar levels of discrimination regardless of where they live, because their frame of reference is the larger society. The potentially protective effect of Hispanic neighborhoods is neutralized as everyone is exposed to pervasive stereotypic portrayals of Hispanics in the mass media (Gerbner et al. 1994, Weaver 2005). Another explanation for the findings could be that those living in more mixed neighborhoods are still living in places inhabited by other stigmatized minorities who are on an equally low rung of the social ladder. The context of institutional racism (Dressler et al. 2005) may produce a sense of shared reality so discrimination is not perceived differently. Yet another explanation may be that discrimination comes also from within Hispanics’ ethnic group. There are reports that foreign-born Hispanic youth perceive discrimination from US-born Latinos (Córdova and Cervantes 2010) and evidence of implicit prejudice of Hispanics against other Hispanics based on skin color (Uhlmann et al. 2002). Thus, neighborhoods with higher concentrations of Hispanics might not necessarily be expected to provide a ‘discrimination buffer.’ Unprepared to be vigilant of discrimination, Hispanics are probably less aware of their neighborhood’s ethnic composition than African-Americans who are more ready to recognize discrimination as illegitimate and have more ethnic group identity (Lowery et al. 2006).
In conclusion, despite the ample evidence linking neighborhoods and health (Simons and Burt 2011, Krieger et al. 2012), with the present sample we only found trends related to the effect of neighborhoods’ ethnic composition. Nevertheless, our results did support the Mair et al. (2010) findings that led them to endorse an ‘ethnic density hypothesis’ for Hispanics, as there tended to be less depressive symptoms reported in neighborhoods with higher concentrations of Hispanics.
We explored variability in perceptions of discrimination based on GS to assess the claim in Sears and Savalei (2006) that Latinos can easily assimilate into the US mainstream because they are ‘often physically indistinguishable from whites’ (p. 898). Adolescents who were born in the USA and whose parents also were born in the USA did not perceive less discrimination than foreign-born and second generation adolescents, even when controlling for SES. Compared with new immigrants, third generation Hispanics may feel more entitled to equal treatment, and thus are more likely to perceive differences that violate those expectations. Newer immigrants also may report less discrimination because they have not learned to identify others’ behaviors as unfair. They may still be optimistic and unaware because they think their SES will improve the longer they remain in the USA. The finding that adolescents from older generation groups did not report less discrimination suggests that it is important to take phenotype into account when making assumptions about the ability of Hispanics to assimilate and be accepted in the USA.
Limitations
These results are based on adolescents’ self-reports of their substance use, which may have been underreported. However, the respondents were assured their surveys were completely confidential, and previous studies have found adolescents’ self-reports of substance use accurate under confidential survey conditions (Harrison and Hughes 1997). Generalizability of these findings may be limited to those adolescents who were present in school for both surveys and completed all questions. The analysis of missing data indicates that male students who were less acculturated, depressed, and/ or smoked cigarettes or used marijuana in 9th grade were more likely to be lost to attrition and, therefore, were underrepresented in this sample. Future studies should examine these associations in out-of-school youth.
Conclusion
The results suggest that discrimination contributes to adolescents’ substance use and, to a larger extent, to higher depression scores. Culturally relevant community and school-based programs are needed to help Hispanic adolescents become more resilient to discrimination. For example, with regard to educational programs: school curricula need to incorporate more elements about the history of Mexico and about Latinos in the USA to enable Latino adolescents to perceive themselves as core members of the American society. Teachers also need to receive adequate training about phenomena affecting their students such as stereotype threat (Steele 1997). Finally, interventions should address feelings of Americanness although future research is needed to evaluate whether manipulating adolescents’ sense of belongingness to the larger mainstream society reduces risky behaviors. Any and all of these possibilities may reduce depression and illicit substance use in a growing and vulnerable segment of contemporary American society.
Acknowledgments
This research was supported by the National Institute on Drug Abuse (grant # DA016310). The authors thank Dolores AlbarracûÙn, Alan Stacy, Michael Warren, Alicia Mayaute, Melissa Esmero, and David Danneker, for their assistance.
Footnotes
Preliminary analyses showed that discrimination had a similar effect on the use of each drug when analyzing separately. The effect of discrimination was larger for alcohol and marijuana than for tobacco, but there was still a trend for tobacco. To simplify, a composite of these three drugs was created, averaging the respondents’ scores.
After controlling for SES and generation status, being male predicted more perception of discrimination in 9th grade (β = 0.19, p<0.01) as well as in 11th grade (β = 0.12, p<0.01). In 9th grade having an Anglo acculturation style predicted less perception of discrimination (β = −0.10, p<0.01) but in 11th grade having a Hispanic acculturation style predicted less perception of discrimination (β = −0.08, p = 0.01).
References
- Alamilla SG, Kim BSK, Lam AN. Acculturation, enculturation, perceived racism, minority status stressors and psychological symptomatology among Latinos. Hispanic Journal of Behavioral Sciences. 2010;32 (1):55–76. [Google Scholar]
- Amaro H, Cortés DE. Drug abuse among Hispanics: a brief evidence-based guide for providers. U.S. Department for Health and Human Services. Substance Abuse and Mental Health Services Administration Center for Substance Abuse Treatment; 2003. [Accessed 8 April 2012]. Available from: http://store.samhsa.gov/shin/content/SMA07-4288/SMA07-4288.pdf. [Google Scholar]
- Basáñez T, Lac A. Acculturation and risky behaviors among Hispanics: findings from National Survey of Parents and Youth (1999–2002). Poster presented at the 2010 Western Psychological Association Conference; Cancún, Mexico. 2010. [Google Scholar]
- Cardarelli R, Cardarelli K, Chiapa A. Brief report: the modifying effects of education and income on Hispanics reporting perceived discrimination. Hispanic Journal of Behavioral Sciences. 2007;29 (3):401–407. [Google Scholar]
- Centers for Disease Control and Prevention. Youth Risk Behavior Surveillance United States, 2009. [Accessed 3 August 2012];Surveillance Summaries. MMWR. 2010 59(SS-5) Available from: http://www.cdc.gov/mmwr/pdf/ss/ss5905.pdf. [PubMed] [Google Scholar]
- Chartier K, Caetano R. Ethnicity and health disparities in alcohol research. Alcohol Research & Health. 2010;33 (1/2):152–160. [PMC free article] [PubMed] [Google Scholar]
- Clark R, et al. Racism as a stressor for African Americans: a biopsychosocial model. American Psychologist. 1999;54 (10):805–816. doi: 10.1037//0003-066x.54.10.805. [DOI] [PubMed] [Google Scholar]
- Córdova D, Cervantes R. Intergroup and within-group perceived discrimination among U.S.-born and foreign-born Latino youth. Hispanic Journal of Behavioral Sciences. 2010;32 (2):259–274. [Google Scholar]
- Cuéllar I, Arnold B, Maldonado R. Acculturation rating scale for Mexican Americans-II: a revision of the original ARSMA scale. Hispanic Journal of Behavioral Sciences. 1995;17:275–304. [Google Scholar]
- D’Anna LH, Ponce NA, Siegel JM. Racial and ethnic health disparities. Evidence of discrimination effects across the SEP spectrum. Ethnicity and Health. 2010;15 (2):121–143. doi: 10.1080/13557850903490298. [DOI] [PubMed] [Google Scholar]
- DeGarmo DS, Martinez CR., Jr A culturally informed model of academic well-being for Latino youth: the importance of discriminatory experiences and social support. Family Relations. 2006;55:267–278. doi: 10.1111/j.1741-3729.2006.00401.x. [DOI] [PMC free article] [PubMed] [Google Scholar]
- Dressler WW, Oths KS, Gravlee CC. Race and ethnicity in public health research: models to explain health disparities. Annual Review of Anthropology. 2005;34:231–252. [Google Scholar]
- Finch BK. The role of discrimination and acculturative stress in the physical health of Mexican-origin adults. Hispanic Journal of Behavioral Sciences. 2001;23 (4):399–429. [Google Scholar]
- Flores E, et al. Perceived racial/ethnic discrimination, posttraumatic stress symptoms, and health risk behaviors among Mexican American adolescents. Journal of Counseling Psychology. 2010;57 (3):264–273. doi: 10.1037/a0020026. [DOI] [PubMed] [Google Scholar]
- Garrison CZ, et al. Aggression, substance use, and suicidal behaviors in high school students. American Journal of Public Health. 1993;83 (2):179–184. doi: 10.2105/ajph.83.2.179. [DOI] [PMC free article] [PubMed] [Google Scholar]
- Gerbner G, et al. Growing up with television: the cultivation perspective. In: Bryant J, Zillmann D, editors. Media effects: advances in theory and research. New Jersey: Lawrence Erlbaum Associates; 1994. pp. 17–41. [Google Scholar]
- Gonzalez O, Berry JT. Current depression among adults: United States 2006 and 2008. Morbidity and Mortality Weekly Report. 2010;59 (38):1229–1235. [PubMed] [Google Scholar]
- Guyll M, Matthews KA, Bromberger JT. Discrimination and unfair treatment: relationship to cardiovascular reactivity among African American and European American women. Health Psychology. 2001;20 (5):315–325. doi: 10.1037//0278-6133.20.5.315. [DOI] [PubMed] [Google Scholar]
- Harrison L, Hughes A, editors. NIDA Research Monograph 167. Rockville, MD: U.S. Department of Health and Human Services; 1997. The validity of self-reported drug use: improving the accuracy of survey estimates. [PubMed] [Google Scholar]
- Jessor R. Risk behavior in adolescence: a psychosocial framework for understanding and action. Journal of Adolescent Health. 1991;12:597–605. doi: 10.1016/1054-139x(91)90007-k. [DOI] [PubMed] [Google Scholar]
- Johnston LD, et al. Monitoring the future, national results on adolescence drug use: overview of key findings, 2010. Ann Arbor: University of Michigan, Institute for Social Research; 2011. [Google Scholar]
- Jones M. Social psychology of prejudice. Englewood Cliffs, NJ: Prentice-Hall; 2002. [Google Scholar]
- Kaiser CR, Major B. A social psychological perspective on perceiving and reporting discrimination. Law & Social Inquiry. 2006;31 (4):801–830. [Google Scholar]
- Kessler R, et al. Sex and depression in the National Comorbidity Survey, I: lifetime prevalence, chronicity and recurrence. Journal of Affective Disorders. 1993;29:85–96. doi: 10.1016/0165-0327(93)90026-g. [DOI] [PubMed] [Google Scholar]
- Krieger N, Dorling D, McCartney G. Mapping injustice, visualizing equity: why theory, metaphors and images matter in tackling inequalities. Public Health. 2012;126 (3):256–258. doi: 10.1016/j.puhe.2012.01.028. [DOI] [PubMed] [Google Scholar]
- Kulis S, et al. Drug resistance and substance use among male and female adolescents in alternative secondary schools in Guanajuato, Mexico. Journal of Studies on Alcohol and Drugs. 2012;73 (1):111–119. doi: 10.15288/jsad.2012.73.111. [DOI] [PMC free article] [PubMed] [Google Scholar]
- Kulis S, Marsiglia FF, Nieri T. Perceived ethnic discrimination versus acculturation stress: influences on substance use among Latino youth in the Southwest. Journal of Health and Social Behavior. 2009;50 (4):443–459. doi: 10.1177/002214650905000405. [DOI] [PMC free article] [PubMed] [Google Scholar]
- Lorenzo-Blanco EI, et al. Acculturation, gender, depression, and cigarette smoking among U.S. Hispanic youth: the mediating role of perceived discrimination. Journal of Youth Adolescence. 2011;40 (11):1519–1533. doi: 10.1007/s10964-011-9633-y. [DOI] [PMC free article] [PubMed] [Google Scholar]
- Lowery BS, Sinclair S, Hardin CD. Self-stereotyping in the context of multiple social identities. Journal of Personality and Social Psychology. 2006;90 (4):529–542. doi: 10.1037/0022-3514.90.4.529. [DOI] [PubMed] [Google Scholar]
- MacDonald G, Jensen-Campbell L, editors. Social pain: neuropsychological and health implications of loss and exclusion. Washington, DC: American Psychological Association; 2011. [Google Scholar]
- Mair C, et al. Is neighborhood racial/ethnic composition associated with depressive symptoms? The multi-ethnic study of atherosclerosis. Social Science & Medicine. 2010;71 (3):541–550. doi: 10.1016/j.socscimed.2010.04.014. [DOI] [PMC free article] [PubMed] [Google Scholar]
- Moradi B, Risco C. Perceived discrimination experiences and mental health of Latina/o American persons. Journal of Counseling Psychology. 2006;53 (4):411–421. [Google Scholar]
- Pickett CL, Brewer MB. The role of exclusion in maintaining ingroup inclusion. In: Abrams D, Hogg MA, Marques JM, editors. The Social Psychology of Inclusion and Exclusion. New York, NY: Psychology Press; 2005. pp. 89–111. [Google Scholar]
- Pickett KE, Wilkinson RG. People like us: ethnic group density effects on health. Ethnicity & Health. 2008;13 (4):321–334. doi: 10.1080/13557850701882928. [DOI] [PubMed] [Google Scholar]
- Putnam R. E Pluribus Unum: diversity and community in the twenty-first century. The 2006 Johan Skytte Prize Lecture. Scandinavian Political Studies. 2007;30 (2):137–174. [Google Scholar]
- Radloff LS. The CES-D scale: a self-report depression scale for research in the general population. Applied Psychological Measurement. 1977;1:385–401. [Google Scholar]
- Roberts RE, Roberts C, Chen YR. Ethnocultural differences in prevalence of adolescent depression. American Journal of Community Psychology. 1997;25:95–110. doi: 10.1023/a:1024649925737. [DOI] [PubMed] [Google Scholar]
- Sears DO, Savalei V. The political color line in America: many ‘peoples of color’ or Black exceptionalism? Political Psychology. 2006;27 (6):895–924. [Google Scholar]
- Simons RL, Burt C. Learning to be bad: adverse social conditions, social schemas, and crime. Criminology. 2011;49 (2):553–598. doi: 10.1111/j.1745-9125.2011.00231.x. [DOI] [PMC free article] [PubMed] [Google Scholar]
- Steele CM. A threat in the air: how stereotypes shape intellectual identity and performance. American Psychologist. 1997;52 (6):613–629. doi: 10.1037//0003-066x.52.6.613. [DOI] [PubMed] [Google Scholar]
- Tran A, Lee R, Burgess D. Perceived discrimination and substance use in Hispanic/Latino, African-born Black, and Southeast Asian immigrants. Cultural Diversity and Ethnic Minority Psychology. 2010;16 (2):226–236. doi: 10.1037/a0016344. [DOI] [PubMed] [Google Scholar]
- Uhl GR, et al. Genetic influences in drug abuse. In: Bloom FE, Kupfer DJ, editors. Psychopharmacology: the 4th generation of progress. New York: Raven Press; 1994. pp. 1793–1806. [Google Scholar]
- Uhlmann E, et al. Subgroup prejudice based on skin color among Hispanics in the United States and Latin America. Social Cognition. 2002;20 (3):198–225. [Google Scholar]
- Umaña-Taylor AJ, Updegraff KA. Latino adolescents’ mental health: exploring the interrelations among discrimination, ethnic identity, cultural orientation, self-esteem, and depressive symptoms. Journal of Adolescence. 2007;30 (4):549–567. doi: 10.1016/j.adolescence.2006.08.002. [DOI] [PubMed] [Google Scholar]
- Unger JB, et al. Parent-child acculturation discrepancies as a risk factor for substance use among Hispanic adolescents in Southern California. Journal of Immigrant and Minority Health. 2009a;11 (3):149–157. doi: 10.1007/s10903-007-9083-5. [DOI] [PMC free article] [PubMed] [Google Scholar]
- Unger JB, et al. Parent-child acculturation patterns and substance use among Hispanic adolescents: a longitudinal analysis. The Journal of Primary Prevention. 2009b;30 (3–4):293–313. doi: 10.1007/s10935-009-0178-8. [DOI] [PMC free article] [PubMed] [Google Scholar]
- Weaver CN. The changing image of Hispanic Americans. Hispanic Journal of Behavioral Sciences. 2005;27 (3):337–354. [Google Scholar]
- Welniak E, Posey K. Census 2000 Brief. US Census Bureau; 2005. [Accessed 3 August 2012]. Available from: http://www.census.gov/prod/2005pubs/c2kbr-36.pdf. [Google Scholar]
- Williams KD, Cheung CK, Choi W. Cyberostracism: effects of being ignored over the internet. Journal of Personality and Social Psychology. 2000;79 (5):748–762. doi: 10.1037//0022-3514.79.5.748. [DOI] [PubMed] [Google Scholar]