

Abstract
The conformation of an N2-dG adduct arising from the heterocyclic amine 2-amino-3-methylimidazo[4,5-f]quinoline (IQ), a potent food mutagen, was determined in 5′-d(C1T2C3X4G5C6G7C8C9A10T11C12)-3′:5′-d(G13A14T15G16G17C18G19C20C21G22A23G24)-3′; X = N2-dG-IQ, in which the modified nucleotide X4 corresponds to G1 in the 5′-d(G1G2CG3CC)-3′ NarI restriction endonuclease site. Circular dichroism (CD) revealed blue shifts relative to the unmodified duplex, consistent with adduct-induced twisting, and a hypochromic effect for the IQ absorbance in the near UV region. NMR revealed that the N2-dG-IQ adduct adopted a base-displaced intercalated conformation in which the modified guanine remained in the anti conformation about the glycosidic bond, the IQ moiety intercalated into the duplex, and the complementary base C21 was displaced into the major groove. The processing of the N2-dG-IQ lesion by hpol η is sequence-dependent; when placed at the reiterated G3 position, but not at the G1 position, this lesion exhibits a propensity for frameshift replication [Choi, J. Y., et al. (2006) J. Biol. Chem., 281, 25297–25306]. The structure of the N2-dG-IQ adduct at the nonreiterated G1 position was compared to that of the same adduct placed at the G3 position [Stavros, K. M., et al. (2014) Nucleic Acids Res., 42, 3450–3463]. CD indicted minimal spectral differences between the G1 vs G3N2-dG-IQ adducts. NMR indicated that the N2-dG-IQ adduct exhibited similar base-displaced intercalated conformations at both the G1 and G3 positions. This result differed as compared to the corresponding C8-dG-IQ adducts placed at the same positions. The C8-dG-IQ adduct adopted a minor groove conformation when placed at position G1 but a base-displaced intercalated conformation when placed at position G3 in the NarI sequence. The present studies suggest that differences in lesion bypass by hpol η may be mediated by differences in the 3′-flanking sequences, perhaps modulating the ability to accommodate transient strand slippage intermediates.
Introduction
Browning meats during cooking imparts flavor, but it also forms heterocyclic amines (HCAs) such as 2-amino-3-methylimidazo[4,5-f]quinoline (IQ) (Scheme 1).1−5 IQ is produced in cooking at parts per billion levels.6,7 It has also been detected in tobacco smoke.8 IQ induces tumors in rodents and monkeys.9−12 Liver, forestomach, and lung tumors have been observed in mice,13 whereas liver, intestine, zymbal gland, clitoral gland, skin,14 mammary gland, and ear duct tumors have been observed in rats.15 IQ exhibits TD50 values of 0.7 and 14.7 mg/kg/day in rats and mice, respectively.16 Human exposures, estimated to be 60 ng/day,17 are likely to contribute to cancer etiology.18,19 Human exposures to HCAs have been associated with cancers of the pancreas,20 colon,21 prostate,22 and breast.23,24 HCAs and their metabolites have been isolated from human urine.25
Scheme 1. Bioactivation of IQ.

Cytochrome P450-mediated N-hydroxylation followed by N-acetylation of the hydroxylamine and deacetylation forms an electrophilic aryl nitrenium ion. The aryl nitrenium ion alkylates guanine in DNA via the IQ amine nitrogen to form the C8-dG-IQ adduct or, alternatively, alkylates DNA via the C5 position of the IQ ring to form the N2-dG-IQ adduct.
IQ is a strong mutagen in Salmonella typhimurium reversion (Ames) assays and is active in both point and frameshift tester strains.3,26,27 It is particularly active in tester strain TA98, which is designed to detect two-nucleotide deletions in a CG repeat sequence. Despite the fact that IQ is formed at lower levels than another HCA, 2-amino-1-methyl-6-phenylimidazo[4,5-b]pyridine (PhIP),28 it is two orders of magnitude more mutagenic than PhIP in TA98 cells.3 IQ is also an order of magnitude more mutagenic than that of the mycotoxin, aflatoxin B1.18 Consequently, it may play a significant role in mutagenesis. IQ gives rise to mutations at G:C base pairs in Escherichia coli(29,30) and induces two-nucleotide frameshifts in CG repeats. The mammalian hprt(31) and ef-2(32) gene assays reveal similar levels of mutations induced by IQ. In mammalian cells, base pair substitutions predominate.33−35 Sister chromatid exchange has been observed in rodent cells exposed to IQ.36−38
IQ-mediated genotoxicity is primarily derived from CYP P450 oxidation to an N-hydroxylamine,39−43 although extra-hepatic CYP P450s have been shown to oxidize HCAs with lower efficiencies (Scheme 1).44 N-Acetyl transferases, particularly NAT2,45−47 then acetylate the N-hydroxylamine. In humans, the NAT2 fast acetylator polymorphism has been correlated with increased genotoxicity and cancer.48−50 Solvolysis of the N-acetoxy intermediate yields the ultimate electrophile, a nitrenium ion.35,44 This species reacts predominately at C8-dG, while a minor alkylation product is formed at N2-dG.51−53 IQ may also be metabolized to a reactive and genotoxic N-nitrosamine that exhibits similar regioselectivity with regard to DNA alkylation.54,55
Levels of C8- and N2-dG-IQ adducts have been measured in rat and primate tissues using mass spectrometry.56,57 Turesky and co-workers58 monitored C8-dG-IQ adduct formation in human hepatocyte cells using tandem liquid chromatography–electrospray ionization mass spectrometry. Levels ranged from 7 to 26 adducts per 107 bases. Although it is less abundant in DNA, the N2-dG-IQ adduct was more persistent in rat tissues, suggesting that it is repaired less efficiently.59 Consequently, it has been anticipated that the N2-dG-IQ adduct may play a significant role in IQ-mediated genotoxicity.
The preparation of phosphoramidite reagents of the C8- and N2-dG-IQ adducts in which the Buchwald–Hartwig palladium-catalyzed N-arylation was the key C–N bonding-forming step,60−63 allowed site-specific incorporation of these adducts into oligodeoxynucleotides using solid-phase synthesis. Subsequently, the conformation of the N2-dG-IQ adduct was determined in the 5′-d(C1T2C3G4G5C6X7C8C9A10T11C12)-3′:5′-d(G13A14T15G16G17C18G19C20C21G22A23G24)-3′ duplex; X = N2-dG-IQ.64 This duplex contained the recognition sequence of the NarI restriction endonuclease, 5′-d(CG1G2CX3CC)-3′, in which X3 in the NarI sequence corresponds to X7 in this dodecamer. When placed at the X7 position, the IQ moiety intercalated, with the IQ H4a and CH3 protons facing the minor groove and the IQ H7a, H8a, and H9a protons facing the major groove. The adducted nucleotide maintained the anti conformation about the glycosidic bond. The complementary dC was extruded into the major groove. The duplex maintained its thermal stability, which was attributed, in part, to stacking between the IQ heterocyclic ring and the 5′- and 3′-neighboring base pairs. The base-displaced intercalated conformation of the N2-dG-IQ adduct differed from that of the C8-dG-IQ adduct,65 providing insight as to the persistence of the N2-dG-IQ adduct59 and its processing during replication and repair.
The NarI sequence, 5′-d(G1G2CG3CC)-3′, provides a platform for investigating sequence-specific perturbation of DNA conformation by IQ adducts, in relationship to biological processing.66−71 In bacterial systems, the G3 position is a hot spot for two-base frameshift deletions, whereas the G1 position is not.67−69,71 As well, Choi et al.72 showed that the human DNA polymerase (hpol) η produces two-base deletions when replicating past the N2-dG-IQ adduct located at position G3, but it does not when located at position G1, in vitro.
Presently, in an effort to understand how sequence context in the NarI restriction site modulates the processing of N2-dG-IQ adducts, the N2-dG-IQ adduct has been incorporated into 5′-d(C1T2C3X4G5C6G7C8C9A10T11C12)-3′:5′-d(G13A14T15G16G17C18G19C20C21G22A23G24)-3′; X = N2-dG-IQ, in which the modified nucleotide X4 corresponds to G1 in the NarI sequence (Chart 1). The conformation of the N2-dG-IQ adduct in this duplex, as determined by NMR spectroscopy, is similar to its conformation at the X7 position (the G3 position of the NarI sequence).64 The IQ heterocyclic ring forms a base-displaced intercalated conformation, disrupting Watson–Crick hydrogen bonding at the lesion site, and flips the complementary cytosine into the major groove. Thus, the N2-dG-IQ adduct favors a base-displaced intercalated conformation at both positions G1 and G3 of the NarI sequence. Small changes in the two base-displaced intercalated conformations at the G1 vs G3 positions, and differences in their biological processing, e.g., by hpolη, may be due to differences in the respective 3′-flanking sequences, the importance of which have been previously noted by Cho and co-workers.73−75 The sequence-dependent conformational behavior of the N2-dG-IQ adduct differs from that of the C8-dG-IQ adduct, which favors the base-displaced intercalated conformation when placed at position G3,65 but it orients in the minor groove when placed at positions G1 or G2.76
Chart 1. (A) Structure of 2-Amino-3-methylimidazo[4,5-f]quinoline (IQ), (B) Structure of the N2-dG-IQ Adduct, Showing the Numbering of Guanine Base and IQ Protons, and (C) The Duplex Containing the NarI Sequence, Showing the Numbering of the Nucleotidesa.

a The N2-dG-IQ adduct is positioned at X4, which corresponds to the G1 non-reiterated position of the NarI sequence.
Materials and Methods
Sample Preparation
The synthesis of the N2-dG-IQ-adducted oligodeoxynucleotide, 5′-d(CTCXGCGCCATC)-3′, has been described.63 The oligodeoxynucleotide 5′-d(GATGGCGCCGAG)-3′, purified by anion exchange chromatography, was obtained from the Midland Certified Reagent Company (Midland, TX). The oligodeoxynucleotides were purified by HPLC using an acetonitrile gradient from 5 to 12% over 35 min in ammonium formate (pH 7) with a base-deactivated C18 Supesilco LS-18-DB column (Sigma-Aldrich, St. Louis, MO). The oligodeoxynucleotides were characterized MALDI-TOF mass spectrometry in the negative ion mode using a hydroxypicolinic acid matrix. The oligodeoxynucleotides were annealed in 180 μL of 0.1 M NaCl, 0.05 mM Na2EDTA, and 10 mM NaH2PO4 (pH 7.0).
Thermal Melting Experiments
UV thermal melting data were collected on Cary 100 Bio UV spectrometer using 0.5 OD of duplex in 1 mL of solution containing 0.1 M NaCl, 10 mM NaH2PO4, and 0.05 mM Na2EDTA (pH 7.0). The temperature was increased from 25 to 75 °C at a rate of 1 °C/min. The Tm values were calculated from first-derivative analyses of the resulting plots.
Circular Dichroism
The samples contained 0.5 A260 units of duplex in 800 μL of 0.1 M NaCl, 0.05 mM Na2EDTA, and 10 mM Na2HPO4 (pH 7.0). Data was obtained by signal averaging on a Jasco 720 spectropolarimeter (Jasco, Inc., Easton, MD) with a response time of 1 s, a scan rate of 20 nm/min, and step resolution of 1 nm across a wavelength of 210–400 nm. Ten scans were signal-averaged.
NMR
Spectra were obtained at 900 MHz using a 5 mm cryogenic probe (Bruker Biospin Inc., Billerica, MA). Oligodeoxynucleotides were prepared at a duplex concentration of 78 nM in 180 μL of 100 mM NaCl, 50 μM Na2EDTA, in 10 mM Na2HPO4 (pH 7.0). To observe nonexchangeable protons samples were exchanged with D2O and dissolved in 180 μL of 99.996% D2O. NOESY77 spectra were collected at 150, 200, or 250 ms mixing times and relaxation delay of 1.8 s, using TPPI quadrature detection. Data were recorded with 2K real points in the t2 dimension and 512 real points in the t1 dimension. Spectra were zero-filled during processing to create a 2K × 2K matrix. The temperature was 15 °C. To observe exchangeable protons, samples were prepared in 9:1 H2O/D2O. Water suppression was achieved by the Watergate pulse sequence.78 NOESY spectra were collected at 5 °C with a 100 ms mixing time and a relaxation delay of 1.2 s. Chemical shifts were referenced to the chemical shift of water at the corresponding temperature, with respect to trimethylsilyl propanoic acid (TSP). Data were processed with TOPSPIN (2.0.b.6, Bruker Biospin Inc., Billerica, MA).
NMR Experimental Restraints
The spectral data were evaluated using the program SPARKY.79 The intensities of NOE cross-peaks were measured by volume integrations. The bounds for overlapped peaks were optimized manually. Noise was assigned half the intensity of the weakest peak, and motion was assumed to be isotropic. The integrated intensities of the cross-peaks were combined with calculated intensities generated from complete relaxation matrix analysis of the starting DNA structure to generate a hybrid intensity matrix.80,81 The program MARDIGRAS,82−84 using the RANDMARDI84,85 algorithm, was used to refine the hybrid matrix by iteration between the calculated and experimental NOE intensities, yielding calculated interproton distances. The calculations were initiated using isotropic correlation times of 2, 3, and 4 ns. Analysis of these calculated interproton distances yielded experimental distance restraints used in subsequent molecular dynamics calculations.
Restrained Molecular Dynamics Calculations
A starting structure in which G4 in the B-type DNA duplex86 was replaced by the N2-dG-IQ adduct was built in InsightII (Accelrys Inc., San Diego, CA). Partial charges for the modified base were calculated in GAUSSIAN87 using the basis set B3LYP/6-31G*.64 The starting structure was energy-minimized for 1000 cycles using the steepest descent method. The generalized Born model88 with parameters developed by Tsui and Case89 was used for implicit water simulation. rMD calculations with a simulated annealing protocol using 0.1 M salt were run using AMBER 1090 and the parm9991 force field. A force constant of 32 kcal mol–1 Å–2 was applied to all restraints. A simulated annealing protocol92 coupled the molecule to a heat bath was used for temperature control. The system was heated to 600 K in 1 ps, held for 1 ps, cooled to 100 K in 16 ps, and then cooled to 0 K in 2 ps using an 18 Å cutoff. Data were recorded every picosecond. Further refinement was performed using a longer 100 ps (100 000 steps) protocol. Here, the temperature was increased from 0 to 600 K during steps 0 to 5000 with a coupling of 0.5 steps. The temperature was held at 600 K from steps 5001 to 10 000. The system was then cooled from 600 to 100 K over steps 10 001 to 90 000 with a coupling of 4 ps. The system was cooled to 0 K from steps 90 001 to 100 000 with a coupling of 1 ps. Structure coordinates were energy-minimized and saved after each calculation. Nine refined structures were used to create an average structure determined by the lowest deviation from experimental intensities. The average structure was subjected to potential energy minimization using the conjugate gradients method. Theoretical NMR intensities for the calculated structure were determined using CORMA.80,81 Calculations were run until sixth root residuals (R1x values) for NOE intensities of the individual bases as well as the overall residuals for the duplex were below 10%. Helicoidal analysis on the average structure was performed using the CURVES+ web server.93,94
Results
Sample Preparation and Characterization
The N2-dG-IQ adduct was incorporated into 5′-d(CTCXGCGCCATC)-3′ using automated solid-phase synthesis.63 It was located at position X4, corresponding to position G1 in the NarI sequence (Chart 1). The modified oligodeoxynucleotide was purified by C18 reverse-phase HPLC and characterized by MALDI-TOF mass spectrometry in negative ion mode (modified strand m/z obsvd, 3779; calcd, 3778; complementary strand m/z obsvd, 3712; calcd, 3711). Thermal melting (Tm) profiles of 0.5 A260 units of the IQ-modified duplex were monitored at 100 mM NaCl (1 mL volume) as a function of temperature by absorbance at 260 nm. An unmodified duplex was evaluated under the same conditions to provide a basis for comparison. The Tm of the modified duplex was 62 °C, compared to the unmodified duplex, which had a melting temperature of 63 °C. Thus, the N2-dG-IQ adduct did not greatly reduce the thermal stability of this oligodeoxynucleotide duplex. This result was similar to that observed for the N2-dG-IQ adduct located at position G3 (Tm 63 °C) (Table S1, Supporting Information).64
Circular Dichroism
The G1 and G3N2-dG-IQ adducts exhibited maximum UV intensities at 270 nm (Figure 1). In the CD spectrum, a blue shift of 5 nm relative to the unmodified duplex was observed. Below 260 nm, the CD of the G1 and G3N2-dG-IQ modified duplexes were similar to that of the unmodified duplex. The sign of the molar ellipticity inverted at 260 and 264 nm, respectively, for the G1 and G3 adducts, and each exhibited spectral minima at 248 nm, as compared to the unmodified duplex, for which the sign of the molar ellipticity inverted at 261 nm and which exhibited a spectral minima at 248 nm. However, the magnitudes of the molar ellipticities of the G1 and G3 adducts were reduced with respect to those of the unmodified NarI duplex. For the C8-dG-IQ single-stranded sample, the IQ-induced circular dichroic signal was reported at 300–360 nm,61 although it was broad. For the N2-dG-IQ adducted samples, there was negligible circular dichroic signal detected in this range. Likewise, the UV absorption spectrum was null in this range.
Figure 1.

CD spectra for the N2-dG-IQ adduct when positioned at G1 or G3 as compared to the CD spectrum of the unmodified NarI sequence.
NMR
Assignments of Nonexchangeable DNA Protons
At 15 °C, the N2-dG-IQ duplex yielded sharp, well-resolved resonances for nonexchangeable protons (Figure 2). The assignments were made according to established procedures.95,96 A complete set of sequential NOEs was observed for both the modified strand and the complementary strand. At the modified X4 base, the sequential X4 H8 to X4 H1′ NOE was of similar intensity to that of the other purine H8 to H1′ NOEs. In the complementary strand, at the C21 base pair, the sequential C21 H1′ to G22 H8 NOE was weak, suggesting that the presence of the N2-dG-IQ lesion resulted in a greater distance between these protons in the complementary strand. The G7 H8 and G19 H8 resonances severely overlapped over the temperature range that the NOESY data were collected. However, base pairs C6:G19 and G7:C18 are two and three base pairs removed from the adduct site in the 3′-direction, and their chemical shifts were within ±0.05 ppm of the G7 H8 and G19 H8 resonances in the unmodified duplex, suggesting that these base pairs were largely unaffected by the presence of the N2-dG-IQ adduct. With the assignments of the deoxyribose H1′ resonances in hand, the deoxyribose H2′, H2″, H3′, and most of the H4′ resonances could be assigned unequivocally. The stereotopic assignments of the H5′ and H5″ protons were not completed. The assignments of the nonexchangeable protons are tabulated in Table S2 of the Supporting Information.
Figure 2.

Expanded region of the NOESY spectrum showing NOE connectivity between base aromatic protons and deoxyribose anomeric protons for the N2-dG-IQ adduct located at the G1 position of the NarI restriction sequence. (A) Bases C1–C12 of the modified strand. (B) Bases G13–G24 of the complementary strand. The spectrum was acquired at 900 MHz with a NOE mixing time of 150 ms. The temperature was 15 °C.
Exchangeable Protons
Figure 3 shows an expansion of the far downfield region of the NOESY spectrum, showing NOEs between the Watson–Crick imino protons and the amino protons at 5 °C. With the exception of the modified X4:C21 base pair, all protons involved in Watson–Crick hydrogen bonding were observed. At the modified X4:C21 base pair, the X4 N1H imino proton resonance was identified at 11.8 ppm, but it was nearly completely broadened at 10 °C. The C21N4 H amino protons were not observed. The broadening of the X4 N1H proton and the failure to observe the C21 N4H protons were attributed to their rapid exchange with water. It exhibited a 1.6 ppm upfield shift as compared to the G4 N1H resonance in the unmodified duplex, which indicated that it was not involved in Watson–Crick hydrogen bonding. The X4 N1H proton did not show NOE cross-peaks to the C21N4H amino protons. However, the X4 N1H proton exhibited a weak NOE to the X4N2 H amino proton of the modified X4:C21 base pair, observed as a sharp resonance at 9.5 ppm. The X4N2H proton did not exhibit NOEs to the imino protons of the flanking C3:G22 or G5:C20 base pairs; however, it did exhibit NOEs to the C3N4 amino protons of the 5′-flanking C3:G22 base pair as well as IQ protons H4a and H9a. The X4N2H resonance remained sharp to a temperature of 55 °C, which was attributed to the potential for hydrogen bond formation with the nitrogen atom in the IQ ring. No cross-peaks corresponding to the C21N4H amino protons were observed, suggesting that the C21 exocyclic amine was likely solvent-exposed (Figure 3). The assignments of the exchangeable protons are tabulated in Table S3 of the Supporting Information.
Figure 3.

Expanded region of the NOESY spectrum showing the exchangeable proton assignments for the N2-dG-IQ modified duplex at position G1 of the NarI restriction sequence. (A) Sequential connectivity of imino protons T2–T11. (B) NOE connectivity from imino protons to amino protons involved in Watson–Crick hydrogen bonding. The cross-peaks are labeled a′, X4N2H → C20N4Hb; a, X4N2H → C20N4Ha; b′, X4N2H → C3N4Hb; b, X4N2H → C3N4Ha; c′, G5 N1H → C20N4Hb; c, G5 N1H → C20N4Ha; d′, G22 N1H → C3N4Hb; e′, G19 N1H → C6N4Hb; e, G19 N1H → C6N4Ha; f′, G16 N1H → C9N4Hb; f, G16 N1H → C9N4Ha; g′, G17 N1H → C8N4Hb; g, G17 → C8N4Ha; h′, G7 N1H → C18N4Hb; h, G7 N1H → C18N4Ha; i′, G24 N1H → C1N4Hb; i, G24 N1H → C1N4Ha; j, T15 N3H → A10 H2; k, T11 N3H → A14 H2; l, T2 N3H → A23 H2; 1, X4N2H → IQ H4a; 2, X4N2H → IQ H9a; 3, G22N2H → IQ H4a. The spectrum was acquired in 90:10 H2O:D2O at 900 MHz with a NOE mixing time of 150 ms. The temperature was 15 °C.
IQ Protons
The assignment of the IQ adduct protons is shown in Figure 4. A strong NOE was observed between the IQ H4a proton, observed at 8.57 ppm, with the IQ CH3 protons, observed as a singlet of area three protons, at 3.23 ppm. The IQ H8a (6.9 ppm) and H9a (7.75 ppm) protons were identified on the basis of their scalar coupling interaction. The IQ H7a resonance (8.11 ppm) was assigned on the basis of its NOE to the IQ H8a proton. In the COSY spectrum, the scalar coupling cross-peak between the IQ H7a and H8a protons was broadened, so the coupling constant could not be determined. This was also observed in NMR spectra of the modified nucleoside97 and had been observed for the N2-dG-IQ adduct positioned at G3 of the NarI sequence.64 It was attributed to the presence of the quinoline nitrogen atom adjacent to C7 in the IQ ring. The assignments of the IQ protons are tabulated in Table S4 of the Supporting Information.
Figure 4.

Expanded region of the NOESY spectrum showing the assignments of the IQ aryl ring for the N2-dG-IQ adduct located at position G1 of the NarI restriction sequence. (A) The IQ H4a proton resonance was observed at 8.56 ppm. (B) The IQ H7a resonance was observed at 8.11 ppm. (C) The IQ H9a resonance was observed at 7.74 ppm. (D) The IQ H8a resonance was observed at 6.87 ppm. (E) The IQ CH3 resonance was observed at 3.23 ppm. The spectrum was acquired at 900 MHz with a NOE mixing time of 150 ms. The temperature was 15 °C.
NOEs between IQ Protons and DNA Protons
A total of 26 NOEs were observed between IQ protons and DNA protons (Figure 5). The pattern of NOEs for the IQ CH3 and H4a protons differed from that of the IQ H7a, H8a, and H9a protons. The IQ CH3 and H4a protons exhibited NOEs to the X4 and G5 protons in the modified strand. The CH3 protons showed a strong NOE to X4 H1′ and a medium NOE to G5 H8. Weaker NOEs were observed to X4 H2′, X4 H2″ (not shown in Figure 5), and G5 H1′. The H4a proton showed a strong NOE to X4 H1′ and additional NOEs to X4 H2′, H2″, and X4 H5′, H5″. In contrast, the IQ H7a, H8a, and H9a protons exhibited NOEs to protons in the complementary strand. The H7a proton showed a medium NOE to C21 H1′ and weak NOEs to C20 H5 and C20 H2′, H2″. The IQ H8a proton exhibited medium intensity NOEs to C20 H1′, H2′, H2″, and C21 H1′, and weak NOEs to C21 H2′, H2″, and H5′, H5″. There were also weak NOEs between the IQ H8 proton and C20 H6 and G22 H8. The IQ H9a proton showed a medium NOE to C21 H1′ and a weak NOE to C20 H2″, as well as weak NOEs to G22 H1′, G22 H5′, H5″ and weak NOEs to G22 H8 and C20 H6 and H6. There were no NOEs observed between the IQ protons and either C21 H5 or H6. The NOEs between the IQ moiety and the DNA are summarized in Table 1.
Figure 5.

Expansion of the NOESY spectrum showing NOEs between the N2-dG-IQ adduct located at position G1 of the NarI restriction sequence and the DNA. The peaks are numbered as 1, H4a → X4 H2″; 2, H4a → X4 H2′; 3, H4a → X4 H5′; 4, H4a → X4 H5″; 5, H4a → X4 H1′; 6, H7a → C20 H2′; 7, H7a → C20 H2″; 8, H7a → C20 H5; 9, H7a → C20 H1′; 10, H9a → G22 H5′; 11, H9a → G22 H5″; 12, H9a → G22 H1′; 13, H8a → G22 H8; 14, H8a → C20 H6; 15, H8a → C20 H2′; 16, H8a → C21 H2′; 17, H8a → C20 H2″; 18, H8a → C21 H2″; 19, H8a → C21 H5′; 20, H8a → C21 H5″; 21, H8a → C21 H4′; 22, H8a → C20 H1′; 23, H8a → C21 H1′; 24, CH3 → G5 H1′; 25, CH3 → X4 H1′; 26, CH3 → G5 H8. The spectrum was acquired at 900 MHz with a NOE mixing time of 150 ms. The temperature was 15 °C.
Table 1. NOEs from IQ Protons of the N2-dG-IQ Adduct at Position G1 of the NarI Restriction Site to Oligodeoxynucleotide Protons and Relative Intensities of the Cross-Peaks.
| IQ proton | NOEs to oligodeoxynucleotide protons |
|---|---|
| CH3 | X4 H1′, strong; G5 H8, medium; G5 H1′, weak |
| H4a | X4 H1′, strong; X4 H2″, weak; X4 H2′, weak; X4 H5″, weak |
| H7a | C21 H1′, medium; C20 H5, medium; C20 H2″, weak; C20 H2′, weak |
| H8a | C21 H1′, medium; C20 H1′, medium; C21 H4′, medium; C20 H2″, medium; G22 H8, weak; C20 H6, weak; C21 H2′, weak; C21 H2″, weak; C21 H5′, weak; C21 H5″, weak |
| H9a | C21 H1′, medium; C20 H5, medium; C20 H2″, weak; G22 H1′, weak |
Chemical Shift Effects
Significant chemical shift perturbations were observed at modified base pair X4:C21 and flanking base pairs C3:G22 and G5:C20 (Figure 6). At modified base pair X4:C21, the X4 H8 resonance was shifted downfield 0.47 ppm and the X4 H1′ resonance was shifted downfield by 0.74 ppm, relative to the unmodified duplex. The C21 H6 and H1′ resonances of the complementary base C21 were shifted downfield by 0.81 and 1.26 ppm, respectively. At the 5′-neighbor C3:G22 base pair, the C3 H1′ and H6 resonances were shifted 0.51 and 0.46 ppm downfield, respectively, whereas the G22 H1′ and H8 resonances were shifted 0.17 and 0.34 ppm downfield, respectively. At the 3′-neighbor base pair G5:C20, the G5 H8 resonance was shifted 0.28 downfield, whereas the C20 H6 resonance was shifted 0.19 ppm upfield. The chemical shifts of the other base pairs were relatively unaffected by the presence of the N2-dG-IQ lesion, shifting less than 0.1 ppm as compared to the unmodified duplex. The relative pattern of chemical shift perturbations closely resembled that of the N2-dG-IQ adduct located at position G7.64 In both instances, the cytosine complementary to the adduct, C21 in the present instance and C18 when the N2-dG-IQ adduct was located at position G7, exhibited the largest downfield shifts, whereas chemical shift perturbations to the bases to either side of the opposite bases were less than half the magnitude of the base directly opposite, either C18 or C21 for G3 and G1. The N2-dG-IQ H8 proton was shifted downfield as well by 0.4 ppm, and the base protons flanking the modification were also perturbed by a similar magnitude.
Figure 6.

Chemical shift perturbations induced by the presence of the N2-dG-IQ adduct at position G1 of the NarI restriction sequence. (A) The modified strand, showing nucleotides C1 → C12. (B) The complementary strand, showing nucleotides G24 ← G13. The black bars represent the deoxyribose H1′ resonances, and the gray bars represent the purine H8 or pyrimidine H6 resonances. In all cases, Δδ = Δδunmodified – ΔδNarIIQ at G1, where negative Δδ values correspond to downfield shifts and positive Δδ values correspond to upfield shifts.
Structure Refinement
Overall, a total of 283 NOEs were obtained from NOESY data (Table 2). Of these, 23 NOEs were involved in dipolar interactions between IQ and DNA protons. A total of 49 restraints for Watson–Crick hydrogen bonding were utilized, based upon the observation that the presence of the N2-dG-IQ adduct prevented Watson–Crick hydrogen bonding only at the modified X4:C21 base pair. No Watson–Crick hydrogen bonding restraint was applied at the X4:C21 base pair. A total of 100 empirical phosphodiester backbone torsion angle restraints and 20 deoxyribose pseudorotation restraints based on canonical values for B-DNA86 were also applied, based upon the observation that the structural perturbation to the DNA duplex was localized at the site of the lesion and the immediately flanking base pairs. These were not applied to base pairs C3:G22, X4:C21, and G5:C20. Ten emergent structures, based on the lowest deviations from experimental and empirical restraints, were selected. The convergence of these 10 structures is shown in Figure 7. Overall, these exhibited a maximum pairwise RMSD of 1.3 Å (Table 3). The rMD calculations exhibited poorer convergence at base pairs C1:G24, T2:A23, and C3:G22. This was attributed, in part, to the fraying of the duplex at the terminal base pairs.
Table 2. Refinement Statistics for the N2-dG-IQ at Position G1 in the NarI Sequence.
| NOE Restraints | |
| internucleotide | 155 |
| intranucleotide | 128 |
| total | 283 |
| backbone torsion angle restraints | 100 |
| H-bonding restraints | 49 |
| deoxyribose restraints | 20 |
| total number of restraints | 442 |
| Refinement Statistics | |
|---|---|
| number of distance restraint violations | 70 |
| number of torsion restraint violations | 46 |
| total distance penalty/maximum penalty [kcal mol–1] | 3.0/0.24 |
| total torsion penalty/maximum penalty [kcal mol–1] | 1.7/0.16 |
| RMS distances (Å) | 0.012 |
| RMS angles (deg) | 2.5 |
| distance restraint force field [kcal mol–1 Å–2] | 32 |
| torsion restraint force field [kcal mol–1 deg–2] | 32 |
Figure 7.
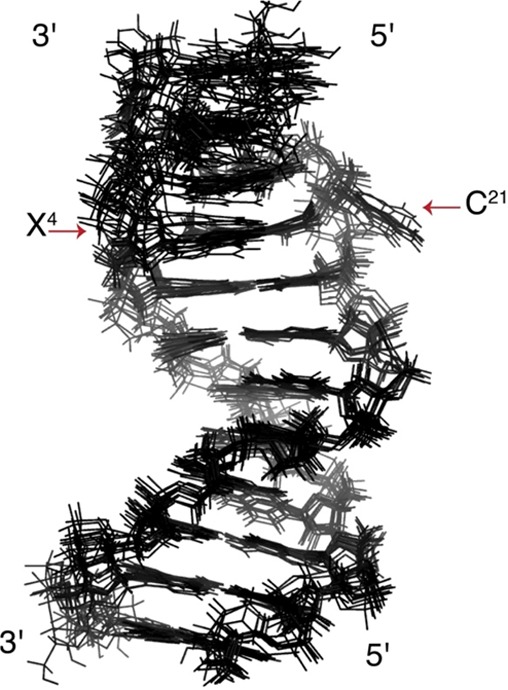
Superposition of the 10 structures emergent from the rMD calculations that exhibited the lowest deviations from experimental and empirical restraints. The arrows indicate the positions of the N2-dG-IQ modified X4 nucleotide and the complementary C21 nucleotide.
Table 3. Structural Statistics for the Refined Structure of the N2-dG-IQ Adduct at Position G1 in the NarI Sequence.
| average structure (obtained from 10 structures) | |
|---|---|
| RMS pairwise difference between structures | 1.27 |
| RMS difference from average structure | 0.85 |
| complete
relaxation matrix analysis analysis for average structurea | |||
|---|---|---|---|
| intranucleotide | internucleotide | total | |
| R1xb | 0.091 | 0.095 | 0.093 |
| average errorc | 0.0037 | ||
The mixing time was 150 ms.
R1x is the sixth root R factor: ∑[((Io)i1/6 – (Ic)i1/6)/∑(Io)i1/6].
Average error: ∑(Ic – Io)/n, where the Ic is the NOE intensity calculated from the refined structure and Io is the experimental NOE intensity.
These 10 structures were averaged and subjected to potential energy minimization, yielding an average structure. In the averaged structure, the total distance penalty was 3.0 kcal mol–1, with the maximum individual distance penalty being 0.24 kcal mol–1. The total torsion angle penalty was 1.7 kcal mol–1, with the maximum single torsion angle penalty being 0.16 kcal mol–1. Complete relaxation matrix calculations were performed using the program CORMA to evaluate the agreement between the average structure and the NOE data. These showed that the overall sixth root residual (R1x value) for the average of the structures emergent from the rMD calcutions was 0.09. The sixth root residuals for the individual nucleotides (Figure 8) remained below 0.10, with the exception of nucleotides C8, G17, and C18, which remained below 0.15. However, nucleotides C8, G17, and C18 were each at least three nucleotides away from modified base pair X4:C21, and the greater sixth root residuals observed for these three nucleotides were attributed to less accurate measurements of distances due to spectral overlap involving these nucleotides.
Figure 8.

Sixth root residuals (R1x) obtained from complete relaxation matrix calculations from the average of 10 structures emergent from the rMD calculations of the N2-dG-IQ modified duplex. The black bars represent intranucleotide sixth root residuals, and the gray bars represent internucleotide sixth root residuals. (A) Nucleotides C1–C12 in the modified strand. (B) Nucleotides G13–G24 in the complementary strand.
Conformation of the N2-dG-IQ Adduct
In the average refined structure (Figure 9), modified guanine base X4 remained in the anti conformation about the glycosidic bond, but it shifted toward the major groove. The IQ ring was intercalated into the duplex. The complementary base C21 was displaced from the duplex and was into the major groove. The intercalated IQ ring was positioned such that the imidazole portion of the IQ ring, containing the CH3 and H4a protons, oriented toward the modified strand of the duplex, whereas the quinoline moiety, containing the H7a, H8a, and H9a protons, oriented toward the complementary strand. The intercalated IQ moiety remained in-plane with damaged base X4. The X4 C2–X4N2–IQ C5–IQ C6 dihedral angle was 178°. The stacking of the 5′-neighbor C3:G22 base pair and of the 5′-neighbor base pair G5:C20 relative to the modified X4 base is shown in Figure 10. The IQ moiety was stacked primarily above the 3′-neighbor G5:C20 base pair, with the X4 guanine base stacked below the 5′-neighbor C3:G22 base pair. Helicoidal analysis indicated that accommodation of the IQ moiety in the duplex created a localized unwinding and conformational perturbation of the helix. The helical twist decreased by 15° at the adduction site. The tip of the 5′-neighbor base pair C3:G22 increased by 20°. The tilt between C3 and X4 decreased by 13°, and between X4 and G5, it increased by 23°. The roll between bases C3 and X4 decreased by 24°, and that between X4 and G5 increased by 21°. The displacement of the complementary base C21 into the major groove was evidenced by a 98° increase in base opening as compared to the G4:C21 base pair in the unmodified duplex. At the lesion site, the average structure of the modified duplex was bent 10° compared to the unmodified duplex.
Figure 9.
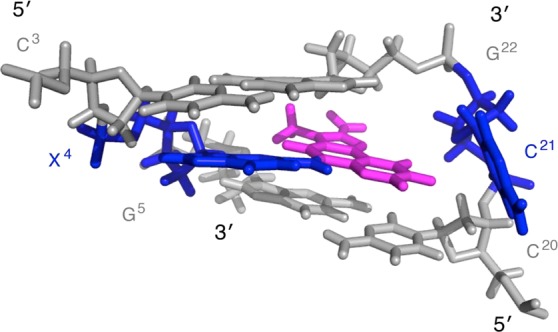
Expanded view of the average refined structure of the N2-dG-IQ adduct located at position G1 of the NarI restriction sequence, showing base pairs C3:G22, X4:C21, and G5:C20, as shown from the major groove. The IQ moiety is in magenta.
Figure 10.
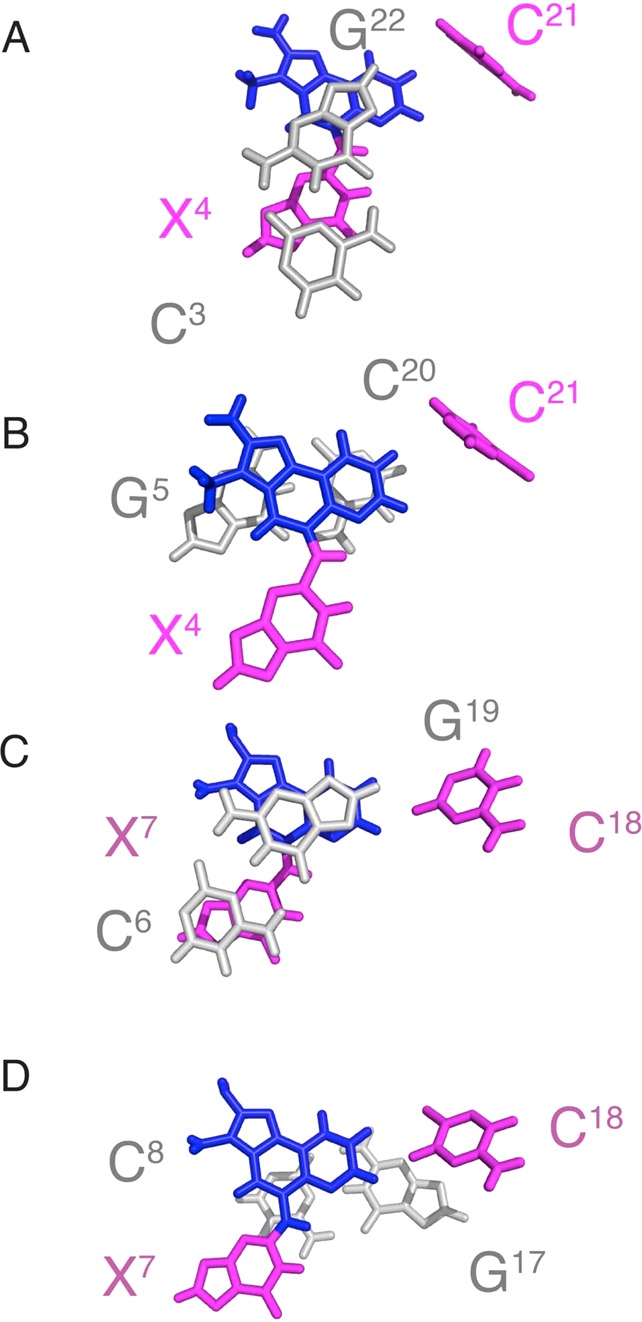
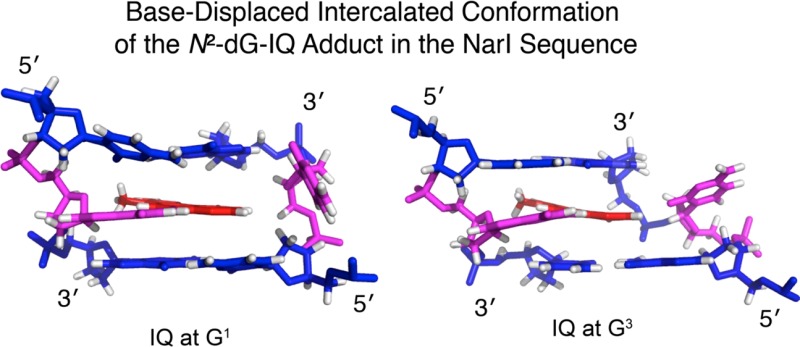
Expanded views of base-stacking interactions for the N2-dG-IQ adduct located at position G1 of the NarI restriction sequence, as compared to the N2-dG-IQ adduct located at position G3 of the NarI restriction sequence. (A) The N2-dG-IQ adduct at position G1. Stacking of base pair C3:G22 above base pair X4:C21, with IQ shown in magenta. (B) The N2-dG-IQ adduct at position G1. Stacking of base pair X4:C21 above base pair G5:C20. (C) The N2-dG-IQ adduct at position G3. Stacking of base pair C6:G19 above base pair X7:C18, with IQ shown in magenta. (D) The N2-dG-IQ adduct at position G3. Stacking of base pair X7:C18 above base pair C8:G17, with IQ shown in magenta.
Discussion
IQ1−5 is a genotoxic HCA food mutagen that is metabolized to an electrophilic nitrenium ion that alkylates guanines in DNA, forming both C8-dG-IQ and N2-dG-IQ adducts.26 It may play a significant role in cancer etiology.18,19 Polymerase bypass studies conducted in vitro have revealed that the consequences of replication past the N2-dG-IQ adduct differ when the lesion was incorporated63,72 at position G1 vs G3 of the NarI restriction endonuclease sequence, 5′-d(G1G2CG3CC)-3′.66−71 Two-base deletions were produced by hpol η when the N2-dG-IQ adduct was located at the G3 position, but when this lesion was located at the G1 position, error-free incorporation of dCTP occurred but further replication stalled.72 Moreover, in bacteria, the genotoxicity of a number of aryl amine adducts depends upon the relative placement of these lesions, either at the nonreiterated G1 position or the reiterated G3 position within the NarI sequence.66−71 Consequently, the structural consequences of placing the N2-dG-IQ adduct51−53 at the G1 vs G3 position of the NarI restriction sequence were of interest.
Base-Displaced Intercalated Conformation of the N2-dG-IQ Adduct at Position G1 in the NarI Sequence
The present studies indicate that when the N2-dG-IQ adduct is placed at the nonreiterated G1 position in the NarI restriction site it adopts a base-displaced intercalated conformation, in which modified base X4 remains in the anti conformation with respect to the gycosidic torsion angle χ and the IQ heterocyclic ring intercalates and displaces the complementary base, C21, into the major groove (Figure 9). The anti conformation of modified base X4 is supported by the NOE between the X4 H8 and X4 H1′ protons (Figure 2), which is of similar intensity as those of the other purine H8 to H1′ NOEs. The positioning of the IQ aryl ring is defined by NOEs between the IQ adduct and DNA (Figure 5). The IQ CH3 and H4a protons exhibit NOEs to X4 and G5 H1′, indicating that this portion of the IQ aryl ring faces the modified strand. NOEs between the IQ H7a, H8a, and H9a quinoline protons indicate that this portion of the aryl ring faces the complementary strand (Table 1). The intercalated IQ aryl ring stacks with the flanking base pairs C3:G22 and G5:C20 (Figure 10). The intercalation of the IQ moiety places the edge of the aryl ring containing the CH3, H4a, H7a, H8a, and H9a faces into the minor groove. The chemical shifts of the H4a, H7a, H8a, and H9a IQ proton resonances range from 6.9–8.6 ppm (Table S3, Supporting Information). These values, 0.5–0.9 ppm upfield from their spectral positions in the corresponding N2-dG-IQ nucleoside, indicate a shielding effect from the duplex. Likewise, the IQ CH3 resonances shift upfield 0.4 ppm as compared to the N2-dG-IQ nucleoside. In the refined structure, the CH3 group faces into the minor groove, which may be consistent with the somewhat smaller upfield shift of the CH3 resonance as compared to that of the H4a, H7a, H8a, and H9a IQ proton resonances. At the 3′-neighbor base pair G5:C20, the upfield shift of C20 H6 resonance (Figure 6) is likely due to stacking in the presence of the IQ aryl ring. In contrast, the downfield chemical shift change of 1.3 ppm for the C21 H6 resonance relative to C21 in the unmodified duplex reflects the displacement of C21 into the major groove. The downfield chemical shifts observed for the 5′-flanking base C3 H6, X4 H8, and 3′-flanking base G5 H8 resonances (Figure 6) are difficult to interpret but presumably reflect the changes in shielding due to the base-displaced intercalated conformation of the N2-dG-IQ adduct as compared to the normal Watson–Crick base pairing environment. At the lesion site, the X4 N1H imino proton resonance is observed (Figure 3), indicating that its exchange with water is slow. Significantly, when the N2-dG-IQ adduct was positioned at X7 (G3 in the NarI sequence), the X7 N1H imino proton resonance was also observed in spectra.64 The sharp resonance at 9.5 ppm was assigned to the X4N2H amino proton (Figure 3). This resonance remained sharp to a temperature of 55 °C, when most of the duplex is melted, suggesting that a stabilizing effect comes from an intrastrand interaction.
Despite the rather substantial conformational perturbation introduced into the duplex by the N2-dG-IQ adduct (Figure 9), the thermal melting temperature is 62 °C, as compared to 63 °C for the unmodified sequence. The minimal effect of the N2-dG-IQ adduct upon the thermal stability of the duplex is attributed to favorable stacking interactions with bases C20 and G22, as shown in Figure 10, which evidently compensate for the loss of Watson–Crick hydrogen bonding at the modified base pair. Similar effects have been observed for N6-dA adducts arising from alkylation by fjord-region dibenzo[a,l]pyrene diol epoxides, demonstrating the importance of base stacking to duplex stability.98−100
Similar Conformations of the N2-dG-IQ Adduct at Both Positions G1 and G3 of the NarI Restriction Site Sequence
Previously, the conformation of the N2-dG-IQ adduct at the mutagenic hotspot, G3, in the 5′-d(G1G2CG3CC)-3′66−71NarI recognition sequence was determined.64 The conformations of the N2-dG-IQ adduct at these two positions in the NarI sequence are similar, as can be observed in the stacking interactions shown in Figure 10. The CD spectra (Figure 1) confirm that the conformations of the N2-dG-IQ adducts are similar when placed either at the G1 or G3 position of the NarI sequence. Both modified sequences have a decrease in absorbance at the maximum wavelength (270 nm). The change in absorbance at this wavelength is likely related to DNA structure, particularly the average rotation between base pairs.101 Therefore, the change in absorbance could correspond to an increase in the degrees per base pair of the duplex, but other secondary structures likely contribute to this change as well. A lack of a visible signal in both sequence contexts between 300 and 360 nm, where the IQ-induced signal should occur, could support that the conformation of the modified base adopts a similar conformation in both sequences, but this is inconclusive since the lack of signal could also be due to a reduction in the IQ chromophore from the linkage at dGuo N2 to the IQ ring. When placed at the G2 position in the NarI sequence, the C8-AF-dG adduct exhibited a negative CD signal in the 300–360 nm range, which was assigned to the groove-bound conformation. In contrast, when placed at the G1 or G3 position of the NarI sequence, a positive signal was observed for the C8-AF-dG adduct in the 300–360 nm range, which was assigned to the base-displaced intercalated conformation.102
There are subtle differences between the conformations of the N2-dG-IQ adduct located at the G1 vs G3 position (Figure 10). This is perhaps due to the different nearest-neighbor sequence contexts for the two sites, 5′-C3X4G5C6′-3′ vs 5′-C6X7C8C9-3′, which differ in the 3′-flanking sequences. The modulation of both nucleotide excision repair and polymerase bypass of C8-dG arylamine adducts as a function of 3′-flanking sequence, attributed to differential conformational effects, including the orientation of base stacking, has been noted by Jain et al.73−75 In the present instance, the G1N2-dG-IQ adduct maintained planarity with the X4 guanine base (Figure 9), but for the G3N2-dG-IQ adduct, the IQ aryl ring was inserted at a 15° angle relative to the X7 guanine base. In the G1 sequence context (Figure 9), C21 rotated 20° further out of the duplex than did C18 in the G3 sequence context. A similar effect on the helical twist between the 5′-neighbor base to the modified base was observed, which was reduced by 30°. However, the G1N2-dG-IQ adduct showed greater unwinding of the duplex from the modified base to the 3′-neighbor, with an increase of 15° compared to the 9° increase for G3 duplex. The blue shifts in the CD data correspond to adduct-induced twisting and/or bending for both duplexes (Figure 1). The chemical shifts of the IQ H7a and H9a protons in the G1 vs G3 sequence contexts are 0.45 and 0.3 ppm further downfield, respectively, for the G1 position, whereas all of the other IQ ring protons differed by less than 0.1 ppm. The localized unwinding of the duplex for the N2-dG-IQ adduct positioned at the G1 site could be sufficient to alter base stacking orientations with the IQ heterocyclic ring and account for the chemical shift differences of these protons, although these small conformational changes are not reflected in the respective Tm values of the duplexes.
Structure–Activity Relationships
The ultimate carcinogen produced by IQ metabolism is a nitrenium ion (Scheme 1), which alkylates DNA. The N2-dG-IQ adduct is the minor alkylaton product,51−53 with the C8-dG-IQ adduct being the major product (Scheme 1). Nevertheless, in rat tissues, the N2-dG-IQ adduct is more persistent than is the C8-dG-IQ adduct59 and is anticipated to contribute more toward the genotoxic properties of IQ.103 The relative thermal stability of the N2-dG-IQ adduct as compared to the corresponding unmodified duplex was also noted when the lesion was placed at G3 of the NarI sequence.64 The minimal effects of the N2-dG-IQ adducts upon the Tm values of the duplexes may help to explain the relative persistence of this adduct in rat tissues.59
If it is not repaired, the N2-dG-IQ adduct is mutagenic. Choi et al.72 placed the N2-dG-IQ adduct at either the G1 or G3 site of the NarI sequence, in which the G3 site is a hot spot for frameshift mutations in bacteria with the model arylamine derivative 2-acetylaminofluorene but G1 is not.67−69,71 Choi et al.72 showed that primer extension by hpol η beyond template N2-dG-IQ adducts was more efficient than that for hpol κ and much better than that for pol ι or δ. In single-base incorporation studies, hpol η correctly inserted dCTP and incorrectly inserted dATP, hpol ι incorrectly inserted dTTP, and hpol κ incorrectly inserted dGTP. Steady-state kinetic parameters were measured for these dNTPs opposite the N2-dG-IQ adducts at both sites, being most favorable for hpol η. Mass spectrometric analyses of extension products arising from hpol η bypass revealed that a −2 deletion occurred for the N2-dG-IQ adduct at the G3 position. With the G1N2-dG-IQ adduct, dCTP was correctly inserted, but further extension then stalled. Thus, hpol η products yielded frameshifts with the N2-dG-IQ at the G3 position but not at the G1 position of the NarI sequence.72 The present studies, revealing that the base-displaced intercalated conformations of the N2-dG-IQ adducts are similar at both the G1 and G3 positions of the NarI sequence (Figure 10), do not readily explain the difference in bypass by hpol η at the two sites. It seems likely that the ability of the N2-dG-IQ adduct to induce −2 base deletions at the G3 site but not at the G1 site must instead be determined by sequence-specific differences in the chemistry and structural biology of lesion bypass in the presence of hpol η, e.g., differences in abilities to form or to process slipped frameshift intermediates during lesion bypass, as has been proposed by Jain et al.75,102 Again, the identities of the 3′-flanking sequences may be of importance in the stabilization of such enzyme-bound frameshift intermediates.73−75 Studies to examine the details of specific interactions between the N2-dG-IQ adduct at either the G1 vs G3 position, in the presence of pol η, will thus be of interest.
Summary
N2-dG-IQ assumes a base-displaced intercalated conformation when placed site specifically at the G1 position in the NarI restriction endonuclease sequence. The overall conformation is similar to that for the same adduct placed at the G3 position. Consequently, we conclude that in the NarI 5′-d(CG1G2CG3CC)-3′ restriction site the conformation of the N2-dG-IQ adduct does not strongly depend upon sequence, although there are subtle differences in the base-displaced intercalated conformations at the G1 vs G3 position, which may be related to differences in the respective 3′-flanking sequences.73−75 Moreover, at both positions G1 and G3, the N2-dG-IQ adduct does not significantly reduce the Tm of the duplex,64 which correlates with the observation that the N2-dG-IQ adduct is less efficiently repaired in rat tissues59 as compared to that for the C8-dG-IQ adduct, which does reduce the Tm of the duplex. This differs from the C8-dG-IQ adduct, the conformation of which is sensitive to sequence context in the NarI restriction site. Nevertheless, the N2-dG-IQ adduct is differentially processed by hpol η when placed at the G1 vs G3 position,72 suggesting that replication bypass by hpol η may involve sequence-specific differences in the ability to form the enzyme-bound transient strand slippage intermediates that are associated with frameshift mutations.
Glossary
Abbreviations
- AAF
N-2-acetylaminofluorene
- AF
2-aminofluorene
- B[a]P
benzo[a]pyrene
- CD
circular dichroism
- COSY
correlation spectroscopy
- HCA
hetercyclic amine
- HPLC
high-performance liquid chromatography
- IQ
2-amino-3-methylimidazo[4,5-f]quinoline
- MALDI-TOF
matrix-assisted laser desorption time-of-flight mass spectrometry
- NOESY
nuclear Overhauser effect spectroscopy
- rMD
restrained molecular dynamics
- PAH
polycyclic aromatic hydrocarbon
- Tm
temperature at which the duplex DNA:single strand DNA is 1:1
Supporting Information Available
Tables S1: Comparative thermal melting temperatures (Tm) of IQ-, AF-, and AAF-modified oligodeoxynucleotides. Table S2: Chemical shift assignments (ppm) for the nonexchangeable DNA protons of the N2-dG-IQ modified duplex at the G1 position of the NarI sequence. Table S3: Chemical shift assignments (ppm) for the exchangeable DNA protons of the N2-dG-IQ modified duplex at the G1 position of the NarI sequence. Table S4: Chemical shift assignments for the IQ protons of the N2-dG-IQ modified duplex at the G1 position of the NarI sequence. The Supporting Information is available free of charge on the ACS Publications website at DOI: 10.1021/acs.chemrestox.5b00140.
Accession Codes
The structural coordinates were deposited in the Protein Data Bank (www.rcsb.org): the PDB ID code for the N2-dG-IQ duplex is 2N0Q.
This work was supported by the National Institutes of Health [R01 CA55678 to M.P.S., R01 ES016561 to C.J.R., Center Grants P30 ES000267 and P30 CA068485, and instrumentation grants S10 RR05805, S10 RR025677, and National Science Foundation instrumentation grant DBI 0922862, the latter of which was funded by the American Recovery and Reinvestment Act of 2009 (Public Law 111-5)]. Vanderbilt University assisted with the purchase of NMR instrumentation. K.M.S. and E.K.H. acknowledge support from National Institutes of Health training grant T32 ES007028. Funding for open access charge: National Institutes of Health.
The authors declare no competing financial interest.
Author Status
‡ Edward K. Hawkins is deceased.
Supplementary Material
References
- Wakabayashi K.; Nagao M.; Esumi H.; Sugimura T. (1992) Food-derived mutagens and carcinogens. Cancer Res. 52, 2092s–2098s. [PubMed] [Google Scholar]
- Layton D. W.; Bogen K. T.; Knize M. G.; Hatch F. T.; Johnson V. M.; Felton J. S. (1995) Cancer risk of heterocyclic amines in cooked foods: an analysis and implications for research. Carcinogenesis 16, 39–52. [DOI] [PubMed] [Google Scholar]
- Sugimura T. (1997) Overview of carcinogenic heterocyclic amines. Mutat. Res. 376, 211–219. [DOI] [PubMed] [Google Scholar]
- Sugimura T.; Wakabayashi K.; Nakagama H.; Nagao M. (2004) Heterocyclic amines: mutagens/carcinogens produced during cooking of meat and fish. Cancer Sci. 95, 290–299. [DOI] [PMC free article] [PubMed] [Google Scholar]
- Turesky R. J.; Le Marchand L. (2011) Metabolism and biomarkers of heterocyclic aromatic amines in molecular epidemiology studies: lessons learned from aromatic amines. Chem. Res. Toxicol. 24, 1169–1214. [DOI] [PMC free article] [PubMed] [Google Scholar]
- Kataoka H.; Nishioka S.; Kobayashi M.; Hanaoka T.; Tsugane S. (2002) Analysis of mutagenic heterocyclic amines in cooked food samples by gas chromatography with nitrogen-phosphorus detector. Bull. Environ. Contam. Toxicol. 69, 682–689. [DOI] [PubMed] [Google Scholar]
- Felton J. S.; Knize M. G.; Salmon C. P.; Malfatti M. A.; Kulp K. S. (2002) Human exposure to heterocyclic amine food mutagens/carcinogens: relevance to breast cancer. Environ. Mol. Mutagen. 39, 112–118. [DOI] [PubMed] [Google Scholar]
- Yamashita M.; Wakabayashi K.; Nagao M.; Sato S.; Yamaizumi Z.; Takahashi M.; Kinae N.; Tomita I.; Sugimura T. (1986) Detection of 2-amino-3-methylimidazo[4,5-f]quinoline in cigarette smoke condensate. Jpn. J. Cancer Res. 77, 419–422. [PubMed] [Google Scholar]
- Ohgaki H.; Hasegawa H.; Kato T.; Suenaga M.; Ubukata M.; Sato S.; Takayama S.; Sugimura T. (1986) Carcinogenicity in mice and rats of heterocyclic amines in cooked foods. Environ. Health Perspect. 67, 129–134. [DOI] [PMC free article] [PubMed] [Google Scholar]
- Adamson R. H.; Thorgeirsson U. P.; Snyderwine E. G.; Thorgeirsson S. S.; Reeves J.; Dalgard D. W.; Takayama S.; Sugimura T. (1990) Carcinogenicity of 2-amino-3-methylimidazo[4,5-f]quinoline in nonhuman primates: Induction of tumors in three macaques. Jpn. J. Cancer Res. 81, 10–14. [DOI] [PMC free article] [PubMed] [Google Scholar]
- Heflich R. H.; Neft R. E. (1994) Genetic toxicity of 2-acetylaminofluorene, 2-aminofluorene and some of their metabolites and model metabolites. Mutat. Res. 318, 73–114. [DOI] [PubMed] [Google Scholar]
- Thorgeirsson U. P.; Snyderwine E. G.; Gomez D. E.; Adamson R. H. (1996) Dietary heterocyclic amines as potential human carcinogens: experimental data from nonhuman primates. In Vivo 10, 145–152. [PubMed] [Google Scholar]
- Ohgaki H.; Kusama K.; Matsukura N.; Morino K.; Hasegawa H.; Sato S.; Takayama S.; Sugimura T. (1984) Carcinogenicity in mice of a mutagenic compound, 2-amino-3-methylimidazo[4,5-f]quinoline, from broiled sardine, cooked beef and beef extract. Carcinogenesis 5, 921–924. [DOI] [PubMed] [Google Scholar]
- Takayama S.; Nakatsuru Y.; Masuda M.; Ohgaki H.; Sato S.; Sugimura T. (1984) Demonstration of carcinogenicity in F344 rats of 2-amino-3-methyl-imidazo[4,5-f]quinoline from broiled sardine, fried beef and beef extract. Gann 75, 467–470. [PubMed] [Google Scholar]
- Tanaka T.; Barnes W. S.; Williams G. M.; Weisburger J. H. (1985) Multipotential carcinogenicity of the fried food mutagen 2-amino-3-methylimidazo[4,5-f]quinoline in rats. Jpn. J. Cancer Res. 76, 570–576. [PubMed] [Google Scholar]
- Sugimura T., Nagao M., and Wakabayashi K. (2000) in Complex Factors Pertinent to Human Hazard and Risk, pp 349–359, Wiley, New York. [Google Scholar]
- Kobayashi M.; Hanaoka T.; Nishioka S.; Kataoka H.; Tsugane S. (2002) Estimation of dietary HCA intakes in a large-scale population-based prospective study in Japan. Mutat. Res. 506–507, 233–241. [DOI] [PubMed] [Google Scholar]
- (1993) IARC Monographs on the Evaluation of Carcinogenic Risks to Humans, Vol. 56, International Agency for Research on Cancer, Lyon, France. [Google Scholar]
- (2005) Report on Carcinogenesis, 11th ed., National Toxicology Program, Research Triangle Park, NC.
- Anderson K. E.; Hammons G. J.; Kadlubar F. F.; Potter J. D.; Kaderlik K. R.; Ilett K. F.; Minchin R. F.; Teitel C. H.; Chou H. C.; Martin M. V.; Guengerich F. P.; Barone G. W.; Lang N. P.; Peterson L. A. (1997) Metabolic activation of aromatic amines by human pancreas. Carcinogenesis 18, 1085–1092. [DOI] [PubMed] [Google Scholar]
- Lang N. P.; Butler M. A.; Massengill J.; Lawson M.; Stotts R. C.; Hauer-Jensen M.; Kadlubar F. F. (1994) Rapid metabolic phenotypes for acetyltransferase and cytochrome P4501A2 and putative exposure to food-borne heterocyclic amines increase the risk for colorectal cancer or polyps. Cancer Epidemiol., Biomarkers Prev. 3, 675–682. [PubMed] [Google Scholar]
- Shirai T.; Sano M.; Tamano S.; Takahashi S.; Hirose M.; Futakuchi M.; Hasegawa R.; Imaida K.; Matsumoto K.; Wakabayashi K.; Sugimura T.; Ito N. (1997) The prostate: A target for carcinogenicity of 2-amino-1-methyl-6-phenylimidazo[4,5-b]pyridine (PhIP) derived from cooked foods. Cancer Res. 57, 195–198. [PubMed] [Google Scholar]
- Snyderwine E. G. (1994) Some perspectives on the nutritional aspects of breast cancer research. Food-derived heterocyclic amines as etiologic agents in human mammary cancer. Cancer 74, 1070–1077. [DOI] [PubMed] [Google Scholar]
- Ronco A.; De Stefani E.; Mendilaharsu M.; Deneo-Pellegrini H. (1996) Meat, fat and risk of breast cancer: a case-control study from Uruguay. Int. J. Cancer 65, 328–331. [DOI] [PubMed] [Google Scholar]
- Ushiyama H.; Wakabayashi K.; Hirose M.; Itoh H.; Sugimura T.; Nagao M. (1991) Presence of carcinogenic heterocyclic amines in urine of healthy volunteers eating normal diet, but not of inpatients receiving parenteral alimentation. Carcinogenesis 12, 1417–1422. [DOI] [PubMed] [Google Scholar]
- Sugimura T.; Sato S. (1983) Mutagens-carcinogens in foods. Cancer Res. 43, 2415s–2421s. [PubMed] [Google Scholar]
- Nagao M. (2000). In Food-Borne Carcinogens: Heterocyclic Amines (Nagao M., and Sugimura T., Eds.) pp 31–71, Wiley, New York. [Google Scholar]
- Hecht S. S. (2002) Tobacco smoke carcinogens and breast cancer. Environ. Mol. Mutagen. 39, 119–126. [DOI] [PubMed] [Google Scholar]
- Kosakarn P.; Halliday J. A.; Glickman B. W.; Josephy P. D. (1993) Mutational specificity of 2-nitro-3,4-dimethylimidazo[4,5-f]quinoline in the lacI gene of Escherichia coli. Carcinogenesis 14, 511–517. [DOI] [PubMed] [Google Scholar]
- Watanabe M.; Ohta T. (1993) Analysis of mutational specificity induced by heterocyclic amines in the lacZ gene of Escherichia coli. Carcinogenesis 14, 1149–1153. [DOI] [PubMed] [Google Scholar]
- Terada M.; Nagao M.; Nakayasu M.; Sakamoto H.; Nakasato F.; Sugimura T. (1986) Mutagenic activities of heterocyclic amines in Chinese hamster lung cells in culture. Environ. Health Perspect. 67, 117–119. [DOI] [PMC free article] [PubMed] [Google Scholar]
- Thompson L. H.; Tucker J. D.; Stewart S. A.; Christensen M. L.; Salazar E. P.; Carrano A. V.; Felton J. S. (1987) Genotoxicity of compounds from cooked beef in repair-deficient CHO cells versus Salmonella mutagenicity. Mutagenesis 2, 483–487. [DOI] [PubMed] [Google Scholar]
- Felton J. S.; Fultz E.; Dolbeare F. A.; Knize M. G. (1994) Effect of microwave pretreatment on heterocyclic aromatic amine mutagens/carcinogens in fried beef patties. Food Chem. Toxicol. 32, 897–903. [DOI] [PubMed] [Google Scholar]
- Schut H. A.; Snyderwine E. G. (1999) DNA adducts of heterocyclic amine food mutagens: implications for mutagenesis and carcinogenesis. Carcinogenesis 20, 353–368. [DOI] [PubMed] [Google Scholar]
- Turesky R. J. (2002) Heterocyclic aromatic amine metabolism, DNA adduct formation, mutagenesis, and carcinogenesis. Drug Metab. Rev. 34, 625–650. [DOI] [PubMed] [Google Scholar]
- Thompson L. H.; Carrano A. V.; Salazar E.; Felton J. S.; Hatch F. T. (1983) Comparative genotoxic effects of the cooked-food-related mutagens Trp-P-2 and IQ in bacteria and cultured mammalian cells. Mutat. Res. 117, 243–257. [DOI] [PubMed] [Google Scholar]
- Aeschbacher H. U.; Ruch E. (1989) Effect of heterocyclic amines and beef extract on chromosome aberrations and sister chromatid exchanges in cultured human lymphocytes. Carcinogenesis 10, 429–433. [DOI] [PubMed] [Google Scholar]
- Tohda H.; Oikawa A.; Kawachi T.; Sugimura T. (1980) Induction of sister-chromatid exchanges by mutagens from amino acid and protein pyrolysates. Mutat. Res. 77, 65–69. [DOI] [PubMed] [Google Scholar]
- Yamazoe Y.; Shimada M.; Kamataki T.; Kato R. (1983) Microsomal activation of 2-amino-3-methylimidazo[4,5-f]quinoline, a pyrolysate of sardine and beef extracts, to a mutagenic intermediate. Cancer Res. 43, 5768–5774. [PubMed] [Google Scholar]
- Boobis A. R.; Lynch A. M.; Murray S.; de la Torre R.; Solans A.; Farre M.; Segura J.; Gooderham N. J.; Davies D. S. (1994) CYP1A2-catalyzed conversion of dietary heterocyclic amines to their proximate carcinogens is their major route of metabolism in humans. Cancer Res. 54, 89–94. [PubMed] [Google Scholar]
- Shimada T.; Hayes C. L.; Yamazaki H.; Amin S.; Hecht S. S.; Guengerich F. P.; Sutter T. R. (1996) Activation of chemically diverse procarcinogens by human cytochrome P-450 1B1. Cancer Res. 56, 2979–2984. [PubMed] [Google Scholar]
- Hammons G. J.; Milton D.; Stepps K.; Guengerich F. P.; Tukey R. H.; Kadlubar F. F. (1997) Metabolism of carcinogenic heterocyclic and aromatic amines by recombinant human cytochrome P450 enzymes. Carcinogenesis 18, 851–854. [DOI] [PubMed] [Google Scholar]
- Turesky R. J.; Constable A.; Richoz J.; Varga N.; Markovic J.; Martin M. V.; Guengerich F. P. (1998) Activation of heterocyclic aromatic amines by rat and human liver microsomes and by purified rat and human cytochrome P450 1A2. Chem. Res. Toxicol. 11, 925–936. [DOI] [PubMed] [Google Scholar]
- Guengerich F. P. (2002) N-hydroxyarylamines. Drug Metab. Rev. 34, 607–623. [DOI] [PubMed] [Google Scholar]
- Minchin R. F.; Reeves P. T.; Teitel C. H.; McManus M. E.; Mojarrabi B.; Ilett K. F.; Kadlubar F. F. (1992) N-and O-acetylation of aromatic and heterocyclic amine carcinogens by human monomorphic and polymorphic acetyltransferases expressed in COS-1 cells. Biochem. Biophys. Res. Commun. 185, 839–844. [DOI] [PubMed] [Google Scholar]
- Hein D. W.; Doll M. A.; Rustan T. D.; Gray K.; Feng Y.; Ferguson R. J.; Grant D. M. (1993) Metabolic activation and deactivation of arylamine carcinogens by recombinant human NAT1 and polymorphic NAT2 acetyltransferases. Carcinogenesis 14, 1633–1638. [DOI] [PubMed] [Google Scholar]
- Hickman D.; Pope J.; Patil S. D.; Fakis G.; Smelt V.; Stanley L. A.; Payton M.; Unadkat J. D.; Sim E. (1998) Expression of arylamine N-acetyltransferase in human intestine. Gut 42, 402–409. [DOI] [PMC free article] [PubMed] [Google Scholar]
- Le Marchand L.; Hankin J. H.; Pierce L. M.; Sinha R.; Nerurkar P. V.; Franke A. A.; Wilkens L. R.; Kolonel L. N.; Donlon T.; Seifried A.; Custer L. J.; Lum-Jones A.; Chang W. (2002) Well-done red meat, metabolic phenotypes and colorectal cancer in Hawaii. Mutat. Res. 506–507, 205–214. [DOI] [PubMed] [Google Scholar]
- Ishibe N.; Sinha R.; Hein D. W.; Kulldorff M.; Strickland P.; Fretland A. J.; Chow W. H.; Kadlubar F. F.; Lang N. P.; Rothman N. (2002) Genetic polymorphisms in heterocyclic amine metabolism and risk of colorectal adenomas. Pharmacogenetics 12, 145–150. [DOI] [PubMed] [Google Scholar]
- Metry K. J.; Neale J. R.; Doll M. A.; Howarth A. L.; States J. C.; McGregor W. G.; Pierce W. M. Jr.; Hein D. W. (2010) Effect of rapid human N-acetyltransferase 2 haplotype on DNA damage and mutagenesis induced by 2-amino-3-methylimidazo-[4,5-f]quinoline (IQ) and 2-amino-3,8-dimethylimidazo-[4,5-f]quinoxaline (MeIQx). Mutat. Res. 684, 66–73. [DOI] [PMC free article] [PubMed] [Google Scholar]
- Snyderwine E. G.; Roller P. P.; Adamson R. H.; Sato S.; Thorgeirsson S. S. (1988) Reaction of N-hydroxylamine and N-acetoxy derivatives of 2-amino-3-methylimidazolo[4,5-f]quinoline with DNA. Synthesis and identification of N-(deoxyguanosin-8-yl)-IQ. Carcinogenesis 9, 1061–1065. [DOI] [PubMed] [Google Scholar]
- Nagaoka H.; Wakabayashi K.; Kim S. B.; Kim I. S.; Tanaka Y.; Ochiai M.; Tada A.; Nukaya H.; Sugimura T.; Nagao M. (1992) Adduct formation at C-8 of guanine on in vitro reaction of the ultimate form of 2-amino-1-methyl-6-phenylimidazo[4,5-b]pyridine with 2′-deoxyguanosine and its phosphate esters. Jpn. J. Cancer Res. 83, 1025–1029. [DOI] [PMC free article] [PubMed] [Google Scholar]
- Turesky R. J.; Rossi S. C.; Welti D. H.; Lay J. O. Jr.; Kadlubar F. F. (1992) Characterization of DNA adducts formed in vitro by reaction of N-hydroxy-2-amino-3-methylimidazo[4,5-f]quinoline and N-hydroxy-2-amino-3,8-dimethylimidazo[4,5-f]quinoxaline at the C-8 and N2 atoms of guanine. Chem. Res. Toxicol. 5, 479–490. [DOI] [PubMed] [Google Scholar]
- Zenser T. V.; Lakshmi V. M.; Schut H. A.; Zhou H. J.; Josephy P. (2009) Activation of aminoimidazole carcinogens by nitrosation: mutagenicity and nucleotide adducts. Mutat. Res. 673, 109–115. [DOI] [PMC free article] [PubMed] [Google Scholar]
- Murata M.; Kawanishi S. (2011) Mechanisms of oxidative DNA damage induced by carcinogenic arylamines. Front. Biosci., Landmark Ed. 16, 1132–1143. [DOI] [PubMed] [Google Scholar]
- Gangl E. T.; Turesky R. J.; Vouros P. (2001) Detection of in vivo formed DNA adducts at the part-per-billion level by capillary liquid chromatography/microelectrospray mass spectrometry. Anal. Chem. 73, 2397–2404. [DOI] [PubMed] [Google Scholar]
- Soglia J. R.; Turesky R. J.; Paehler A.; Vouros P. (2001) Quantification of the heterocyclic aromatic amine DNA adduct N-(deoxyguanosin-8-yl)-2-amino-3-methylimidazo[4,5-f]quinoline in livers of rats using capillary liquid chromatography/microelectrospray mass spectrometry: a dose–response study. Anal. Chem. 73, 2819–2827. [DOI] [PubMed] [Google Scholar]
- Nauwelaers G.; Bessette E. E.; Gu D.; Tang Y.; Rageul J.; Fessard V.; Yuan J. M.; Yu M. C.; Langouet S.; Turesky R. J. (2011) DNA adduct formation of 4-aminobiphenyl and heterocyclic aromatic amines in human hepatocytes. Chem. Res. Toxicol. 24, 913–925. [DOI] [PMC free article] [PubMed] [Google Scholar]
- Turesky R. J.; Markovic J.; Aeschlimann J. M. (1996) Formation and differential removal of C-8 and N2-guanine adducts of the food carcinogen 2-amino-3-methylimidazo[4,5-f]quinoline in the liver, kidney, and colorectum of the rat. Chem. Res. Toxicol. 9, 397–402. [DOI] [PubMed] [Google Scholar]
- Wang Z.; Rizzo C. J. (2001) Synthesis of the C8-deoxyguanosine adduct of the food mutagen IQ. Org. Lett. 3, 565–568. [DOI] [PubMed] [Google Scholar]
- Elmquist C. E.; Stover J. S.; Wang Z.; Rizzo C. J. (2004) Site-specific synthesis and properties of oligonucleotides containing C8-deoxyguanosine adducts of the dietary mutagen IQ. J. Am. Chem. Soc. 126, 11189–11201. [DOI] [PubMed] [Google Scholar]
- Stover J. S.; Rizzo C. J. (2004) Synthesis of the N2-deoxyguanosine adduct of the potent dietary mutagen IQ. Org. Lett. 6, 4985–4988. [DOI] [PubMed] [Google Scholar]
- Stover J. S.; Rizzo C. J. (2007) Synthesis of oligonucleotides containing the N2-deoxyguanosine adduct of the dietary carcinogen 2-amino-3-methylimidazo[4,5-f]quinoline. Chem. Res. Toxicol. 20, 1972–1979. [DOI] [PMC free article] [PubMed] [Google Scholar]
- Stavros K. M.; Hawkins E. K.; Rizzo C. J.; Stone M. P. (2014) Base-displaced intercalation of the 2-amino-3-methylimidazo[4,5-f]quinolone N2-dG adduct in the NarI DNA recognition sequence. Nucleic Acids Res. 42, 3450–3463. [DOI] [PMC free article] [PubMed] [Google Scholar]
- Wang F.; Demuro N. E.; Elmquist C. E.; Stover J. S.; Rizzo C. J.; Stone M. P. (2006) Base-displaced intercalated structure of the food mutagen 2-amino-3-methylimidazo[4,5-f]quinoline in the recognition sequence of the NarI restriction enzyme, a hottspot for −2 bp deletions. J. Am. Chem. Soc. 128, 10085–10095. [DOI] [PMC free article] [PubMed] [Google Scholar]
- Fuchs R. P.; Schwartz N.; Daune M. P. (1981) Hot spots of frameshift mutations induced by the ultimate carcinogen N-acetoxy-N-2-acetylaminofluorene. Nature 294, 657–659. [DOI] [PubMed] [Google Scholar]
- Koffel-Schwartz N.; Verdier J. M.; Bichara M.; Freund A. M.; Daune M. P.; Fuchs R. P. P. (1984) Carcinogen-induced mutation spectrum in wild-type, uvrA and umuC strains of Escherichia coli. J. Mol. Biol. 177, 33–51. [DOI] [PubMed] [Google Scholar]
- Koehl P.; Burnouf D.; Fuchs R. P. P. (1989) Construction of plasmids containing a unique acetylaminofluorene adduct located within a mutation hot spot. A new probe for frameshift mutagenesis. J. Mol. Biol. 207, 355–364. [DOI] [PubMed] [Google Scholar]
- Koehl P.; Valladier P.; Lefevre J. F.; Fuchs R. P. (1989) Strong structural effect of the position of a single acetylaminofluorene adduct within a mutation hot spot. Nucleic Acids Res. 17, 9531–9541. [DOI] [PMC free article] [PubMed] [Google Scholar]
- Hoffmann G. R.; Fuchs R. P. (1997) Mechanisms of frameshift mutations: insight from aromatic amines. Chem. Res. Toxicol. 10, 347–359. [DOI] [PubMed] [Google Scholar]
- Broschard T. H.; Koffel-Schwartz N.; Fuchs R. P. (1999) Sequence-dependent modulation of frameshift mutagenesis at NarI-derived mutation hot spots. J. Mol. Biol. 288, 191–199. [DOI] [PubMed] [Google Scholar]
- Choi J. Y.; Stover J. S.; Angel K. C.; Chowdhury G.; Rizzo C. J.; Guengerich F. P. (2006) Biochemical basis of genotoxicity of heterocyclic arylamine food mutagens: human DNA polymerase eta selectively produces a two-base deletion in copying the N2-guanyl adduct of 2-amino-3-methylimidazo[4,5-f]quinoline but not the C8 adduct at the NarI G3 site. J. Biol. Chem. 281, 25297–25306. [DOI] [PubMed] [Google Scholar]
- Jain V.; Hilton B.; Patnaik S.; Zou Y.; Chiarelli M. P.; Cho B. P. (2012) Conformational and thermodynamic properties modulate the nucleotide excision repair of 2-aminofluorene and 2-acetylaminofluorene dG adducts in the NarI sequence. Nucleic Acids Res. 40, 3939–3951. [DOI] [PMC free article] [PubMed] [Google Scholar]
- Jain V.; Hilton B.; Lin B.; Patnaik S.; Liang F.; Darian E.; Zou Y.; Mackerell A. D. Jr.; Cho B. P. (2013) Unusual sequence effects on nucleotide excision repair of arylamine lesions: DNA bending/distortion as a primary recognition factor. Nucleic Acids Res. 41, 869–880. [DOI] [PMC free article] [PubMed] [Google Scholar]
- Jain V.; Vaidyanathan V. G.; Patnaik S.; Gopal S.; Cho B. P. (2014) Conformational insights into the lesion and sequence effects for arylamine-induced translesion DNA synthesis: 19F NMR, surface plasmon resonance, and primer kinetic studies. Biochemistry 53, 4059–4071. [DOI] [PMC free article] [PubMed] [Google Scholar]
- Wang F.; Elmquist C. E.; Stover J. S.; Rizzo C. J.; Stone M. P. (2007) DNA sequence modulates the conformation of the food mutagen 2-amino-3-methylimidazo[4,5-f]quinoline in the recognition sequence of the NarI restriction enzyme. Biochemistry 46, 8498–8516. [DOI] [PMC free article] [PubMed] [Google Scholar]
- Bodenhausen G.; Wagner G.; Rance M.; Sorensen O. W.; Wuthrich K.; Ernst R. R. (1984) Longitudinal two-spin order in 2D exchange spectroscopy (NOESY). J. Magn. Reson. 59, 542–550. [Google Scholar]
- Piotto M.; Saudek V.; Sklenar V. (1992) Gradient-tailored excitation for single-quantum NMR spectroscopy of aqueous solutions. J. Biomol. NMR 6, 661–665. [DOI] [PubMed] [Google Scholar]
- Goddard T. D., and Kneller D. G. (2006) SPARKY, v. 3.113, University of California, San Francisco, CA.
- Keepers J. W.; James T. L. (1984) A theoretical study of distance determination from NMR. Two-dimensional nuclear Overhauser effect spectra. J. Magn. Reson. 57, 404–426. [Google Scholar]
- James T. L. (1991) Relaxation matrix analysis of two-dimensional nuclear Overhauser effect spectra. Curr. Opin. Struct. Biol. 1, 1042–1053. [Google Scholar]
- Borgias B. A.; James T. L. (1989) Two-dimensional nuclear Overhauser effect: complete relaxation matrix analysis. Methods Enzymol. 176, 169–183. [DOI] [PubMed] [Google Scholar]
- Borgias B. A.; James T. L. (1990) MARDIGRAS—a procedure for matrix analysis of relaxation for discerning geometry of an aqueous structure. J. Magn. Reson. 87, 475–487. [Google Scholar]
- Liu H.; Spielmann H. P.; Ulyanov N. B.; Wemmer D. E.; James T. L. (1995) Interproton distance bounds from 2D NOE intensities: Effect of experimental noise and peak integration errors. J. Biomol. NMR 6, 390–402. [DOI] [PubMed] [Google Scholar]
- Spielmann H. P.; Dwyer T. J.; Hearst J. E.; Wemmer D. E. (1995) Solution structures of psoralen monoadducted and cross-linked DNA oligomers by NMR spectroscopy and restrained molecular dynamics. Biochemistry 34, 12937–12953. [PubMed] [Google Scholar]
- Arnott S.; Hukins D. W. L. (1972) Optimised parameters for A-DNA and B-DNA. Biochem. Biophys. Res. Commun. 47, 1504–1509. [DOI] [PubMed] [Google Scholar]
- Frisch M. J., Trucks G. W., Schlegel H. B., Scuseria G. E., Robb M. A., Cheeseman J. R., Montgomery J. A., Vreven T., Kudin K. N., Burant J. C., Millam J. M., Iyengar S. S., Tomasi J., Barone V., Mennucci B., Cossi M., Scalmani G., Rega N., Petersson G. A., Nakatsuji H., Hada M., Ehara M., Toyota K., Fukuda R., Hasegawa J., Ishida M., Nakajima T., Honda Y., Kitao O., Nakai H., Klene M., Li X., Knox J. E., Hratchian H. P., Cross J. B., Adamo C., Jaramillo J., Gomperts R., Stratmann R. E., Yazyev O., Austin A. J., Cammi R., Pomelli C., Pomelli J., Ochterski W., Ayala P. Y., Morokuma K., Voth G. A., Salvador P., Dannenberg J. J., Zakrzewska V. G., Daniels A. D., Farkas O., Rabuck A. D., Raghavachari K., and Ortiz J. V. (2004) Gaussian 03, Gaussian, Inc., Wallingford, CT.
- Bashford D.; Case D. A. (2000) Generalized Born models of macromolecular solvation effects. Annu. Rev. Phys. Chem. 51, 129–152. [DOI] [PubMed] [Google Scholar]
- Tsui V.; Case D. A. (2000) Theory and applications of the generalized Born solvation model in macromolecular simulations. Biopolymers 56, 275–291. [DOI] [PubMed] [Google Scholar]
- Case D. A.; Cheatham T. E. III; Darden T.; Gohlke H.; Luo R.; Merz K. M. Jr.; Onufriev A.; Simmerling C.; Wang B.; Woods R. J. (2005) The AMBER biomolecular simulation programs. J. Comput. Chem. 26, 1668–1688. [DOI] [PMC free article] [PubMed] [Google Scholar]
- Wang J. M.; Cieplak P.; Kollman P. A. (2000) How well does a restrained electrostatic potential (RESP) model perform in calculating conformational energies of organic and biological molecules?. J. Comput. Chem. 21, 1049–1074. [Google Scholar]
- Kirkpatrick S.; Gelatt C. D. Jr.; Vecchi M. P. (1983) Optimization by simulated annealing. Science 220, 671–680. [DOI] [PubMed] [Google Scholar]
- Lavery R.; Moakher M.; Maddocks J. H.; Petkeviciute D.; Zakrzewska K. (2009) Conformational analysis of nucleic acids revisited: Curves+. Nucleic Acids Res. 37, 5917–5929. [DOI] [PMC free article] [PubMed] [Google Scholar]
- Blanchet C.; Pasi M.; Zakrzewska K.; Lavery R. (2011) CURVES+ web server for analyzing and visualizing the helical, backbone and groove parameters of nucleic acid structures. Nucleic Acids Res. 39, W68–73. [DOI] [PMC free article] [PubMed] [Google Scholar]
- Patel D. J.; Shapiro L.; Hare D. (1987) DNA and RNA: NMR studies of conformations and dynamics in solution. Q. Rev. Biophys. 20, 35–112. [DOI] [PubMed] [Google Scholar]
- Reid B. R. (1987) Sequence-specific assignments and their use in NMR studies of DNA structure. Q. Rev. Biophys. 20, 2–28. [DOI] [PubMed] [Google Scholar]
- Elmquist C. E.; Wang F.; Stover J. S.; Stone M. P.; Rizzo C. J. (2007) Conformational differences of the C8-deoxyguanosine adduct of 2-amino-3-methylimidazo[4,5-f]quinoline (IQ) within the NarI recognition sequence. Chem. Res. Toxicol. 20, 445–454. [DOI] [PMC free article] [PubMed] [Google Scholar]
- Ruan Q.; Kolbanovskiy A.; Zhuang P.; Chen J.; Krzeminski J.; Amin S.; Geacintov N. E. (2002) Synthesis and characterization of site-specific and stereoisomeric fjord dibenzo[a,l]pyrene diol epoxide-N6-adenine adducts: unusual thermal stabilization of modified DNA duplexes. Chem. Res. Toxicol. 15, 249–261. [DOI] [PubMed] [Google Scholar]
- Reeves D. A.; Mu H.; Kropachev K.; Cai Y.; Ding S.; Kolbanovskiy A.; Kolbanovskiy M.; Chen Y.; Krzeminski J.; Amin S.; Patel D. J.; Broyde S.; Geacintov N. E. (2011) Resistance of bulky DNA lesions to nucleotide excision repair can result from extensive aromatic lesion-base stacking interactions. Nucleic Acids Res. 39, 8752–8764. [DOI] [PMC free article] [PubMed] [Google Scholar]
- Kropachev K.; Kolbanovskiy M.; Liu Z.; Cai Y.; Zhang L.; Schwaid A. G.; Kolbanovskiy A.; Ding S.; Amin S.; Broyde S.; Geacintov N. E. (2013) Adenine-DNA adducts derived from the highly tumorigenic dibenzo[a,l]pyrene are resistant to nucleotide excision repair while guanine adducts are not. Chem. Res. Toxicol. 26, 783–793. [DOI] [PMC free article] [PubMed] [Google Scholar]
- Baase W. A.; Johnson W. C. Jr. (1979) Circular dichroism and DNA secondary structure. Nucleic Acids Res. 6, 797–814. [DOI] [PMC free article] [PubMed] [Google Scholar]
- Jain N.; Li Y.; Zhang L.; Meneni S. R.; Cho B. P. (2007) Probing the sequence effects on NarI-induced −2 frameshift mutagenesis by dynamic 19F NMR, UV, and CD spectroscopy. Biochemistry 46, 13310–13321. [DOI] [PMC free article] [PubMed] [Google Scholar]
- Poirier M. C.; Beland F. A. (1992) DNA adduct measurements and tumor incidence during chronic carcinogen exposure in animal models: implications for DNA adduct-based human cancer risk assessment. Chem. Res. Toxicol. 5, 749–755. [DOI] [PubMed] [Google Scholar]
Associated Data
This section collects any data citations, data availability statements, or supplementary materials included in this article.