Abstract
Previous investigations have demonstrated a subset of postural tachycardia syndrome (POTS) patients characterized by normal peripheral resistance and blood volume while supine but thoracic hypovolemia and splanchnic blood pooling while upright secondary to splanchnic hyperemia. Such “normal-flow” POTS patients often demonstrate hypocapnia during orthostatic stress. We studied 20 POTS patients (14–23 yr of age) and compared them with 10 comparably aged healthy volunteers. We measured changes in heart rate, blood pressure, heart rate and blood pressure variability, arm and leg strain-gauge occlusion plethysmography, respiratory impedance plethysmography calibrated against pneumotachography, end-tidal partial pressure of carbon dioxide (PetCO2), and impedance plethysmographic indexes of blood volume and blood flow within the thoracic, splanchnic, pelvic (upper leg), and lower leg regional circulations while supine and during upright tilt to 70°. Ten POTS patients demonstrated significant hyperventilation and hypocapnia (POTSHC) while 10 were normocapnic with minimal increase in postural ventilation, comparable to control. While relative splanchnic hypervolemia and hyperemia occurred in both POTS groups compared with controls, marked enhancement in peripheral vasoconstriction occurred only in POTSHC and was related to thoracic blood flow. Variability indexes suggested enhanced sympathetic activation in POTSHC compared with other subjects. The data suggest enhanced cardiac and peripheral sympathetic excitation in POTSHC.
Keywords: vasoconstriction, hypocapnia, orthostatic intolerance
A modest increase in ventilation and decrease in end-tidal partial pressure of carbon dioxide (PetCO2) are normally observed during the transition from supine to upright position (2, 9). These findings are mainly attributed to a rise in tidal volume with somewhat smaller contributions arising from changes in the functional residual capacity and in the amount and distribution of cardiac output within the lungs (5). Usual reported changes in Pco2 range from a supine value of ~40 mmHg to an upright value of ~36 mmHg, which is similar to our general experience (28).
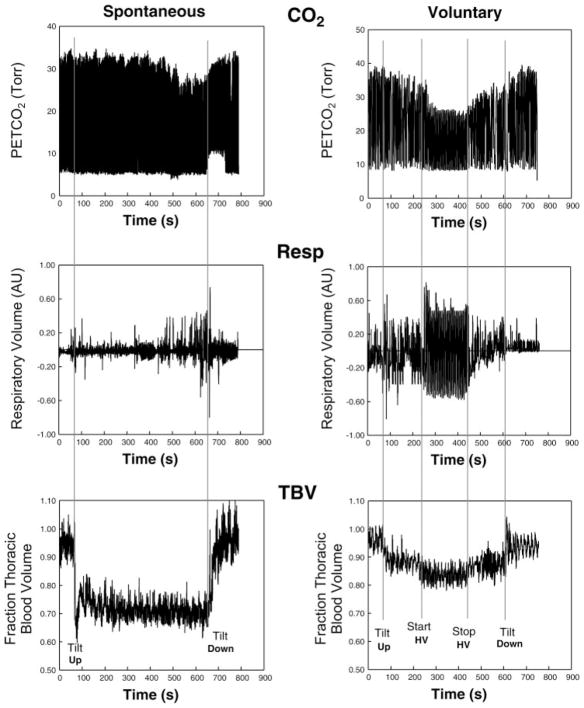
Much larger postural decrements in Pco2 below 30 mmHg and often reaching <25 mmHg have been reported in diverse forms of orthostatic intolerance where they are associated with an increase in ventilation (19, 22, 24) although this finding remains controversial (27). Such hypocapnia does not appear to be achieved through simple physical or physiological processes but rather requires some form of greatly activated central and peripheral chemoreflex function and operating set point (22). In particular, postural tachycardia syndrome (POTS) has been associated with hyperventilation and decreased PetCO2 that may occur in a majority of patients (22, 27, 36). Hypocapnia accounts for documented reduction of cerebral blood flow in these patients (22, 27, 36). Decreased cerebral blood flow may account for certain symptoms of orthostatic intolerance, including dizziness, headache, neurocognitive deficit, fatigue, visual loss, or impaired consciousness. Interestingly, voluntary hyperventilation fails to induce similar symptomatology (22). One possible explanation for the posturally related hyperventilation is that it might benefit venous return and thus thoracic blood volume and cardiac preload. However, this hypothesis remains unsubstantiated during voluntary or spontaneous hyperventilation (Fig. 1), in which reduced rather than increased thoracic blood volume has been found.
Fig. 1.
Spontaneous (left) and voluntary (right) hypocapnia brought about in a postural tachycardia syndrome (POTS) patient (left) and by voluntary hyperventilation (HV) in a healthy control subject (right), respectively. Voluntary hyperventilation was achieved by having the subject take a breath every 6 s and to breathe as deeply as possible. Such breathing was maintained for 3.5 min and stopped because of lightheadedness. End-tidal partial pressure of carbon dioxide (PetCO2), Respitrace volumes (Resp), and thoracic blood volumes (TBV) are shown from top to bottom. Upright tilt was associated with an increase in thoracic blood volume. Onset of hypocapnic hyperventilation was not related to an increase in thoracic blood volume.
Moreover, this hypothesis fails to explain the nature of the stimulus for hyperpnea. Other possibilities include a primary abnormality in chemoreflex response or ventilatory control in these patients, but there is little evidence for either of these during supine rest (13), suggesting that there is no intrinsic defect in chemoreception in these patients.
In contrast, available data support an intimate relation with heightened sympathetic activity: LeLorier et al. (14) produced consistent and uniformly large reductions in PetCO2 by using combined upright tilt and lower-body negative pressure in healthy volunteers. This same group demonstrated a close relation between increased peroneal muscle sympathetic nerve activity and experimentally controlled PetCO2 in another group of healthy subjects (31).
In our own POTS patients, postural hyperventilation and reduced PetCO2 have been confined to a subgroup of patients we have denoted “normal-flow POTS.” These patients are characterized by blood volume, cardiac output, and peripheral resistance similar to healthy control subjects but in whom splanchnic blood flow is increased and peripheral blood flow is decreased during upright tilt (33) and during phase II of the Valsalva maneuver (34).
In the present work we hypothesize that sympathetic activation, increased by upright tilt, drives hyperventilation and hypocapnia in POTS patients. On the basis of this hypothesis, we predict that peripheral vasoconstriction, blood pressure (BP) variability, and low frequency (LF)-to-high frequency (HF) ratio, as surrogate measures of sympathetic activity, are significantly increased in those patients with hypocapnic hyperventilation. Results confirm widespread orthostatic peripheral sympathetic activation in hypocapnic POTS patients. Marked peripheral vasoconstriction balances enhanced splanchnic dilation to yield unchanged thoracic blood flow in these patients.
MATERIALS AND METHODS
Subjects and Experimental Outline
We studied 20 POTS patients and 10 healthy volunteer control subjects. The POTS patient data were collected from consecutive subjects fulfilling criteria for normal-flow POTS (see below).
POTS patients were referred for >6 mo of orthostatic intolerance defined by the symptoms of lightheadedness, fatigue, exercise intolerance, headache, neurocognitive deficits, tremulousness, nausea and abdominal pain, altered vision, and sometimes shortness of breath when upright with no other medical explanation for the symptoms. All patients with self-described dyspnea had been evaluated by a pulmonary physician with normal outcome. In all patients, POTS was confirmed on a screening upright tilt-table test at 70°. POTS was diagnosed by symptoms of orthostatic intolerance during the screening tilt test associated with an increase in sinus heart rate of >30 beats/min or to a rate of >120 beats/min during the first 10 min of tilt as defined in adult subjects in the literature (16, 26). We used occlusion cuffs placed around the midthigh above a mercury-in-Silastic strain gauge (Hokanson) placed at midcalf to measure supine calf blood flow by venous occlusion strain-gauge plethysmography (SPG). Measurements were made supine at the beginning of experiments after a 30-min resting period. Blood flow was measured while supine by standard venous occlusion methods (6). We subdivided the POTS patients after the tilt test on the basis of calf blood flow by using calf blood flow data collected from >60 healthy volunteer subjects evaluated during prior research protocols. For purposes of this study, only “normal” calf blood flow subjects were retained. Normal flow was defined as >1.2 ml·min−1 · 100 ml tissue−1, which is the smallest calf blood flow that we have measured in volunteer subjects, and <3.6 ml·min−1 ·100 ml tissue−1, which is the largest calf blood flow we have measured in volunteer subjects. We defined normal-flow POTS as those POTS patients with calf blood flow falling between these limits.
There were 20 normal flow POTS patients, 14–23 yr of age, identified in this manner (median = 16.8 yr; 6 male, 14 female). There were 10 healthy volunteers who were 14–22 yr of age (median = 17.4 yr; 3 male, 7 female). All subjects (POTS and control subjects) were free from systemic illnesses, and all subjects refrained from taking medications for at least 2 wk before testing. There were no tobacco users. Caffeine was withheld for at least 24 h. All subjects had normal electrocardiograms and echocardiograms. We excluded healthy volunteers with a history of syncope or orthostatic intolerance. There were no trained competitive athletes or bedridden subjects. Informed consent was obtained from subjects or from parents and subjects in those <18 yr old. All protocols were approved by the Committee for the Protection of Human Subjects (Institutional Review Board) of New York Medical College.
Laboratory Evaluation
We assessed BP, heart rate, tidal volume, respiratory rate, and PetCO2 and estimated changes in thoracic, splanchnic, pelvic, and calf segmental blood volumes and blood flows by impedance plethysmography and forearm and calf blood flow by venous occlusion plethysmography while supine and throughout upright tilt as explained below.
Protocol
Tests began after an overnight fast. After a 30-min acclimatization period, we assessed heart rate, BP, respiratory rate, respiratory volumes, and PetCO2 during a supine baseline period of at least 5 min. We then measured blood flow in the arms and legs by using strain-gauge venous occlusion plethysmography. Supine impedance plethysmography (IPG) was employed continuously to measure resistance (R0) and beat-to-beat change in resistance (ΔR) of thoracic, splanchnic, pelvic, and leg segments.
After supine data collections were complete, the patients were tilted upright to an angle of 70° with the horizontal for maximum of 10 min to obtain steady-state changes in splanchnic and thoracic impedance. Impedance flows and volumes were determined from electrical resistance measurements made while patients gently held their breath in half inspiration. In some POTS subjects, 10 min of tilt could not be sustained, in which cases measurements were made at the longest time upright (see below). The minimum sustained PetCO2, maximum sustained respiratory rate, and maximum sustained minute volume averaged over 30-s epochs were tabulated during tilt. Segmental flow data were tabulated before tilt and at their minima during tilt.
Details of Method
Heart rate, PetCO2, and respiratory and BP monitoring
ECG
The ECG was assessed throughout by a microamplifier.
END-TIDAL PARTIAL PRESSURE OF CARBON DIOXIDE
PetCO2 was measured by using both the analog waveform and the recorded numeric values of PetCO2 obtained from a CapnoCheck II capnograph. Before and during tilt procedures, patients were provided with a nasal cannula and instructed in its use. Side-stream capnography was performed by continuous infrared spectrography at the selective wavelength for carbon absorption (4.3 nm).
RESPIRATORY VOLUMES
Relative respiratory volumes were obtained by respiratory inductance plethysmograph (Respitrace, NIMS Scientific) as follows: on startup, Respitrace volumes were normalized to an internal scale; once normalization was complete and with the subjects remaining supine, we calibrated normalized Respitrace volumes against a pneumotachograph (Grass Telefactor, West Warwick, RI), which also yielded resting tidal volumes recorded for POTS patients and control subjects alike. This enabled the unobtrusive use of the Respitrace as a comparative quantitative measure of relative changes in tidal volume throughout supine and upright testing. Data for assessment of relative changes in ventilation were obtained offline. After taking absolute values of Respitrace excursions, we integrated these values to obtain a quantity linearly related to total ventilation (Fig. 2).
Fig. 2.
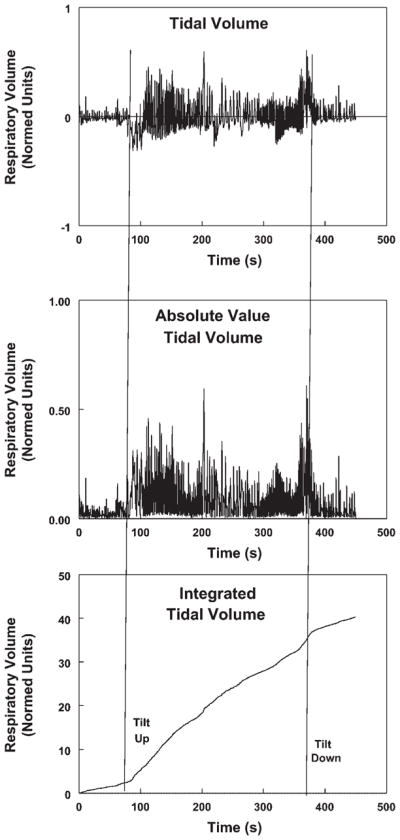
Construction of a time-integrated tidal volume curve (bottom) from the record of time-dependent relative Respitrace tidal volume (top). An intermediate step is to obtain the absolute value of the tidal volume curve (middle).
When applied before and during tilt, the slopes of the integrated tidal volume curve, equivalent to the relative rate of ventilation, changed abruptly, indicating a change in ventilation. The ratio of the slopes was defined as the “relative minute ventilation” and was compared with changes in PetCO2 as shown in Fig. 3.
Fig. 3.
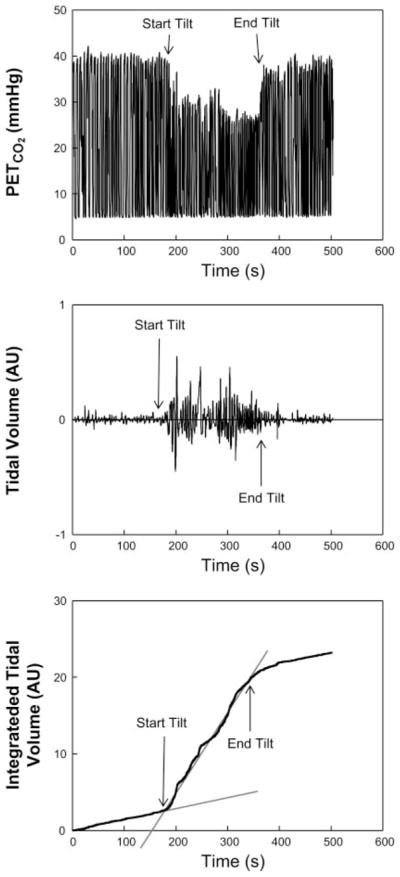
PetCO2 (top), Respitrace tidal volume record (middle), and calculation of relative respiratory minute volume (bottom) as the slope of linear portions of the integrated tidal volume corresponding to times preceding and during upright tilt in a hypocapnic POTS (POTSHC) patient.
BP
Upper extremity BP was continuously monitored with a finger arterial plethysmograph (Finometer, FMS, Amsterdam) placed on the right middle or index finger. Finometer data were calibrated to a brachial artery oscillographic pressure. The Finometer contains software permitting a successful correction between finger and cuff brachial artery pressure on the same arm. Continuous BP data were used to compute heart rate and BP variability indexes and to perform and compare coherence analyses among the subject groups.
ECG, respiratory, PetCO2, and Finometer data were interfaced to a personal computer through an analog-to-digital converter (DI-720 DataQ Ind, Milwaukee, WI). All data were multiplexed with strain-gauge and impedance data and were thereby synchronized.
Heart rate and BP variability, and coherence analysis
At least 5 min of heart beats were acquired during baseline supine continuous recordings of heart rate and BP after a 30-min resting period in all subjects. Beats were again acquired for 3–5 min after a 1- to 2-min BP stabilization period after upright tilt. We used custom software to collect digital sequences containing RR interval, and systolic, diastolic, and mean BPs for each heart beat, although continuous BP and electrocardiographic data were digitized as well (see above). Ectopy was corrected by removing the ectopic beat and interpolating with a cubic spline for five beats in either direction. This was rarely necessary. Beat epochs were linear detrended. For the current analysis, only frequency domain analyses were employed. An autoregressive model was used to calculate the RR interval spectrum, BP power spectrum, and cross spectrum (13–15). In brief, RR intervals and BP, acquired as a sequence of discrete point events, were transformed into an impulse train in which pulses were arranged at equal intervals (equal to the mean RR interval) with impulse heights equal to the RR intervals or BP as appropriate. Autoregression was performed, and digital power spectra were calculated by using the extended Yule-Walker equations (11). The final order of the model was chosen to minimize Akaike’s final prediction error (11). This yields the interval spectrum, which is converted to the spectrum of counts by dividing by the mean RR interval of the sequence. The spectral power within a given band was computed by taking the power in the actual frequency band. Spectral power could be partitioned into ultra-low-frequency (ULF, <0.01 Hz), very low-frequency (VLF, 0.01–0.04 Hz), low-frequency (LF, 0.04–0.15 Hz), and high-frequency (HF, 0.15–0.40 Hz) power bands. However, for current purposes, only LF and HF data and total power (TP) were retained for both heart rate and BP. The LF systolic BP power band represents periodic oscillations, which may reflect intrinsic arteriolar vasomotion (17). The LF RR power band reflects small contributions directly from the sympathetic nervous system (13, 14) plus dominant vagal-efferent baroreceptor-mediated changes originating in the pressure trace; it therefore contains both sympathetic and parasympathetic contributions. The HF band represents effects of parasympathetic modulation of heart rate and BP and also mechanical effects of respiration on cardiac filling. The LF-to-HF ratio was calculated to represent overall sympathovagal balance (14). The normalized cross-spectrum between RR and systolic BP was used to calculate the magnitude and phase of the transfer function between systolic BP and RR interval as an index of baroreceptor gain when coherence exceeded 0.5 (15, 17).
Forearm and calf blood flow by SPG
We used venous occlusion SPG in all subjects to measure forearm and calf blood flow. Occlusion cuffs were placed at midbiceps and midthigh. Appropriate-sized mercury-in-Silastic strain gauges (Hokanson) were placed at the maximum dimension of the forearm and calf. Measurements were made in standard fashion by suddenly inflating cuffs to a pressure of 45 mmHg and then computing the slope of time-dependent increase in limb cross section. Measurements of forearm and calf blood flows were made at the beginning of experiments. Measurements of forearm flow were made during upright tilt as indicated. We also estimated supine forearm and calf venous pressures (Pv) by gradually increasing occlusion cuff pressure until a change in SPG deflection was noted. We have used this technique before (32).
IPG to measure changes in segmental blood volumes and blood flows
We used a Tetrapolar high-resolution impedance monitor (THRIM) four-channel digital impedance plethysmograph (UFI, Morro Bay, Ca) to detect shifts in blood volume and changes in blood flow. These quantities were obtained within four anatomic segments operationally defined by electrode placement on anatomic landmarks. These were designated the thoracic segment (supraclavicular area to xyphoid process), the splanchnic segment (xyphoid process to iliac crest), the pelvic segment incorporating lower pelvis to the knee (iliac crest to knee), and the leg or calf segment (upper calf just below the knee to the ankle). Ag/AgCl ECG electrodes were attached at these segmental boundaries and also to the left foot and left hand, where they served as current injectors. Electrical resistance values were measured by using the segmental pairs as sampling electrodes. The midline distance between the sampling electrodes (L) was measured with a tape measure. We also measured the circumferences of calf, thigh, hips, waist, and chest to obtain approximate volume contents of each anatomic segment. We estimated postural changes in blood volume in each segment during upright tilt from the formula (3)
where ρ is electrical conductivity of blood estimated as 53.2 × exp(hematocrit × 0.022) given by Geddes and Kidder (4). We measured hematocrit from a venous sample taken from the antecubital vein. R0 is the resistance of a specific segment before change in tilt angle, R1 is the resistance after change in the tilt angle, and ΔR is the change in resistance (R1 – R0) in a specific segment during the each incremental tilt step; ρ was regarded as constant during the maneuver. We also used this calculation to quantitate changes in thoracic blood volume during voluntary hyperventilation as shown in Fig. 1.
IPG was also used to measure segmental blood flows (20). Methods have recently been validated in our laboratory for the detection of leg, thoracic, and splanchnic blood flow (33, 34). Pulsatile changes in electrical resistance for each segment were employed to compute the time derivative ∂R/∂t, which we used to obtain the blood flow responses of each body segment during tilt.
Blood flow was estimated for an entire anatomic segment from the formula (3)
where HR is heart rate, T is the ejection period, R is the pulsatile resistance, and R0 is the baseline resistance. Respiratory artifact was removed from the signal by using a custom, Fourier-based frequency selection technique.
IPG flows were expressed in milliliters per minute for anatomic segment and could be normalized by dividing by estimated segmental volume.
Tilt-table testing
An electrically driven tilt table (Colin Medical, San Antonio, TX) with a footboard was used. After supine measurements were complete, the subjects underwent tilt to 70° for a maximum of 10 min as explained above. Steady state was defined by a stable splanchnic blood volume which could be determined in real time. Typically, splanchnic blood volume steady state was associated with stable splanchnic and thoracic blood flows.
Statistics
All tabular and graphic results are reported as means ± SE. Forearm and calf blood flows and peripheral resistances by SPG, resting tidal volume, PetCO2, impedance estimates of blood flow, and relative change in ventilation were compared by one-way ANOVA comparing control, POTS subjects who demonstrated significant hyperventilation and hypocapnia (POTSHC subjects) and POTS subjects who were normocapnic (POTSNC subjects). We used two-way ANOVA for comparisons of heart rate, mean and systolic BPs, heart rate, and BP variability indexes, IPG blood flow, and blood volume responses to tilt. Results were calculated by using SPSS (Statistical Package for the Social Sciences) software version 11.0.
RESULTS
Postural hypocapnia, defined by a PetCO2 of <30 mmHg when upright, was present in 10 POTS patients (defined here as POTSHC), absent in the remaining 10 POTS patients (defined here as POTSNC), and absent in control subjects. Dependent acrocyanosis and livedo reticularis associated with cool extremities were present in all POTSHC but absent in the remainder of subjects. Pulse oximetry indicated normal oxygen saturations (>96%) in all subjects in supine and upright positions.
Lightheadedness was uniformly reported by POTS patients along with other symptoms of orthostatic intolerance during tilt. Two POTS subjects required the tilt to be discontinued before 10 min had elapsed but not before splanchnic steady state was complete. These data were preserved for analysis. No patient fainted. Volunteer control subjects tolerated upright tilt without symptoms.
Resting Supine Hemodynamics and Size Measurements
As shown in Table 1, age, weight, height, and body surface area were similar for all groups.
Table 1.
Patient dimensions and supine hemodynamic data
| Control (n = 10) | POTS
|
||
|---|---|---|---|
| Normocapnia (POTSNC) (n = 10) | Hypocapnia (POTSHC) (n = 10) | ||
| Age, years | 17±1 | 17±2 | 16±2 |
| Weight, kg | 61±4 | 57±3 | 64±4 |
| Height, cm | 169±3 | 167±3 | 170±3 |
| Body surface area, m2 | 1.59±0.21 | 1.63±0.06 | 1.75±0.06 |
| HR, beats/min | 69±4 | 71±4 | 74±4 |
| Systolic BP, mmHg | 117±4 | 109±4 | 113±5 |
| MAP, mmHg | 83±2 | 76±3 | 82±2 |
| Respiratory rate, breaths/min | 17.2±0.5 | 16.8±1.4 | 16.2±1.2 |
| Pet CO2, mmHg | 40.8±0.4 | 40.3±0.5 | 38.2±0.3* |
| Tidal volume, ml | 452±76 | 488±102 | 423±47 |
| Venous occlusion forearm blood flow, ml·min−1·100 ml tissue−1 | 3.4±0.3 | 3.2±0.2 | 2.6±0.2 |
| Forearm arterial resistance, mmHg·min·ml−1·100 ml tissue | 26±6 | 28±4 | 38±3 |
| Venous occlusion calf blood flow, ml·min−1·100 ml tissue−1 | 3.2±0.6 | 2.8±0.3 | 2.1±0.2 |
| Calf arterial resistance, mmHg·min−1·100 ml tissue | 29±4 | 26±4 | 33±2 |
| Variability indexes | |||
| HRV, ms2/Hz | 3,639±448 | 3,448±662 | 2,564±880 |
| BPV, mmHg2/Hz | 10.4±2.8 | 9.0±2.0 | 8.1±0.7 |
| LF-HRV, ms2/Hz | 926±123 | 1111±366 | 750±208 |
| HP-HRV, ms2/Hz | 1,667±363 | 1,742±504 | 1,217±247 |
| LF/HF transfer gain, ms/mmHg | 0.90±0.28 21.8±2.0 |
0.73±0.11 23.8±5.2 |
0.83±0.17 15.9±3.1 |
| Impedance blood flows, ml/min | |||
| Thoracic | 4,559±783 | 3,989±902 | 4,726±671 |
| Splanchnic | 1,694±233 | 2,316±111* | 2,611±327* |
| Pelvic | 633±181 | 543±65 | 630±122 |
| Leg | 99±19 | 86±15 | 79±14 |
Values are means ± SE. POTS, postural tachycardia syndrome; POTSNC and POTSHC, normocapnic and hypocapnic POTS subjects; HR, heart rate; HRV, HR variability; BP, blood pressure; BPV, BP variability; LF, low frequency; HF, high frequency; MAP, mean arterial pressure; PetCO2, end-tidal partial pressure of carbon dioxide.
P < 0.05 vs. control.
Resting heart rate, respiratory rate, and systolic and mean arterial BPs were similar for the groups. Tidal volumes and resting supine respiratory rates were similar in all groups of subjects. There was a trend toward increased respiratory rate (P = 0.12) in the POTSHC group that did not reach significance in the current analysis. However, PetCO2 was significantly reduced in POTSHC compared with control or compared with POTSNC.
SPG forearm and calf flows were not different among the groups, nor were calculated peripheral resistances.
Total power for RR variability and BP variability over the frequency range from 0.001 to 0.6 Hz was not different for the groups, nor was LF-to-HF ratio and transfer function gain. There was a trend toward lower transfer gain (P = 0.12) in the POTSHC group.
As we reported previously (33), splanchnic blood flow was increased in POTS patients compared with control. This held true for both POTSHC (P = 0.035) and POTSNC (P = 0.027) subgroups. There were no significant differences for thoracic, pelvic, or leg (calf) regional segmental circulations.
Changes During Upright Tilt
Heart rate and BP with upright tilt
Referring to Fig. 4, heart rate increased in all subjects at 70° of upright tilt and was further increased compared with control subjects in all POTS patients. Heart rate was most increased in POTSHC (P = 0.001) and significantly less increased in POTSNC (P = 0.045) in the latter compared with the POTSHC subgroup.
Fig. 4.
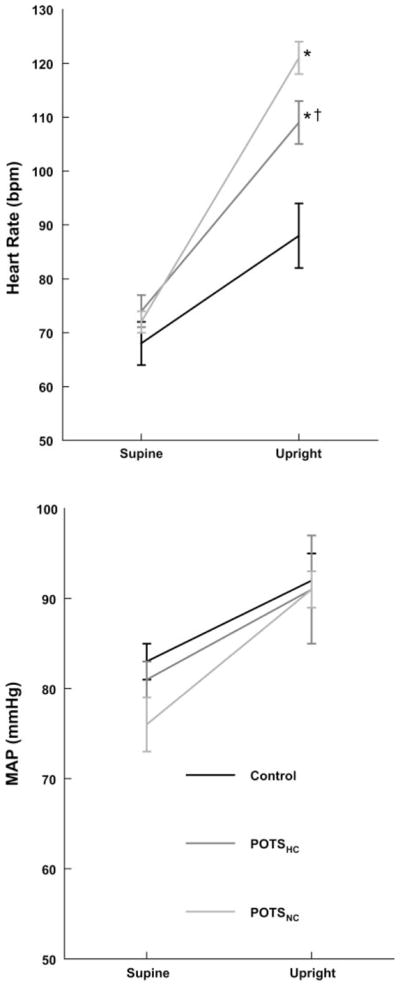
Changes in heart rate (top) and mean arterial pressure (MAP; bottom) during upright tilt. Heart rate increased in all subjects and was most increased in normocapnic POTS (POTSNC) and next most in POTSHC compared with control subjects. MAP is increased similarly for all subjects. *P < 0.05 vs. control. †P < 0.05 compared with POTSNC.
Mean arterial pressure was similar to control during tilt in all POTS patients.
Respiratory indexes with upright tilt
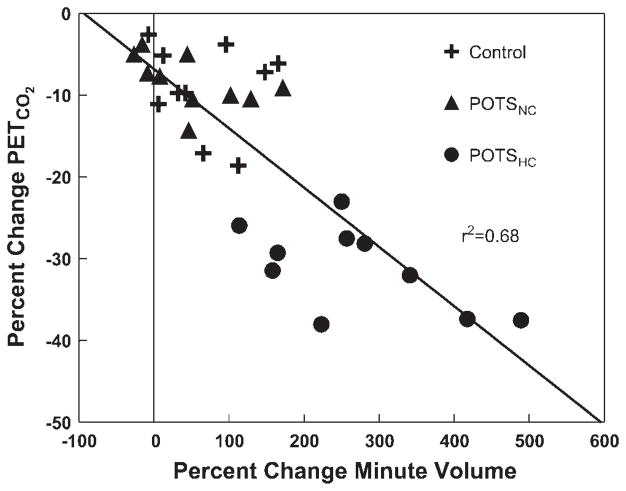
Respiratory rate did not significantly change with upright tilt. Changes in PetCO2 and relative minute ventilation are shown in Fig. 5. PetCO2 decreased significantly for all groups with tilt but was significantly (P < 0.001) reduced in the POTSHC group compared with both of the other groups. This is an expected result based on the definition of the subgroups. Figure 6 shows the degree of inverse correlation (r2 = 0.68) between percent change in minute volume and percent change in PetCO2.
Fig. 5.
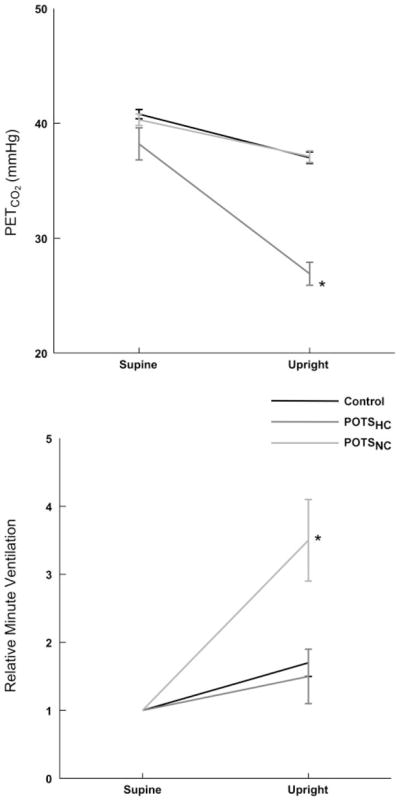
Changes in PetCO2 (top) and minute ventilation (bottom) during upright tilt. PetCO2 was decreased in all subjects but most markedly in POTSHC patients. This was associated with enhanced minute ventilation in these same subjects. *P < 0.05 compared with control.
Fig. 6.
Percent change in minute volume compared with percent change in PetCO2. Individual data are shown for each patient. PetCO2 is decreased in most patients but is most markedly decreased in POTSHC patients in association with a marked increase in minute ventilation.
Heart rate and BP variability indexes with upright tilt
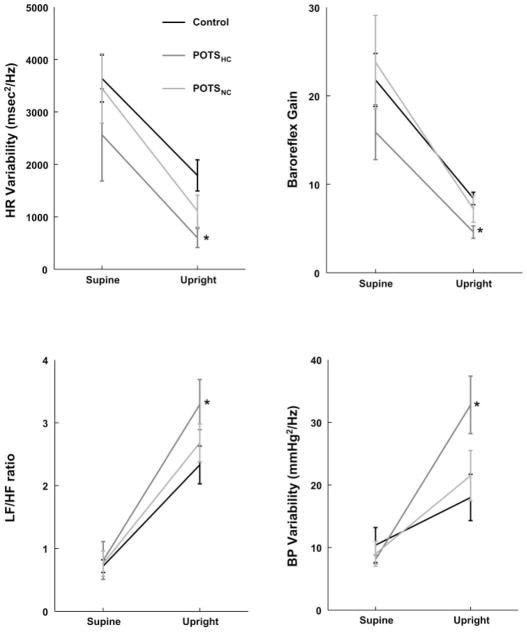
As shown in Fig. 7, essentially all variability indexes were different from controls for POTSHC compared with control but not for POTSNC. Thus total power of RR variability was decreased (to 598 ± 141 for POTSHC, 1,389 ± 273 for POTSNC, and to 1,889 ± 273 for control subjects) (P < 0.05). LF-HR variability power was similar in all groups (404 ± 129 for POTSHC, 702 ± 233 for POTSNC, and 664 ± 179 for control subjects). HF-HR variability power tended to be decreased in POTSHC (134 ± 44 for POTSHC, 360 ± 82 for POTSNC, and 262 ± 179 for control subjects), which did not reach significance. BP variability was markedly increased (P < 0.01), and LF-to-HF ratio was modestly increased (P = 0.025) for POTSHC compared with control subjects but not for POTSNC. There was as a result a decrease in calculated baroreflex gain (P = 0.025) in POTSHC compared with control. subjects. This may suggest an increase in cardiac modulation by sympathetic tone.
Fig. 7.
Changes in total heart rate (HR) variability (top left), low frequency (LF)-to-high frequency (HF) ratio (bottom left), baroreflex gain (top right), and systolic blood pressure (BP) variability (bottom right) during upright tilt. HR variability and baroreflex gain decreases for all subjects, but most for POTSHC patients. LF-to-HF ratio and BP variability increase for all subjects, but most for POTSHC patients. *P < 0.05 compared with control.
Segmental blood volume and blood flow changes during tilt
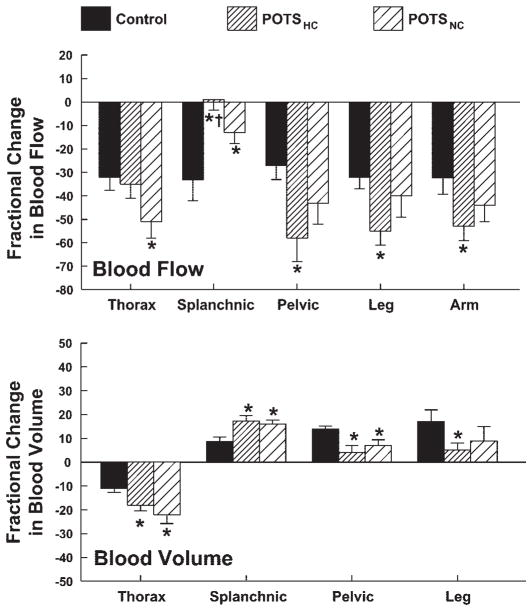
Figure 8 shows the percent changes in segmental blood flows and volumes during upright tilt.
Fig. 8.
Percent changes in thoracic, splanchnic, pelvic, leg, and arm blood flows (top) and corresponding changes in segmental blood volumes (except arm; bottom) during upright tilt averaged over all subjects within a subject group. Thoracic blood flow was most reduced in POTSNC subjects. Splanchnic flow was reduced in control subjects, but this was most blunted in POTSHC. This was associated with a significant decrease in peripheral blood flow in these patients. *P < 0.05 compared with control.
THORACIC
Thoracic blood volume was significantly decreased compared with control for all POTS patients (P < 0.008), although the decrease was blunted for hypocapnic patients. This was associated with a decrease in thoracic blood flow (P < 0.05) for POTSNC patients only.
SPLANCHNIC
Splanchnic blood volume increased in all subjects, but this increase was significantly greater in all POTS patients (P = 0.009) and was similar for POTSNC and POTSHC. Splanchnic blood flow was markedly decreased in control compared with baseline (P < 0.001). The decrease in splanchnic blood flow was significantly blunted in POTSNC (P = 0.046) compared with control. The decrease was eliminated in POTSHC (P = 0.006). Also, splanchnic blood flow was increased in POTSHC compared with POTSNC (P < 0.05).
PERIPHERAL BLOOD FLOW (PELVIC, CALF, AND FOREARM)
Pelvic and calf blood volume increased in all subjects with tilt (P < 0.001), but the increase was blunted in POTS patients particularly POTSHC. Forearm, pelvic, and calf blood flows decreased in all subjects with tilt (P < 0.001). This decrease in blood flow was significantly accentuated in POTSHC (P = .0045). Forearm, calf, and pelvic blood flows were reduced compared with control subjects in POTSHC only (P = 0.017), indicating increased peripheral vasoconstriction in POTSHC.
DISCUSSION
Main Findings
We have previously demonstrated on orthostatic challenge that despite being normovolemic, normal-flow POTS patients preferentially redistribute extra blood to the splanchnic circulation when upright compared with control subjects (33).
We have since noted that this was often associated with hyperventilation, that is, an increase in tidal volume, and hypocapnia, defined here as a PetCO2 of <30 mmHg. Although hyperventilation has been offered as a theoretical mechanism by which reduced thoracic blood volume may be in part compensated (30), such compensation does not occur in practice. Instead, hyperventilating POTSHC patients demonstrate significantly decreased orthostatic peripheral blood flow in arms, legs, and pelvic areas (which primarily comprise the buttocks and upper legs) compared with control subjects or POTSNC. One might speculate that extreme peripheral vasoconstriction compensated for selective splanchnic vasodilation in these subjects such that thoracic blood flow remained unchanged.
Sympathetic Vasoconstriction May Increase in POTSHC
While our study is limited by the absence of recorded sympathetic neural impulses (see below), the data suggest that marked peripheral vasoconstriction during orthostasis may reflect increased sympathetic activity. This interpretation is supported by heart rate and BP variability data acquired before and during upright tilt. These data show that BP variability and LF-to-HF ratio are significantly increased for POTSHC compared with control subjects, and thus there is enhanced cardiovascular modulation by sympathetic tone.
Does Sympathetic Activation Produce Hyperventilation in POTSHC?
This suggests a possible mechanism by which enhanced sympathetic activation and associated parasympathetic withdrawal alter peripheral and central chemoreflex activity, provoking hyperventilation and hypocapnia. Rapid autonomic modulation of the peripheral chemoreflexes, particularly the carotid chemoreflex, is known (18) and may account in part for ventilatory enhancement during physical and emotional stress (10). This represents one form of cross-talk between the baroreflexes and the chemoreflexes (7). While it is tempting to ascribe significance to reduced blood flow to the glomus in forms of orthostatic intolerance, blood flow alterations do not seem to exert much influence on carotid chemoreflex activity, and there is little evidence for reduced carotid blood flow in POTS patients anyway until cerebral blood flow is diminished.
Alternatively, Does Hyperventilation Produce Sympathetic Activation in POTSHC?
However, an entirely different interpretation could explain our results. Rather than sympathoexcitation and vagal withdrawal producing hyperventilation, could hyperventilation result in sympathoexcitation? Quantitative investigations into the cardiovascular as well as cerebrovascular effects of hyperventilation and hypocapnia date at least to the work of Kety and Schmidt (12). These early studies noted a small increase in cardiac output and reduction in systolic BP with a small increase in mean arterial pressure and heart rate during voluntary or active hyperventilation. Similar findings were found later by Richardson et al. (25), who examined voluntary hyperventilation over a 7-min time period. Those investigators concluded that the peripheral cardiovascular effect of hyperventilation was vasodilation, not vasoconstriction, and that this was primarily the result of respiratory alkalosis and unrelated to mechanical factors. Subsequent work by Van de Borne et al. (37) also indicates a reduction in baroreflex modulation of RR interval (i.e., reduced RR-BP baroreflex gain, such as we measured) but usually associated with sympathoexcitation during isocapnic hyperventilation. [There is an ancient literature on sympathetic activation as evidenced by increased heart rate with hyperventilation.]
Do Hyperventilation and Attendant Cerebral Vasoconstriction Cause POTS Symptoms?
Hyperventilation and hypocapnia are reported in a spectrum of orthostatic intolerance syndromes, specifically reported in chronic orthostatic intolerance (POTS), chronic fatigue syndrome (CFS), and postural faint (19, 21, 22). In these, respiratory changes have been related to decreased cerebral blood flow. Recent data indicate that respiratory changes are not entirely responsible for reduced cerebral blood flow (29). Moreover, there is no evidence of abnormal beat-to-beat cerebral autoregulation in the patients (27). Nor is there evidence that cerebral vasoconstriction alone can produce syncope (15) although complex cardiorespiratory interactions may play an active role (13). Data from Shoemaker’s laboratory indicate that actual rather than simulated orthostasis is required for hyperventilation to occur (9). Our data are entirely consistent with prior publications that view hyperventilation as physiologically driven and regard reduced cerebral blood flow as the result of these physiological changes.
Where does this Fit in the Spectrum of “Hyperventilation Syndromes”?
One could also look at patients primarily from the standpoint of a hyperventilation syndrome as it may integrate into a wider scheme of panic disorders. A panic attack is defined symptomatically by the Diagnostic and Statistical Manual IV and the American Psychiatric Association by accelerated heartbeat, difficulty breathing or choking, terror that is almost paralyzing, dizziness or lightheadedness, nausea or abdominal distress, trembling, derealization, sweating, shaking, chest pains, hot flashes, sudden chills, tingling fingers or toes, and fear of losing control or imminent death (1). Many of these symptoms closely resemble findings in POTS and symptoms of orthostatic intolerance.
Limitations
Direct measurement of sympathetic activity such as muscle sympathetic nerve activity would better justify our claim that peripheral sympathetic vasoconstriction is increased in normal-flow POTS patients who are hypocapnic. Such instrumentation is difficult in young subjects and was not pursued. However, indirect measures of arm and leg peripheral vasoconstriction are at least consistent with the claim of sympathoexcitation, as are observed heart rate and BP variability data. Prior published work indicates exaggerated vasoconstriction in comparable normal-flow POTS patients during phase II of the Valsalva maneuver (34).
Respiratory pneumotachography was not performed during orthostatic stress because of feasibility issues and difficulty with simultaneous capnography. Instead, a pneumotachograph was used to calibrate a Respitrace inductance respiratory plethysmograph while the subject remained at supine rest, and the Respitrace alone was used during tilt procedures. This calibration gave highly linear and predictable results over a wide range of inspired volumes. However, the Respitrace provides only relative changes in tidal volume. Therefore while supine minute ventilation and tidal volume could be reported, we could only report relative changes in these quantities while the subject remained upright.
We cannot make statements concerning the impact of hypocapnia on cerebral blood flow because this was not measured while supine or during upright tilt. Results concerning the impact of hypocapnia and reduced cerebral blood flow on POTS remain controversial (22, 27).
We reported changes in segmental blood flow. It might be more useful to report changes in segmental arterial resistance. In past work, we demonstrated that peripheral arterial resistance is related to flow by the relation R = (MAP − Pv)/flow, where Pv is the local venous pressure and MAP is mean arterial pressure. While Pv could be measured supine, it could not be accurately measured during upright tilt, and therefore computed resistance was not reported. However, if it is assumed, as have others (23), that Pv during tilt is not different among various subjects, an assumption that is supported by prior work (32), then it is reasonable to assume that decreased flow predicts increased peripheral resistance.
The majority of subjects were females with regular menstrual cycles, and none was menstruating at the time of testing. Past studies have demonstrated hormonal fluctuations and potentially altered autonomic regulation throughout the menstrual cycle and in response to environmental stimuli (35). There is no apparent effect on orthostatic tolerance (8). Nonetheless, controlling for menstrual cycle will be important to future work.
Acknowledgments
We thank members of the Dept. of Pediatrics, Dr. Leonard Newman, and the Division of Pediatric Cardiology, especially the Director, Michael H. Gewitz, M.D., for unflagging support, and Drs. Thomas H. Hintze, David Robertson, and Phillip Low for constant inspiration and stimulation.
GRANTS
This research was supported by National Heart, Lung, and Blood Institute Grants 1-RO1-HL-66007 and 1-R01-HL-074873 and National Institute of Allergy and Infectious Diseases Grant 1-RO1-AI-54478.
References
- 1.American Psychiatric Association. Diagnostic and Statistical Manual of Mental Disorders DSM-IV-TR. Washington, DC: American Psychiatric Association; 2000. (text revision) [Google Scholar]
- 2.Anthonisen NR, Bartlett D, Jr, Tenney SM. Postural effect on ventilatory control. J Appl Physiol. 1965;20:191–196. [Google Scholar]
- 3.Geddes LA, Baker LE. Principles of Applied Biomedical Instrumentation. New York: Wiley; 1989. Detection of physiological events by impedance; pp. 594–600. [Google Scholar]
- 4.Geddes LA, Kidder H. Specific resistance of blood at body temperature II. Med Biol Eng. 1976;14:180–185. doi: 10.1007/BF02478745. [DOI] [PubMed] [Google Scholar]
- 5.Gisolf J, Wilders R, Immink RV, van Lieshout JJ, Karemaker JM. Tidal volume, cardiac output and functional residual capacity determine end-tidal CO2 transient during standing up in humans. J Physiol. 2004;554:579–590. doi: 10.1113/jphysiol.2003.056895. [DOI] [PMC free article] [PubMed] [Google Scholar]
- 6.Greenfield AD, Whitney RJ, Whitney RJ. Methods for the investigation of peripheral blood flow. Br Med Bull. 1963;19:101–109. doi: 10.1093/oxfordjournals.bmb.a070026. [DOI] [PubMed] [Google Scholar]
- 7.Henry RA, Lu IL, Beightol LA, Eckberg DL. Interactions between CO2 chemoreflexes and arterial baroreflexes. Am J Physiol Heart Circ Physiol. 1998;274:H2177–H2187. doi: 10.1152/ajpheart.1998.274.6.h2177. [DOI] [PubMed] [Google Scholar]
- 8.Hirshoren N, Tzoran I, Makrienko I, Edoute Y, Plawner MM, Itskovitz-Eldor J, Jacob G. Menstrual cycle effects on the neurohumoral and autonomic nervous systems regulating the cardiovascular system. J Clin Endocrinol Metab. 2002;87:1569–1575. doi: 10.1210/jcem.87.4.8406. [DOI] [PubMed] [Google Scholar]
- 9.Hughson RL, Edwards MR, O’Leary DD, Shoemaker JK. Critical analysis of cerebrovascular autoregulation during repeated head-up tilt. Stroke. 2001;32:2403–2408. doi: 10.1161/hs1001.097225. [DOI] [PubMed] [Google Scholar]
- 10.Kara T, Narkiewicz K, Somers VK. Chemoreflexes—physiology and clinical implications. Acta Physiol Scand. 2003;177:377–384. doi: 10.1046/j.1365-201X.2003.01083.x. [DOI] [PubMed] [Google Scholar]
- 11.Kay SM, Marple SL. Spectrum analysis—a modern perspective. Proc IEEE. 1981;69:1380–1419. [Google Scholar]
- 12.Kety SS, Schmidt CF. The effects of active and passive hyperventilation on cerebral blood flow, cerebral oxygen consumption, cardiac output, and blood pressure of normal young men. J Clin Invest. 1946;25:107–119. [PubMed] [Google Scholar]
- 13.Krishnamurthy S, Wang X, Bhakta D, Bruce E, Evans J, Justice T, Patwardhan A. Dynamic cardiorespiratory interaction during head-up tilt-mediated presyncope. Am J Physiol Heart Circ Physiol. 2004;287:H2510–H2517. doi: 10.1152/ajpheart.00485.2004. [DOI] [PubMed] [Google Scholar]
- 14.LeLorier P, Klein GJ, Krahn A, Yee R, Skanes A, Shoemaker JK. Combined head-up tilt and lower body negative pressure as an experimental model of orthostatic syncope. J Cardiovasc Electrophysiol. 2003;14:920–924. doi: 10.1046/j.1540-8167.2003.03065.x. [DOI] [PubMed] [Google Scholar]
- 15.Levine BD, Giller CA, Lane LD, Buckey JC, Blomqvist CG. Cerebral versus systemic hemodynamics during graded orthostatic stress in humans. Circulation. 1994;90:298–306. doi: 10.1161/01.cir.90.1.298. [DOI] [PubMed] [Google Scholar]
- 16.Low PA, Opfer-Gehrking TL, Textor SC, Benarroch EE, Shen WK, Schondorf R, Suarez GA, Rummans TA. Postural tachycardia syndrome (POTS) Neurology. 1995;45:S19–S25. [PubMed] [Google Scholar]
- 17.Malliani A, Pagani M, Lombardi F, Cerutti S. Cardiovascular neural regulation explored in the frequency domain. Circulation. 1991;84:482–492. doi: 10.1161/01.cir.84.2.482. [DOI] [PubMed] [Google Scholar]
- 18.Marshall JM. Peripheral chemoreceptors and cardiovascular regulation. Physiol Rev. 1994;74:543–594. doi: 10.1152/physrev.1994.74.3.543. [DOI] [PubMed] [Google Scholar]
- 19.Martinon-Torres F, Rodriguez-Nunez A, Fernandez-Cebrian S, Eiris-Punal J, Perez-Munuzuri A, Martinon-Sanchez JM. The relation between hyperventilation and pediatric syncope. J Pediatr. 2001;138:894–897. doi: 10.1067/mpd.2001.113359. [DOI] [PubMed] [Google Scholar]
- 20.Montgomery LD, Hanish HM, Marker RA. An impedance device for study of multisegment hemodynamic changes during orthostatic stress. Aviat Space Environ Med. 1989;60:1116–1122. [PubMed] [Google Scholar]
- 21.Naschitz JE, Rosner I, Rozenbaum M, Gaitini L, Bistritzki I, Zuckerman E, Sabo E, Yeshurun D. The capnography head-up tilt test for evaluation of chronic fatigue syndrome. Semin Arthritis Rheum. 2000;30:79–86. doi: 10.1053/sarh.2000.9201. [DOI] [PubMed] [Google Scholar]
- 22.Novak V, Spies JM, Novak P, McPhee BR, Rummans TA, Low PA. Hypocapnia and cerebral hypoperfusion in orthostatic intolerance. Stroke. 1998;29:1876–1881. doi: 10.1161/01.str.29.9.1876. [DOI] [PubMed] [Google Scholar]
- 23.Okazaki K, Fu Q, Martini ER, Shook R, Conner C, Zhang R, Crandall CG, Levine BD. Vasoconstriction during venous congestion: effects of venoarteriolar response, myogenic reflexes, and hemodynamics of changing perfusion pressure. Am J Physiol Regul Integr Comp Physiol. 2005;289:R1354–R1359. doi: 10.1152/ajpregu.00804.2004. [DOI] [PubMed] [Google Scholar]
- 24.Onrot J, Goldberg MR, Hollister AS, Biaggioni I, Robertson RM, Robertson D. Management of chronic orthostatic hypotension. Am J Med. 1986;80:454–464. doi: 10.1016/0002-9343(86)90720-5. [DOI] [PubMed] [Google Scholar]
- 25.Richardson DW, Kontos HA, Raper AJ, Patterson JL., Jr Systemic circulatory responses to hypocapnia in man. Am J Physiol. 1972;223:1308–1312. doi: 10.1152/ajplegacy.1972.223.6.1308. [DOI] [PubMed] [Google Scholar]
- 26.Sandroni P, Opfer-Gehrking TL, McPhee BR, Low PA. Postural tachycardia syndrome: clinical features and follow-up study. Mayo Clin Proc. 1999;74:1106–1110. doi: 10.4065/74.11.1106. [DOI] [PubMed] [Google Scholar]
- 27.Schondorf R, Benoit J, Stein R. Cerebral autoregulation is preserved in postural tachycardia syndrome. J Appl Physiol. 2005;99:828–835. doi: 10.1152/japplphysiol.00225.2005. [DOI] [PubMed] [Google Scholar]
- 28.Serrador JM, Bondar RL, Hughson RL. Ventilatory response to passive head up tilt. Adv Exp Med Biol. 1998;450:133–139. doi: 10.1007/978-1-4757-9077-1_22. [DOI] [PubMed] [Google Scholar]
- 29.Serrador JM, Hughson RL, Kowalchuk JM, Bondar RL, Gelb AW. Cerebral blood flow during orthostasis: the role of arterial CO2. Am J Physiol Regul Integr Comp Physiol. 2006;290:R1087–R1093. doi: 10.1152/ajpregu.00446.2005. [DOI] [PubMed] [Google Scholar]
- 30.Shepherd JT. The lungs as receptor sites for cardiovascular regulation. Circulation. 1981;63:1–10. doi: 10.1161/01.cir.63.1.1. [DOI] [PubMed] [Google Scholar]
- 31.Shoemaker JK, O’Leary DD, Hughson RL. Pet(↓CO2) inversely affects MSNA response to orthostatic stress. Am J Physiol Heart Circ Physiol. 2001;281:H1040–H1046. doi: 10.1152/ajpheart.2001.281.3.H1040. [DOI] [PubMed] [Google Scholar]
- 32.Stewart JM. Pooling in chronic orthostatic intolerance: arterial vasoconstrictive but not venous compliance defects. Circulation. 2002;105:2274–2281. doi: 10.1161/01.cir.0000016348.55378.c4. [DOI] [PubMed] [Google Scholar]
- 33.Stewart JM, Medow MS, Glover JL, Montgomery LD. Persistent splanchnic hyperemia during upright tilt in postural tachycardia syndrome. Am J Physiol Heart Circ Physiol. 2006;290:H665–H673. doi: 10.1152/ajpheart.00784.2005. [DOI] [PMC free article] [PubMed] [Google Scholar]
- 34.Stewart JM, Medow MS, Montgomery LD, Glover JL, Millonas MM. Splanchnic hyperemia and hypervolemia during Valsalva maneuver in postural tachycardia syndrome. Am J Physiol Heart Circ Physiol. 2005;289:H1951–H1959. doi: 10.1152/ajpheart.00194.2005. [DOI] [PMC free article] [PubMed] [Google Scholar]
- 35.Tanaka M, Sato M, Umehara S, Nishikawa T. Influence of menstrual cycle on baroreflex control of heart rate: comparison with male volunteers. Am J Physiol Regul Integr Comp Physiol. 2003;285:R1091–R1097. doi: 10.1152/ajpregu.00162.2003. [DOI] [PubMed] [Google Scholar]
- 36.Tani H, Singer W, McPhee BR, Opfer-Gehrking TL, Haruma K, Kajiyama G, Low PA. Splanchnic-mesenteric capacitance bed in the postural tachycardia syndrome (POTS) Auton Neurosci. 2000;86:107–113. doi: 10.1016/S1566-0702(00)00205-8. [DOI] [PubMed] [Google Scholar]
- 37.Van De Borne P, Mezzetti S, Montano N, Narkiewicz K, Degaute JP, Somers VK. Hyperventilation alters arterial baroreflex control of heart rate and muscle sympathetic nerve activity. Am J Physiol Heart Circ Physiol. 2000;279:H536–H541. doi: 10.1152/ajpheart.2000.279.2.H536. [DOI] [PubMed] [Google Scholar]


