

Abstract
POTS (postural tachycardia syndrome) is associated with low blood volume and reduced renin and aldosterone; however, the role of Ang (angiotensin) II has not been investigated. Previous studies have suggested that a subset of POTS patients with increased vasoconstriction related to decreased bioavailable NO (nitric oxide) have decreased blood volume. Ang II reduces bioavailable NO and is integral to the renin–Ang system. Thus, in the present study, we investigated the relationship between blood volume, Ang II, renin, aldosterone and peripheral blood flow in POTS patients. POTS was diagnosed by 70° upright tilt, and supine calf blood flow, measured by venous occlusion plethysmography, was used to subgroup POTS patients. A total of 23 POTS patients were partitioned; ten with low blood flow, eight with normal flow and five with high flow. There were ten healthy volunteers. Blood volume was measured by dye dilution. All biochemical measurements were performed whilst supine. Blood volume was decreased in low-flow POTS (2.14 ± 0.12 litres/m2) compared with controls (2.76 ± 0.20 litres/m2), but not in the other subgroups. PRA (plasma renin activity) was decreased in low-flow POTS compared with controls (0.49 ± 0.12 compared with 0.90 ± 0.18 ng of Ang I · ml−1 · h−1 respectively), whereas plasma Ang II was increased (89 ± 20 compared with 32 ± 4 ng/l), but not in the other subgroups. PRA correlated with aldosterone (r = +0.71) in all subjects. PRA correlated negatively with blood volume (r = −0.72) in normal- and high-flow POTS, but positively (r = +0.65) in low-flow POTS. PRA correlated positively with Ang II (r = +0.76) in normal- and high-flow POTS, but negatively (r = −0.83) in low-flow POTS. Blood volume was negatively correlated with Ang II (r = −0.66) in normal- and high-flow POTS and in five low-flow POTS patients. The remaining five low-flow POTS patients had reduced blood volume and increased Ang II which was not correlated with blood volume. The data suggest that plasma Ang II is increased in low-flow POTS patients with hypovolaemia, which may contribute to local blood flow dysregulation and reduced NO bioavailability.
Keywords: angiotensin II, blood volume, fatigue, postural tachycardia syndrome (POTS), vasoconstriction
INTRODUCTION
Chronic orthostatic intolerance is highly associated with POTS(postural tachycardia syndrome) and afflicts a large number of patients [1]. Many of its clinical features (e.g. upright tachycardia, postural lightheadedness, increased plasma catecholamines, neurocognitive deficits and nausea) resemble findings in states of hypovolaemia [2–4]. Acute volume loading can provide symptomatic improvement in POTS patients [5], although the benefits are usually short lived. In addition, medical therapy intended to chronically increase blood volume has been a mainstay of therapy [6]. Thus the hypothesis that absolute hypovolaemia could contribute to the pathophysiology of POTS makes physiological sense.
POTS, however, is probably not a single disease, but rather has heterogeneous pathophysiology leading to upright thoracic hypovolaemia [7]. Thus not all patients have absolute hypovolaemia [8,9]. Recent work from our laboratory [10] proposed the measurement of peripheral blood flow to subgroup patients into low-flow, normal-flow and high-flow groups with increased, normal and decreased peripheral resistance respectively, compared with healthy volunteers. Using this scheme, we found absolute hypovolaemia in the low-flow group, but not in the other two groups [10].
Jacob and co-workers [11], studying POTS, noted a strong positive correlation between blood volume and PRA (plasma renin activity), and between PRA and plasma aldosterone. Thus hypovolaemic POTS patients had low plasma renin and aldosterone concentrations. This result is most interesting in that it seems to counter the physiological expectation for hypovolaemic states in which renin and aldosterone concentrations are commonly increased [12–14]. This observation and similar observations concerning abnormalities in the ratio of renin to aldosterone in POTS patients has been termed ‘the renin–aldosterone paradox’ in a recent study by Raj et al. [15] in which absolute hypovolaemia has been confirmed prospectively in POTS patients.
In the present study, we reaffirm our observation that low-flow POTS is specifically related to hypovolaemia and demonstrate increased plasma Ang (angiotensin) II associated with decreased PRA in low-flow POTS. We propose that excessive plasma Ang II production suppresses renin production and is a primary abnormality in a subset of POTS patients.
METHODS
Subjects
We studied 23 consecutive POTS patients aged 16–22 years (median, 18.3 years; seven male and 16 female) and ten healthy volunteers aged 16–21 years (median, 17.8 years; three male and seven female).
POTS patients were found among consecutive patients referred to our centre for symptoms of chronic orthostatic intolerance. All patients had symptoms of orthostatic intolerance lasting longer than 6 months. Orthostatic intolerance was defined by the presence of lightheadedness, migraine-like headache, chronic fatigue, neurocognitive deficits, palpitations, nausea, blurred vision, abnormal sweating and dyspnoea or sensation of heat while upright. POTS was defined by signs and symptoms of orthostatic intolerance in association with an increased in HR(heart rate) by more than 30 beats/min or to a HR exceeding 120 beats/min within 10 min of orthostasis.
The healthy control subjects comprised friends of the POTS patients of similar age to the patients. They were free from all systemic illness and had normal ECGs, echo-cardiograms and physical examinations. We excluded control subjects with a history of syncope or orthostatic intolerance.
There were no trained competitive athletes or bed-ridden subjects. No subjects were taking any medication for a minimum of 2 weeks preceding testing. Subjects were maintained on 3.5 g of NaCl for at least 3 days prior to experiments. Sodium intake, potassium intake and sympathetic activation exert important effects on measured renin, Ang and aldosterone.
Informed consent was obtained from all subjects, and all protocols were approved by the Committee for the Protection of Human Subjects (IRB) of New York Medical College.
Protocol
Tests began in a temperature-controlled room (24–26 °C) after an overnight fast. An intravenous catheter was placed in the right antecubital fossa. Following a 30 min supine acclimatization period, blood samples were removed for PRA, Ang II and aldosterone assays in the supine position only. Blood volume was then measured by the Indocyanine Green dye-dilution technique. Supine calf blood flow and Pv (venous pressure) measurements were also made. Subjects were tilted upright to 70° for a maximum of 10 min to confirm the diagnosis of POTS. BP(blood pressure)was measured continuously by finger plethysmography and HR by ECG throughout the entire experimental course.
Strain gauge measurements to determine peripheral blood flow, peripheral calf Pv and peripheral arterial resistance
Mercury in-silastic strain gauge plethysmography was used to measure calf blood flow. With the leg slightly elevated off the examination table, an occlusion cuff was placed around the lower limb 10 cm above a strain gauge attached to a Whitney-type strain gauge plethysmograph (Hokanson). Blood flow was estimated by standard venous occlusion methods [16] using rapid cuff inflation to a pressure below diastolic pressure to prevent venous outflow. Leg blood flow measurements used to subset POTS patients were measured only while supine in the resting condition. Arterial inflow in units of ml · min−1 · (100 ml of tissue)−1 was estimated as the rate of change of the rapid increase in limb cross-sectional area. We partitioned POTS patients into subgroups after the tilt test on the basis of calf blood flow. For normative purposes, we have collected calf blood flow data from over 50 control subjects spanning a number of prior research protocols [17–20]. For purposes of the present study, decreased calf blood flow was defined as <1.2 ml · min−1 · (100 ml of tissue)−1, which was the smallest calf blood flow that we have measured in control subjects. Increased calf blood flow was defined as>4.0 ml · min−1 · (100 ml of tissue)−1, which was the largest calf blood flow we have measured in the group of 50 control subjects. We defined low-flow POTS as POTS patients with calf blood flow <1.2 ml · min−1 · (100 ml of tissue)−1, high-flow POTS as POTS patients with calf blood flow >4.0 ml · min−1 · (100 ml of tissue)−1, and normal-flow POTS as POTS patients with calf blood flow ≥1.2 and ≤4.0 ml · min−1 · (100 ml of tissue)−1.
Systolic and diastolic BPs of the arm and leg were determined intermittently by oscillometry and on a beat-to- beat basis by finger plethysmography. Capacitance vessel pressure (Pv) was also assessed in the supine position after strain gauge dimension returned to baseline following blood flow measurement. Pv was measured by gradually increasing the occlusion cuff pressure until an increase in limb volume occurred. Pv so measured closely approximates invasive catheter-based measurements in humans [21]. Peripheral resistance was calculated using the formula (MAP−Pv)/resting flow, where MAP is the mean arterial pressure calculated as (systolic BP+2×diastolic BP)/3.
HR and BP monitoring
ECGs were monitored continuously. Right upper extremity BP was monitored continuously by finger plethysmography (Finometer; TMS) calibrated by brachial artery oscillometric pressure on the same arm. Leg BP was measured intermittently by oscillometry on the calf contralateral to the strain gauge and used to calculate the calf MAP. ECG and arterial pressure data were interfaced to a personal computer through an A/D converter (DataQ). These data were multiplexed with strain gauge data and were effectively synchronized.
Dye-dilution measurement of blood volume, cardiac output and total peripheral resistance
The Indocyanine Green dye-dilution technique [22], employing a non-invasive spectrophotometric finger photosensor (DDG; Nihon-Kohden), was used to estimate blood volume, cardiac output and total peripheral resistance. This technique has been verified during clinical studies [23,24]. First-pass kinetics were used to obtain cardiac output by the classical dye-dilution AUC (area under the curve) method [25]. The dye-decay curve is mono-exponential representing clearance by the liver. Once the haematocrit was measured, we extrapolated the dye-decay curve to the time of dye injection (t = 0), yielding estimated blood volume. Total peripheral resistance was estimated by dividing the MAP measured while supine in the right arm by the cardiac index.
Tilt-table testing
In all patients, POTS was confirmed by an upright tilt-table test at 70°. The diagnosis of POTS was made when there were symptoms of orthostatic intolerance coinciding with an increase in sinus HR by >30 beats/min or to a rate of >120 beats/min during the first 10 min of tilt [26,27]. For this purpose, an electrically driven tilt table (Cardiosystems 600) with a footboard was used. BP and HR were taken after a supine resting period. The subjects then underwent upright tilt to +70° for a maximum of 10 min. By design, subjects with intolerable symptoms, vasovagal faint or impending vasovagal faint defined by a decrease in BP of orthostatic intolerance would be returned to the supine position.
PRA, Ang II and aldosterone assays
Following a 30 min equilibration period, venous blood for assay purposes was collected from the catheter in the antecubital vein with subjects supine. All assays were performed by Quest Diagnostics Laboratory (Nichols Institute, San Juan Capistrano, CA, U.S.A.).
For PRA, 3 ml of plasma was collected into a tube containing EDTA. Plasma was subjected to an enzyme kinetic RIA measuring Ang I production from a known quantity of angiotensinogen (renin substrate). This was measured in incubated plasma treated with EDTA and PMSF to prevent the degradation of the generated peptide. Ang I was quantified by RIA using a clinical human renin kit. The minimal detectable activity is 0.1 ng of Ang I · ml−1 · h−1. The precision for the assay was: intra-assay, 10.0% CV (coefficient of variation) for a mean of 1.6 ng of Ang I · ml−1 · h−1; inter-assay, 14.8% CV for a mean of 5.8 ng of Ang I · ml−1 · h−1.
Serum aldosterone was collected in a test tube without anticoagulant and then centrifuged under refrigeration; 2 ml of serum was used to analyse aldosterone by RIA following extraction by column chromatography. Aldosterone sensitivity was 1 ng/dl. The intra-assay CV was 5% at a mean of 25 ng/dl, and the inter-assay CV was 6.6%.
Blood for Ang II was collected in an EDTA tube containing protease inhibitors, including 0.44 mmol/l 1,20 o-phenanthroline monohydrate, 0.12 mmol/l pepstatin and 1 mmol/l sodium p-hydroxymercuribenzoate. The sample was centrifuged and the plasma was removed. Plasma was extracted using Sep-Pak columns activated with 5 ml of sequential washes of a mixture of ethanol/water/4% acetic acid, methanol, distilled water and 4% acetic acid. After washing with acetone and water, the sample was eluted with washes of a mixture of ethanol/water/4% acetic acid. The eluted sample was reconstituted and measured by RIA (Nichols Institute, San Juan Capistrano, CA, U.S.A.). The minimum detectable level of the assay was 3.8 pg/ml (ng/l). Intra-assay CV was 4% at a mean value of 42 pg/ml; inter-assay CV was 9.3%at a mean value of 96 pg/ml. The antibody used in this kit had 100% cross-reactivity with Ang II and 70% cross-reactivity with Ang III(2–8) and Ang(3–8), but no cross-reactivity with Ang I. Values that are reported therefore do not distinguish among Ang II, Ang III and Ang(3–8) and could be designated ‘immunoreactive Ang II’.
Statistics
Tabular data concerning patient dimensions and haemodynamics measured whilst supine were compared by one-way ANOVA. Thereafter unpaired Student t-tests, corrected for multiple small samples, were used for between-group comparisons. Linear correlations were calculated using the Pearson correlation statistic. All results are reported as means ± S.E.M. Significance was defined as a P value of <0.05.
RESULTS
Subjects
Ten patients aged 16–22 years (median, 18.4 years; one male and nine female) had low-flow POTS, eight patients aged 17–21 years (median, 19 years; three male and five female) had normal-flow POTS, and five patients aged 16–20 years (median, 17.7 years; three male and two female) had high-flow POTS. We also studied ten healthy volunteers aged 16–21 years (median, 17.8 years; three male and seven female).
Supine dimensions and systemic haemodynamics
As shown in Table 1, weights, heights and computed body surface areas were not different among patients. Blood volume was decreased in low-flow POTS compared with control subjects (P<0.05). Blood volume was not different from control for normal-flow or high-flow POTS patients. Supine HR was increased in low-flow POTS patients (P<0.025), but was not different from control in normal-flow and high-flow POTS patients. MAP and haematocrit were similar for all groups.
Table 1.
Subject dimensions and haemodynamic data
| POTS
|
||||
|---|---|---|---|---|
| Controls | Low-flow | Normal-flow | High-flow | |
| Body surface area (m2) | 1.72 ± 0.04 | 1.73 ± 0.12 | 1.81 ± 0.07 | 1.69 ± 0.17 |
| Weight (kg) | 68 ± 2 | 62 ± 4 | 70 ± 4 | 63 ± 6 |
| Height (cm) | 166 ± 2 | 178 ± 9 | 172 ± 3 | 169 ± 7 |
| Normalized blood volume (litres/m2) | 2.76 ± 0.20 | 2.14 ± 0.12* | 2.86 ± 0.26 | 3.18 ± 0.26 |
| Haematocrit (%) | 41 ± 1 | 41 ± 2 | 42 ± 1 | 41 ± 0.3 |
| Supine HR (beats/min) | 68 ± 3 | 84 ± 4* | 76 ± 6 | 75 ± 11 |
| MAP (mmHg) | 78 ± 2 | 84 ± 4 | 79 ± 2 | 77 ± 2 |
| Calf Pv (mmHg) | 13 ± 1 | 18 ± 1* | 12 ± 1 | 10 ± 2 |
| Calf blood flow [ml · min−1 · (100 ml of tissue)−1] | 3.0 ± 0.4 | 0.9 ± 0.07* | 2.6 ± 0.2 | 4.9 ± 0.3* |
| Calf peripheral resistance [mmHg · ml−1 · min−1 · (100 ml of tissue)−1] | 30 ± 4 | 61 ± 10* | 26 ± 3 | 13 ± 2* |
Values are means ± S.E.M.
P <0.05 compared with controls.
By definition, calf blood flow was decreased in low-flow POTS, increased in high-flow POTS and similar to control in normal-flow POTS. Calf Pv was increased in low-flow POTS compared with control (P<0.01). As expected, calf peripheral arterial resistance was increased in low-flow POTS (P<0.001), decreased in high-flow POTS (P<0.05) and similar to control in normal-flow POTS.
Effect of upright tilting
By definition, tilt-table studies demonstrated POTS in our POTS patients. No control subjects suffered orthostatic intolerance. HR during tilt was increased in all POTS patients (127 ± 5, 116 ± 5 and 119 ± 10 beats/min in low-, normal- and high-flow POTS respectively) compared with control subjects (93 ± 3 beats/min). MAP was not substantially changed in all subjects during upright tilting (82 ± 2 mmHg in control, and 80 ± 7, 78 ± 6 and 72 ± 4 mmHg in low-, normal- and high-flow POTS respectively).
PRA, serum aldosterone and plasma Ang II
The data in their entirety for all subjects are shown in Figure 1.
Figure 1. PRA and serum aldosterone and plasma Ang II concentrations in the subjects studied.
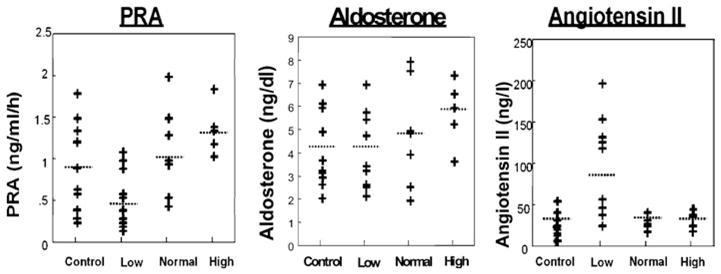
PRA was significantly decreased and Ang was increased in low-flow POTS patients compared with control subjects. Ang II concentrations appeared to follow a bimodal distribution.
PRA
PRA was similar for control (0.90 ± 0.18 ng of Ang I · ml−1 · h−1) and normal-flow (1.02 ± 0.19 ng of Ang I · ml−1 · h−1) and high-flow (1.31 ± 0.18 ng of Ang I · ml−1 · h−1) POTS. However, PRA was significantly (P<0.05) decreased in low-flow POTS (0.49 ± 0.12 ng of Ang I · ml−1 · h−1) compared with control and appeared to segregate into two groups, although this did not reach statistical significance in the present study (Figure 1).
Aldosterone
No significant difference in aldosterone was observed among the groups. Serum aldosterone was 4.2 ± 0.6 ng/dl in control subjects compared with 4.2 ± 0.0.6, 4.9 ± 0.0.8 and 5.9 ± 0.0.9 ng/dl in low-, normal- and high-flow POTS respectively.
Ang II
Plasma Ang II was similar in control (32 ± 4 ng/l) and normal-flow (33 ± 4 ng/l) and high-flow (31 ± 5 ng/l) POTS. Ang II was significantly (P<0.01) increased in low-flow POTS (89 ± 20 ng/l) compared with control subjects and again appeared to segregate into two groups, one group with normal Ang II and the other group with markedly increased Ang II, although this did not reach statistical significance in the present study.
Correlations between PRA, blood volume, serum aldosterone and plasma Ang II in POTS patients
Serum aldosterone and PRA
Figure 2 shows that there was a positive correlation between renin (as determined by PRA) and serum aldosterone across the groups (r = +0.71). Thus aldosterone increased with renin in all POTS patients.
Figure 2. Relationship between serum aldosterone and PRA.
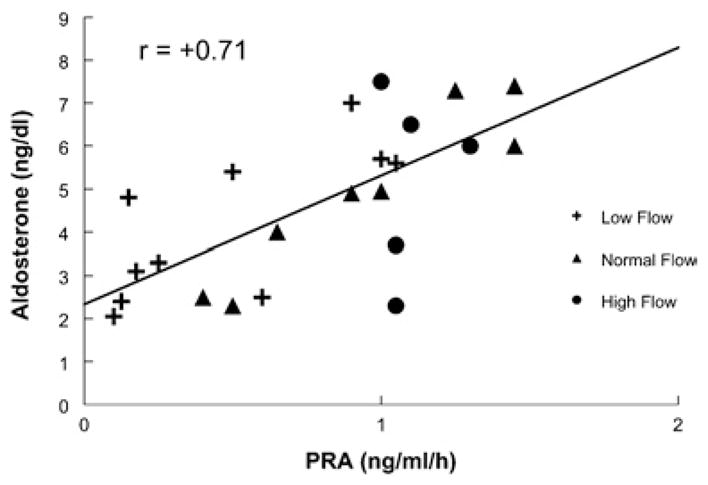
There was a positive correlation between renin and aldosterone across all groups.
Blood volume and PRA
Figure 3 shows that blood volume and PRA were negatively correlated (r = −0.72) in normal-flow and high-flow POTS patients, but positively correlated (r = +0.65) in the low-flow group.
Figure 3. Relationship between blood volume and PRA.
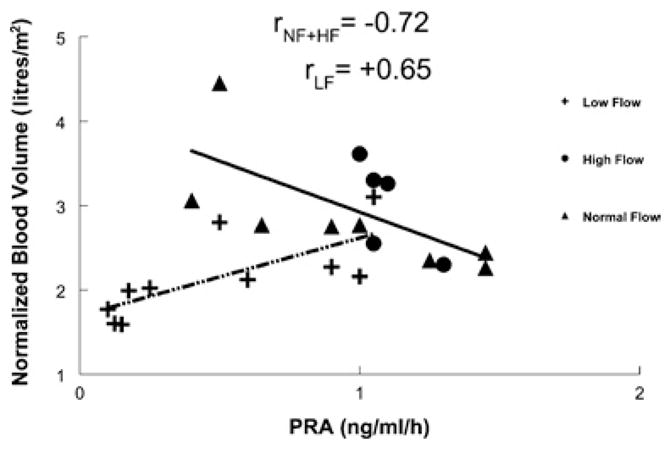
There was a positive correlation between blood volume and PRA for low-flow POTS (dotted/dashed line). There was a negative correlation between PRA for normal-flow and high-flow POTS (solid line).
Ang II and PRA
A significant positive correlation (r = +0.76) between PRA and Ang II in normal-flow and high-flow POTS patients was observed (Figure 4); however, a significant negative correlation (r = −0.83) was observed in the low-flow POTS group.
Figure 4. Relationship between Ang II concentration determined by RIA and PRA.
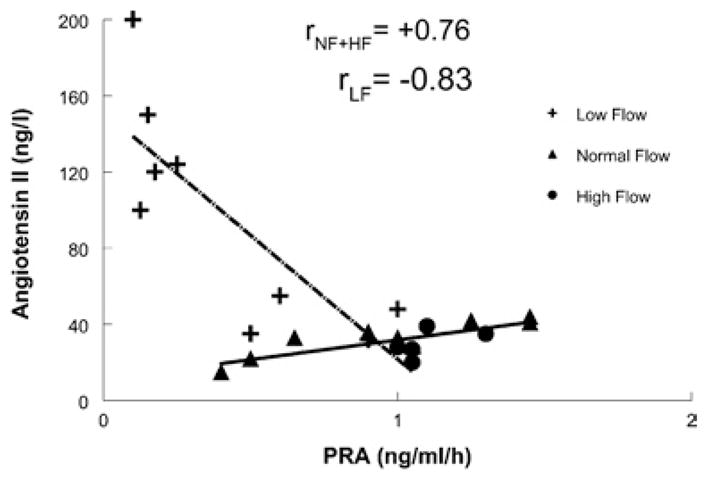
There was a significant negative correlation between plasma Ang II concentration and PRA for low-flow POTS (dotted/dashed line). There was a positive correlation between PRA and plasma Ang II concentration for normal-flow and high-flow POTS (solid line).
Blood volume and Ang II
Figure 5 shows that blood volume and plasma Ang II were negatively correlated (r = −0.66) in normal-flow and high-flow POTS patients. The low-flow group fell into two subgroups. One subgroup, comprising half of the low-flow patients characterized by abnormally increased Ang II, had low blood volume. In these patients, blood volume was low, but was not correlated with the concentration of the peptide. The other half of the low-flow group had blood volume–Ang II correlations which were similar to those observed in normal- flow and high-flow POTS patients.
Figure 5. Relationship between blood volume and Ang II concentration determined by RIA.
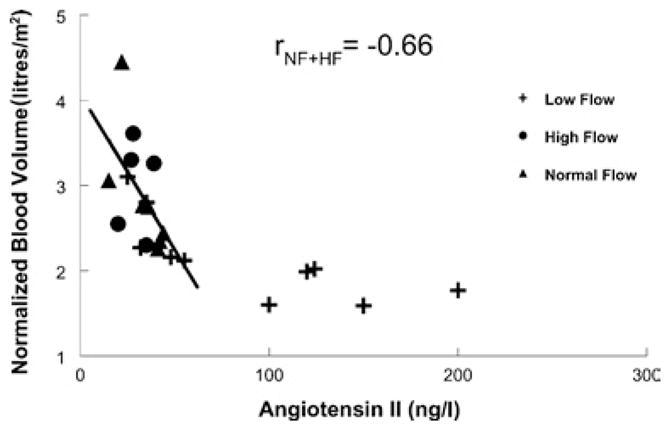
There was a significant negative correlation between blood volume and plasma Ang II concentration for normal-flow and high-flow POTS (solid line). Low-flow POTS patients segregated into two subgroups: those with increased plasma Ang II concentration being at low blood volumes with little linear relationship between the variables, whereas those with Ang II within the usual normal range fall on the ‘normal-flow’ regression line.
DISCUSSION
The results of the present study complement the work performed by Jacob et al. [28] and Raj et al. [29]. A subset of POTS patients are significantly hypovolaemic, and hypovolaemia is ‘paradoxically’ associated with hyporeninaemia and hypoaldosteronaemia. In the present study, we link hyporeninaemia to a specific subset of low-flow POTS patients with increased plasma Ang II and reduced blood volume.
The RAAS (renin–Ang–aldosterone system) is a fundamental regulator of plasma volume. In the classic paradigm, hypovolaemia, through effects on renal blood flow, increases renin which enzymatically acts on its substrate angiotensinogen to produce Ang I. Ang I is converted via systemic or locally acting ACE (Ang-converting enzyme) into Ang II. Ang II binds to AT-1 (Ang II type 1) receptors within the adrenal cortex leading to increased secretion of aldosterone [30]. Ang II is part of a control loop with feedback inhibition of renin production [31,32]. Thus increased exogenous or endogenous plasma concentrations of Ang II suppress the release and expression of renin. This is suggested by the results shown in Figure 4 in which, for low-flow POTS patients only, an inverse relationship between Ang II and renin is depicted. However, typically renin drives Ang II production leading to positive correlation of plasma activity, as in normal-flow and high-flow POTS. Even among low-flow POTS patients, some patients have renin, aldosterone, Ang II and even blood volume which are not different from controls. It might be argued, however, that in many of these subjects normal renin–Ang–aldosterone concentrations could still be unexpected, given hypovolaemia.
Increased circulating Ang II should increase serum aldosterone unless there is a specific problem with adrenal AT-1 receptors or sodium loading. Direct reduction of adrenal responsiveness may occur during chronically elevated Ang II [33] in which there can be down-regulation of Ang II receptors [34]. This could result in important sodium-independent blunting of Ang II-mediated aldosterone secretion, but this remains speculative [35]. Nevertheless, there is evidence for differential regulation of adrenal glomerulosa AT-1 receptors [36,37]. The findings observed in our patients may be consistent with down-regulation of adrenal AT-1 receptors and up-regulation or no change in lower limb AT-1 receptors. Further studies are required to evaluate the regulation of the AT-1 receptors in the adrenal and lower limb in POTS patients.
On the one hand, hypovolaemia would seem to be the consequence of the disturbance in the RAAS and is a result, rather than a cause, of pathophysiological disturbance. On the other hand, hypovolaemia may participate in overall reflex sympathetic activation and parasympathetic withdrawal observed in POTS [38].
Decreased peripheral blood flow and increased Ang II in low-flow POTS makes sense through the direct vasoconstrictive actions of Ang II by binding to AT-1 receptors on smooth muscle [39]. In addition, Ang II can exert potent indirect effects on vasoconstriction through its potentiating effects on the sympathetic nervous system [40]. Specifically, Ang II can increase the release of noradrenaline (norepinephrine) from ganglionic [41] and postganglionic [42] sympathetic nerves. Also, importantly, Ang II promotes oxidative stress [43–45] by causing the formation of superoxide radical through its effects on NADPH oxidase [43]. Superoxide binds NO (nitric oxide) forming peroxynitrite, which may exert important oxidative actions [46]. The interaction with superoxide reduces the bioavailable NO with important vasoconstrictive consequences [47] as well as effects on endothelial cell activation, which are beyond the scope of the present discussion. Preliminary data from our laboratory [48], using the local heating response method described by Kellogg [49] and Minson [50] as a stimulus for NO production, has demonstrated reduced bioavailable NO in low-flow POTS patients only.
Why are low-flow POTS patients not hypertensive? Like others with increased Ang II, they have increased peripheral resistance; however, unlike others, they have reduced cardiac output [7] perhaps related to absolute hypovolaemia and decreased cardiac preload. The reduction in cardiac output is sufficient to maintain normotension in younger low-flow POTS patients; sometimes postural hypotension occurs when venous return is reduced further during upright posture. Notably, as our experimental group has aged and as we have had the opportunity to observe several low-flow POTS patients longitudinally with time, we have observed the emergence of hypertension particularly when upright (J.M. Stewart, unpublished work). This is consistent with the observations of postural hypertension by other investigators in all adult study populations [51].
Limitations
An alternative to increased Ang II is increased Ang fragments or other Ang species. The RIA used in the present study has substantial cross-reactivity with Ang III, but no cross reactivity with Ang I. Although Ang II is the predominate peptide in the circulation in humans under ordinary circumstances, we cannot at this time guarantee that this is true in POTS patients. Therefore, in the future, we will perform HPLC analyses of Ang II samples.
A primary limitation of the present study is the lack of research unit facilities to strictly control sodium and potassium intake prior to study. Our patients often live at a distance from the Medical Center and we have no such General Clinical Research Unit. Sodium can alter RAAS activation and also blood volume [52]. Although routine laboratory data for serum potassium and sodium were normal in all POTS patients, this does not obviate the need for controlled intake. However, control subjects had PRA and serum aldosterone and plasma Ang II concentrations that were consistent with laboratory standards. Also, it is known that Ang II stimulates thirst and sodium intake [53]. Thus it is likely that fluid volume is increased, not decreased, by increased Ang II, yet we still measured reduced blood volume consistent with other published results.
In addition, there are extensive interactions of the RAAS with the sympathetic nervous system with other neurohumoral modulators, such as ANP (atrial natriuretic peptide) and vasopressin, as well as central nervous system functions that are beyond the scope of present investigation.
Finally, most of our conclusions regarding Ang in low-flow POTS are based on findings in five subjects with increased Ang II and low blood volume. The other five low-flow POTS subjects behaved much like normal-flow POTS patients. The five patients tended to be more tachycardic (P = 0.08). We speculate that other low-flow patients represent one end of the normal distribution in terms of peripheral blood flow and may be substantially the same in terms of physiology as the normal-flow group. There is indeed a grey area in the use of peripheral blood flow as a sole means for distinguishing physiology among POTS patients. One might argue that it makes better sense to subdivide patients on the basis of high and low Ang.
Acknowledgments
This work was supported by 1RO1HL66007 and 1RO1HL074873 from National Heart Lung and Blood Institute of the National Institutes of Health. We also acknowledge the invaluable assistance of Professor K. Bridget Brosnihan (Professor of Surgical Sciences and Director of the Hypertension Core Laboratory, Wake Forest University School of Medicine, Winston-Salem, NC, U.S.A.).
Abbreviations
- Ang
angiotensin
- AT-1
Ang II type 1
- BP
blood pressure
- CV
coefficient of variation
- MAP
mean arterial pressure
- NO
nitric oxide
- POTS
postural tachycardia syndrome
- PRA
plasma renin activity
- Pv
venous pressure
- RAAS
renin–Ang–aldosterone system
References
- 1.Robertson D. The epidemic of orthostatic tachycardia and orthostatic intolerance. Am J Med Sci. 1999;317:75–77. doi: 10.1097/00000441-199902000-00001. [DOI] [PubMed] [Google Scholar]
- 2.Fouad FM, Tadena-Thome L, Bravo EL, Tarazi RC. Idiopathic hypovolemia. Ann Intern Med. 1986;104:298–303. doi: 10.7326/0003-4819-104-3-298. [DOI] [PubMed] [Google Scholar]
- 3.Jacob G, Biaggioni I, Mosqueda-Garcia R, Robertson RM, Robertson D. Relation of blood volume and blood pressure in orthostatic intolerance. Am J Med Sci. 1998;315:95–100. doi: 10.1097/00000441-199802000-00005. [DOI] [PubMed] [Google Scholar]
- 4.Kimmerly DS, Shoemaker JK. Hypovolemia and neurovascular control during orthostatic stress. Am J Physiol Heart Circ Physiol. 2002;282:H645–H655. doi: 10.1152/ajpheart.00535.2001. [DOI] [PubMed] [Google Scholar]
- 5.Jacob G, Shannon JR, Black B, et al. Effects of volume loading and pressor agents in idiopathic orthostatic tachycardia. Circulation. 1997;96:575–580. doi: 10.1161/01.cir.96.2.575. [DOI] [PubMed] [Google Scholar]
- 6.Freitas J, Santos R, Azevedo E, Costa O, Carvalho M, de Freitas AF. Clinical improvement in patients with orthostatic intolerance after treatment with bisoprolol and fludrocortisone. Clin Auton Res. 2000;10:293–299. doi: 10.1007/BF02281112. [DOI] [PubMed] [Google Scholar]
- 7.Stewart JM, Montgomery LD. Regional blood volume and peripheral blood flow in postural tachycardia syndrome. Am J Physiol Heart Circ Physiol. 2004;287:H1319–H1327. doi: 10.1152/ajpheart.00086.2004. [DOI] [PMC free article] [PubMed] [Google Scholar]
- 8.Jacob G, Biaggioni I. Idiopathic orthostatic intolerance and postural tachycardia syndromes. Am J Med Sci. 1999;317:88–101. doi: 10.1097/00000441-199902000-00003. [DOI] [PubMed] [Google Scholar]
- 9.Jacob G, Costa F, Shannon JR, et al. The neuropathic postural tachycardia syndrome. N Engl J Med. 2000;343:1008–1014. doi: 10.1056/NEJM200010053431404. [DOI] [PubMed] [Google Scholar]
- 10.Stewart JM, Montgomery LD. Regional blood volume and peripheral blood flow in postural tachycardia syndrome. Am J Physiol Heart Circ Physiol. 2004;287:H1319–H1327. doi: 10.1152/ajpheart.00086.2004. [DOI] [PMC free article] [PubMed] [Google Scholar]
- 11.Jacob G, Robertson D, Mosqueda-Garcia R, Ertl AC, Robertson RM, Biaggioni I. Hypovolemia in syncope and orthostatic intolerance role of the renin-angiotensin system. Am J Med. 1997;103:128–133. doi: 10.1016/s0002-9343(97)00133-2. [DOI] [PubMed] [Google Scholar]
- 12.Groza P, Boros I, Militaru M, et al. Renin and aldosterone reactions after acute hemorrhage. Physiologie. 1988;25:105–110. [PubMed] [Google Scholar]
- 13.Skillman JJ, Lauler DP, Hickler RB, et al. Hemorrhage in normal man: effect on renin, cortisol, aldosterone, and urine composition. Ann Surg. 1967;166:865–885. doi: 10.1097/00000658-196712000-00001. [DOI] [PMC free article] [PubMed] [Google Scholar]
- 14.Blair-West JR, Brook AH, Simpson PA. Renin responses to water restriction and rehydration. J Physiol. 1972;226:1–13. doi: 10.1113/jphysiol.1972.sp009970. [DOI] [PMC free article] [PubMed] [Google Scholar]
- 15.Raj SR, Biaggioni I, Yamhure PC, et al. Renin-aldosterone paradox and perturbed blood volume regulation underlying postural tachycardia syndrome. Circulation. 2005;111:1574–1582. doi: 10.1161/01.CIR.0000160356.97313.5D. [DOI] [PubMed] [Google Scholar]
- 16.Greenfield AD, Whitney RJ, Whitney RJ. Methods for the investigation of peripheral blood flow. Br Med Bull. 1963;19:101–109. doi: 10.1093/oxfordjournals.bmb.a070026. [DOI] [PubMed] [Google Scholar]
- 17.Stewart JM. Pooling in chronic orthostatic intolerance: arterial vasoconstrictive but not venous compliance defects. Circulation. 2002;105:2274–2281. doi: 10.1161/01.cir.0000016348.55378.c4. [DOI] [PubMed] [Google Scholar]
- 18.Stewart JM, Medow MS, Montgomery LD. Local vascular responses affecting blood flow in postural tachycardia syndrome. Am J Physiol Heart Circ Physiol. 2003;285:H2749–H2756. doi: 10.1152/ajpheart.00429.2003. [DOI] [PubMed] [Google Scholar]
- 19.Stewart JM. Microvascular filtration is increased in postural tachycardia syndrome. Circulation. 2003;107:2816–2822. doi: 10.1161/01.CIR.0000070951.93566.FC. [DOI] [PubMed] [Google Scholar]
- 20.Stewart JM, Montgomery LD. Regional blood volume and peripheral blood flow in postural tachycardia syndrome. Am J Physiol Heart Circ Physiol. 2004;287:H1319–H1327. doi: 10.1152/ajpheart.00086.2004. [DOI] [PMC free article] [PubMed] [Google Scholar]
- 21.Christ F, Gamble J, Baschnegger H, Gartside IB. Relationship between venous pressure and tissue volume during venous congestion plethysmography in man. J Physiol. 1997;503:463–467. doi: 10.1111/j.1469-7793.1997.463bh.x. [DOI] [PMC free article] [PubMed] [Google Scholar]
- 22.Bloomfield DA. Dye Curves: The Theory and Practice of Indicator Dye Dilution. University Park Press; Baltimore, MD: 1974. [Google Scholar]
- 23.He YL, Tanigami H, Ueyama H, Mashimo T, Yoshiya I. Measurement of blood volume using indocyanine green measured with pulse-spectrophotometry: its reproducibility and reliability. Crit Care Med. 1998;26:1446–1451. doi: 10.1097/00003246-199808000-00036. [DOI] [PubMed] [Google Scholar]
- 24.Iijima T, Aoyagi T, Iwao Y, et al. Cardiac output and circulating blood volume analysis by pulse dye-densitometry. J Clin Monit. 1997;13:81–89. doi: 10.1023/a:1007339924083. [DOI] [PubMed] [Google Scholar]
- 25.Stewart GN. Researches on the circulation time and on the influences which affect it. IV The output of the heart. J Physiol. 1897;22:159. doi: 10.1113/jphysiol.1897.sp000684. [DOI] [PMC free article] [PubMed] [Google Scholar]
- 26.Low PA, Opfer-Gehrking TL, Textor SC, et al. Postural tachycardia syndrome (POTS) Neurology. 1995;45:S19–S25. [PubMed] [Google Scholar]
- 27.Sandroni P, Opfer-Gehrking TL, McPhee BR, Low PA. Postural tachycardia syndrome: clinical features and follow-up study. Mayo Clin Proc. 1999;74:1106–1110. doi: 10.4065/74.11.1106. [DOI] [PubMed] [Google Scholar]
- 28.Jacob G, Robertson D, Mosqueda-Garcia R, Ertl AC, Robertson RM, Biaggioni I. Hypovolemia in syncope and orthostatic intolerance role of the renin-angiotensin system. Am J Med. 1997;103:128–133. doi: 10.1016/s0002-9343(97)00133-2. [DOI] [PubMed] [Google Scholar]
- 29.Raj SR, Biaggioni I, Yamhure PC, et al. Renin-aldosterone paradox and perturbed blood volume regulation underlying postural tachycardia syndrome. Circulation. 2005;111:1574–1582. doi: 10.1161/01.CIR.0000160356.97313.5D. [DOI] [PubMed] [Google Scholar]
- 30.Nussey SS, Whitehead SA. Endocrinology: An Integrated Approach. BIOS Scientific Publishers; Oxford: 2001. [PubMed] [Google Scholar]
- 31.Kammerl MC, Richthammer W, Kurtz A, Kramer BK. Angiotensin II feedback is a regulator of renocortical renin, COX-2, and nNOS expression. Am J Physiol Regulatory Integrative Comp Physiol. 2002;282:R1613–R1617. doi: 10.1152/ajpregu.00464.2001. [DOI] [PubMed] [Google Scholar]
- 32.Shricker K, Holmer S, Kramer BK, Riegger GA, Kurtz A. The role of angiotensin II in the feedback control of renin gene expression. Pflugers Arch. 1997;434:166–172. doi: 10.1007/s004240050379. [DOI] [PubMed] [Google Scholar]
- 33.Enyedi P, Szabo B, Spat A. Reduced responsiveness of glomerulosa cells after prolonged stimulation with angiotensin II. Am J Physiol. 1985;248:E209–E214. doi: 10.1152/ajpendo.1985.248.2.E209. [DOI] [PubMed] [Google Scholar]
- 34.Ouali R, Berthelon MC, Begeot M, Saez JM. Angiotensin II receptor subtypes AT1 and AT2 are down-regulated by angiotensin II through AT1 receptor by different mechanisms. Endocrinology. 1997;138:725–733. doi: 10.1210/endo.138.2.4952. [DOI] [PubMed] [Google Scholar]
- 35.Spat A, Hunyady L. Control of aldosterone secretion: a model for convergence in cellular signaling pathways. Physiol Rev. 2004;84:489–539. doi: 10.1152/physrev.00030.2003. [DOI] [PubMed] [Google Scholar]
- 36.Richard DE, Laporte SA, Bernier SG, Leduc R, Guillemette G. Desensitization of AT1 receptor-mediated cellular responses requires long term receptor down-regulation in bovine adrenal glomerulosa cells. Endocrinology. 1997;138:3828–3835. doi: 10.1210/endo.138.9.5409. [DOI] [PubMed] [Google Scholar]
- 37.Wang DH, Elijovich F. Modulation and function of extrarenal angiotensin receptors. Cell Biochem Biophys. 1999;31:1–17. doi: 10.1007/BF02738152. [DOI] [PubMed] [Google Scholar]
- 38.Stewart JM. Autonomic nervous system dysfunction in adolescents with postural orthostatic tachycardia syndrome and chronic fatigue syndrome is characterized by attenuated vagal baroreflex and potentiated sympathetic vasomotion. Pediatr Res. 2000;48:218–226. doi: 10.1203/00006450-200008000-00016. [DOI] [PubMed] [Google Scholar]
- 39.Touyz RM, Schiffrin EL. Signal transduction mechanisms mediating the physiological and pathophysiological actions of angiotensin II in vascular smooth muscle cells. Pharmacol Rev. 2000;52:639–672. [PubMed] [Google Scholar]
- 40.Brooks VL. Interactions between angiotensin II and the sympathetic nervous system in the long-term control of arterial pressure. Clin Exp Pharmacol Physiol. 1997;24:83–90. doi: 10.1111/j.1440-1681.1997.tb01788.x. [DOI] [PubMed] [Google Scholar]
- 41.Ma X, Chapleau MW, Whiteis CA, Abboud FM, Bielefeldt K. Angiotensin selectively activates a subpopulation of postganglionic sympathetic neurons in mice. Circ Res. 2001;88:787–793. doi: 10.1161/hh0801.089542. [DOI] [PubMed] [Google Scholar]
- 42.Aileru AA, Logan E, Callahan M, Ferrario CM, Ganten D, Diz DI. Alterations in sympathetic ganglionic transmission in response to angiotensin II in (mRen2)27 transgenic rats. Hypertension. 2004;43:270–275. doi: 10.1161/01.HYP.0000112422.81661.f3. [DOI] [PubMed] [Google Scholar]
- 43.Harrison DG, Cai H, Landmesser U, Griendling KK. Interactions of angiotensin II with NAD(P)H oxidase, oxidant stress and cardiovascular disease. J Renin Angiotensin Aldosterone Syst. 2003;4:51–61. doi: 10.3317/jraas.2003.014. [DOI] [PubMed] [Google Scholar]
- 44.Schiffrin EL, Touyz RM. Inflammation and vascular hypertrophy induced by angiotensin II: role of NADPH oxidase-derived reactive oxygen species independently of blood pressure elevation? Arterioscler, Thromb, Vasc Biol. 2003;23:707–709. doi: 10.1161/01.ATV.0000069907.12357.7E. [DOI] [PubMed] [Google Scholar]
- 45.Seshiah PN, Weber DS, Rocic P, Valppu L, Taniyama Y, Griendling KK. Angiotensin II stimulation of NAD(P)H oxidase activity: upstream mediators. Circ Res. 2002;91:406–413. doi: 10.1161/01.res.0000033523.08033.16. [DOI] [PubMed] [Google Scholar]
- 46.Pueyo ME, Arnal JF, Rami J, Michel JB. Angiotensin II stimulates the production of NO and peroxynitrite in endothelial cells. Am J Physiol. 1998;274:C214–C220. doi: 10.1152/ajpcell.1998.274.1.C214. [DOI] [PubMed] [Google Scholar]
- 47.Laight DW, Kaw AV, Carrier MJ, Anggard EE. Interaction between superoxide anion and nitric oxide in the regulation of vascular endothelial function. Br J Pharmacol. 1998;124:238–244. doi: 10.1038/sj.bjp.0701814. [DOI] [PMC free article] [PubMed] [Google Scholar]
- 48.Medow MS, Minson CT, Stewart JM. Decreased microvascular nitric oxide-dependent vasodilation in postural tachycardia syndrome. Circulation. 2005;112:2611–2618. doi: 10.1161/CIRCULATIONAHA.104.526764. [DOI] [PMC free article] [PubMed] [Google Scholar]
- 49.Kellogg DL, Crandall CG, Liu Y, Charkoudian N, Johnson JM. Nitric oxide and cutaneous active vasodilation during heat stress in humans. J Appl Physiol. 1998;85:824–829. doi: 10.1152/jappl.1998.85.3.824. [DOI] [PubMed] [Google Scholar]
- 50.Minson CT, Berry LT, Joyner MJ. Nitric oxide and neurally mediated regulation of skin blood flow during local heating. J Appl Physiol. 2001;91:1619–1626. doi: 10.1152/jappl.2001.91.4.1619. [DOI] [PubMed] [Google Scholar]
- 51.Novak V, Spies JM, Novak P, McPhee BR, Rummans TA, Low PA. Hypocapnia and cerebral hypoperfusion in orthostatic intolerance. Stroke. 1998;29:1876–1881. doi: 10.1161/01.str.29.9.1876. [DOI] [PubMed] [Google Scholar]
- 52.Kunita H, Obara T, Komatsu T, Hata S, Okamoto M. The effects of dietary sodium on the diurnal activity of the renin-angiotensin-aldosterone system and the excretion of urinary electrolytes. J Clin Endocrinol Metab. 1976;43:756–759. doi: 10.1210/jcem-43-4-756. [DOI] [PubMed] [Google Scholar]
- 53.Fitzsimons JT. Angiotensin, thirst, and sodium appetite. Physiol Rev. 1998;78:583–686. doi: 10.1152/physrev.1998.78.3.583. [DOI] [PubMed] [Google Scholar]