

Abstract
Organisms use a variety of strategies to adapt to their environments and maximize long-term growth potential, but quantitative characterization of the benefits conferred by the use of such strategies, as well as their impact on the whole population’s rate of growth, remains challenging. Here, we use a path-integral framework that describes how selection acts on lineages –i.e. the life-histories of individuals and their ancestors– to demonstrate that lineage-based measurements can be used to quantify the selective pressures acting on a population. We apply this analysis to E. coli bacteria exposed to cyclical treatments of carbenicillin, an antibiotic that interferes with cell-wall synthesis and affects cells in an age-dependent manner. While the extensive characterization of the life-history of thousands of cells is necessary to accurately extract the age-dependent selective pressures caused by carbenicillin, the same measurement can be recapitulated using lineage-based statistics of a single surviving cell. Population-wide evolutionary pressures can be extracted from the properties of the surviving lineages within a population, providing an alternative and efficient procedure to quantify the evolutionary forces acting on a population. Importantly, this approach is not limited to age-dependent selection, and the framework can be generalized to detect signatures of other trait-specific selection using lineage-based measurements. Our results establish a powerful way to study the evolutionary dynamics of life under selection, and may be broadly useful in elucidating selective pressures driving the emergence of antibiotic resistance and the evolution of survival strategies in biological systems.
The theory of natural selection is based on the concept of fitness, which quantifies an organism’s ability to reproduce and transmit its genetic information to its offspring [1]. The fitness of an organism, however, is notably difficult to measure directly [2–4], especially when the selective pressure is weak or depends indirectly on an organism’s phenotype and external environment. In microorganisms, conventional measures of fitness typically rely on the instantaneous growth rate in a constant environment, but this approach fails to provide a complete measure of fitness that accounts for natural environmental fluctuations [5–7]. In order to optimally respond to unstable environments, cells have to optimize the fitness tradeoffs involved in the use of strategies –such as phase variation [8], phenotypic switching [9], or epigenetic inheritability [10]– which stochastically generate heterogeneity within the population at typically low rate to adapt to changing environments [11–13]. While traditional approaches to determine the fitness of a species can involve the analysis of population-wide properties (e.g. coalescence statistics [14], the variance of a trait in a population [15], or the rate of allele growth [16]), precise characterization of selection forces remains challenging. This challenge is compounded by the importance of life-history traits, i.e. the dependence of growth rates and survival on organisms’ ages and reproductive history [17–19]. Unless every reproduction and death event within a population is monitored for extended periods of time to account for low-probability events, an explicit and sensitive measure of selection is rarely obtained in biological systems.
Here, we propose a method to determine an organism’s fitness that relies on the distribution of properties of lineages – i.e. the full history of a cell and of its ancestors – to extract the evolutionary pressures affecting a population. In the lineage formulation, a population is viewed as a collection of histories that reproduce and evolve over time [20]. As we discuss below, due to exponential growth, the set of lineages present at any given time in a population (i.e. the surviving lineages) exhibit a statistical distribution that maximizes fitness over the entire collection of possible lineages according to a variational principle. These optimal lineages balance a trade-off between (a) increasing their numbers by using individuals with more offspring than expected, and (b) decreasing their numbers by trading the more numerous, typical individuals for the rare, high-performing individuals. This optimization occurs automatically, given sufficient time, in any continuously proliferating population and yields surviving lineages with a statistical distribution that differs from that of typical individuals in isolation.
Remarkably, we find that a few of those surviving lineages provide sufficient information to determine the selective forces acting on the whole population. This result may seem particularly surprising, especially because the fitness of individuals that contribute to surviving lineages deviates substantially from that of typical individuals observed independently within the population. For example, individuals that die do not contribute to surviving lineages, yet mortality is a key determinant of fitness that seemingly should require explicit measurement. Likewise, individuals that by chance reproduce more often than others might be overrepresented in surviving lineages compared to their frequency in isolation.
In this article, we show that while surviving lineages provide information about only a small fraction of all individuals in the population, they possess a statistical distribution which can be used to precisely infer selective forces and their magnitude. Importantly, we demonstrate that the under-representation of certain individuals (e.g. those that die) along a lineage is as informative as the over-representation of others. For example, absence of individuals above a certain age along lineages can be used to deduce a sharp decline in reproductive capacity with age (due to the combined effects of mortality and fecundity). In contrast, deducing the same using the conventional approach without lineages would require significantly more data: one would need to observe many individuals that aged and did not reproduce, whereas along a lineage their absence is by itself highly informative.
We apply the lineage approach to infer the life-history traits of E. coli bacteria subjected to cyclical antibiotic treatments. Before describing our main results, we first review in the next sections the basic theory connecting lineage analysis and life-history traits (see [21] for further details).
Life-History Traits and Strength of Selection
Our analysis will examine two basic life-history traits, both of which are functions of the age x of an organism: the survival function, ℓ(x), which is the probability that an individual reaches age x, and the age-dependent reproduction rate, b(x), also known as fecundity, which is the rate of offspring production at age x [22]. The product of these two functions is called the reproductive function k(x)= ℓ(x)b(x), and it specifies the total reproductive output of individuals at age x [23]. We define κ(x) ≡ k′(x)/k(x), which measures how quickly the reproductive rates change as a function of age; e.g. if fecundity is constant at all ages, then κ(x) represents the age-specific mortality.
Quantifying these life-history traits provides detailed information on the reproductive potential of individuals (i.e. their fitness). However, information about the the fitness of an organism alone cannot predict which features of the life-history are under the strongest evolutionary pressures within a population. Measuring the strength of selection acting on life-history traits requires further analysis.
Hamilton formulated an elegant approach, using the sensitivity of the population’s long-term growth rate, Λ, to changes in ℓ(x) and b(x) to measure selection strength [24]. The quantity δΛ/δh(x) measures the impact on the population’s growth rate of a small change in a life-history trait h acting at age x, and provides a direct link between the behavior of individual cells and the population-wide properties of a biological system. As an example of this formalism, consider two small boosts in the trait, δh(x1) and δh(x2), which have the same magnitude but affect individuals at age x1 and x2, respectively (Fig. 1a). This change in fitness may result from mutation, an epigenetic modification, a different survival strategy, etc. Each δh affects two different classes of individuals and, as a consequence, may have a very different impact on the population’s overall growth rate δΛ (Fig. 1b–c). The impact of these small boosts in fitness will depend on the relative contribution of the targeted subpopulation to the population’s overall growth. For example, decreasing infant mortality in human populations has a much greater impact on a country’s population growth rate than prolonging life-expectancy of individuals past reproductive age. In practice, Hamilton’s sensitivity analysis yields a formula for computing δΛ/δh(x), given precise measurements of life-history traits on a sufficiently large sample of individuals [23].
FIG. 1.
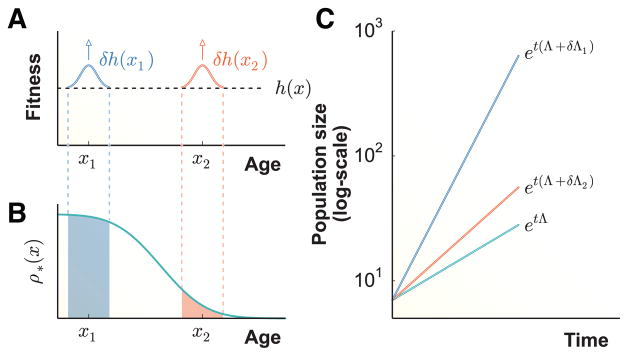
Strength of selection on life-history traits and the optimal lineage relation. a) A behavioral change (e.g. a mutation, an epigenetic modification, or a different survival strategy) causes a small increase in a life-history trait δh(xi) for cells at age xi. b) At steady-state growth after sufficiently long time, a population is dominated by cells whose ancestral lineage has an optimal age distribution ρ*(x). The distribution ρ* determines what portion of lineages benefit from the small boosts in fitness at ages x1 and x2. c) The change in growth rate δΛ resulting from the boost in fitness at age xi is precisely equal to δh · ρ* evaluated at xi. In this example, the change in growth rate is larger at age x1 because it affects a larger fraction of the population’s lineage history.
We next show how lineage analysis provides a much more direct measurement of Hamilton’s strength of selection, and uses the population’s dynamics as a whole to infer the sensitivities.
Lineage Dynamics and the Optimal Lineage Relation
We consider a growing asexual population consisting of individuals that reproduce and survive according to given life-history parameters b(x) and ℓ(x). At any given time t > 0, each individual in the population can be traced back to the initial cell present at time 0, and its lineage of ancestral cells can be recorded. Such lineage tracing analysis yields a function σ(t′), which specifies the age of the ancestral cells at each point in time t′ < t along the lineage. Each time a new ancestral cell is born along the lineage, the value of σ(t′) jumps back to zero. Since the set of all possible lineages in a population is astronomically large, for analysis purposes it is useful to coarse grain lineages into large groups. For life-history traits such as l(x) and b(x) that depend on age alone, and do not depend on the precise order of reproduction events in a lineage, one can group lineages by their lineage age distribution, ρ(x), which specifies the frequency of age x along a lineage. For each value of ρ, there exists a large number of distinct lineages having ρ as their lineage age distribution; their number grows exponentially with time with a rate s(ρ). This exponential growth is purely entropic, i.e. due to the increasingly large number of possible lineages as the total time increases – we call s(ρ) the lineage entropy. Moreover, due to reproduction and differential survival, the frequency of each distinct lineage grows (or declines) in the population exponentially at a rate which we call the lineage fitness, f(ρ). Together, this implies that the number of cells in the population that have lineage age distribution ρ is given by ets(ρ)etf(ρ).
Next, we consider the total size of a population N(t) by summing over all possible values of the distribution ρ. We obtain
| (1) |
where the integral is carried out by summing over all the possible age distributions ρ. This path-integral expression provides a key intuition about the population’s lineage structure. As the total time t increases, lineages with age distribution ρ that maximize s(ρ)+ f(ρ) will exponentially outcompete all other lineages. These optimal lineages therefore dominate the population at long times; we call their associated age distribution ρ*. By the same reasoning, equation (1) also shows that the long-term growth rate of the population, Λ ≡ (1/t) log N(t), is equal to s(ρ*)+ f(ρ*). In fact, it is possible to calculate explicitly the lineage entropy and fitness, and maximize their sum over all possible ρ to find ρ* as a function of life-history parameters [21]. And, inverting the relationship, one can infer the life-history traits by measuring the lineage age distribution ρ* (see below). Using our experimental data, we will show that this procedure provides very accurate measurements using a relatively small amount of lineage data.
More than just a convenient tool, the lineage formulation makes deep connections between life-history analysis and evolutionary theory. In particular, it shows that Hamilton’s sensitivity measure is fully determined by the optimal lineages [21], in the following way:
| (2) |
Remarkably, this relation states that the change in long-term growth rate that would result from the specified change in life-history traits is in fact already imprinted in the optimal lineage distribution – it is simply the observed frequency of the given age along an optimal lineage. Moreover, this sensitivity, which reports on trait-specific selection acting on the entire population is determined by a measurement made along a single optimal lineage. Using this relationship, any other sensitivity, such as e.g. δΛ/δℓ(x), can be determined [21].
In experiments, measuring the optimal lineage age distribution may be challenging, as very few organisms possess a lineage distribution equal to ρ*(x) over short timescales, while an exponentially growing population cannot be accurately tracked over long timescales. However, even in a bounded population of continuously reproducing cells, the time-averaged rate of cell divisions converges to Λ, and the distribution of surviving lineages, denoted by ρs(x), approaches the optimal lineage distribution at t ≫ 1. These results have been demonstrated theoretically in [20]. Here, we apply the lineage formalism to cyclical antibiotic treatments known to affect E. coli bacteria in an age-dependent manner to confirm that 1) the surviving lineage ρs is a good approximation of ρ*, and 2) the optimal lineage relation described in Eq. 2 provides an accurate measurement of Hamilton’s selection strength for life-history traits. Our approach demonstrates that measuring the properties of a single surviving lineage (i.e the “path” which maximizes the survival probability) provides a fundamentally novel conceptual framework to extract the selection forces acting on a populations. These results have powerful implications: instead of measuring the survival and growth rate of all members of a population, we show that monitoring the properties of the surviving lineage in a population is sufficient to determine individuals’ life-history parameters, while simultaneously characterizing the selection pressures acting on the population as a whole.
RESULTS
Antibiotic treatments and age-dependent selection
We chose carbenicillin, a member of the carboxypenicillin antibiotic family which is known to interfere with cellular growth by preventing cross-linking of peptidoglycan units during cell-wall synthesis [25, 26], as an age-dependent selective agent. Bacteria often survive antibiotic treatments by stopping cellular divisions, but not elongation, during exposures to cytotoxic agents [27]. Furthermore, analogs of carbenicillin have been shown to specifically target cells undergoing cellular division [28, 29], suggesting that division rather than cell wall synthesis is the main factor that increases the sensitivity to antibiotics.
To experimentally test whether carbenicillin affects bacterial cells in an age-dependent manner, we first monitored 18 different populations of E. coli bacteria growing inside a microfluidic device (Fig. 2a) and subjected them to a 20-minutes pulse of a lethal dose carbenicillin (100ug/mL) every 90 minutes. A fluorescence micrograph of each population was recorded every minute and each image underwent processing to extract the physiological properties (e.g. position, length, age, elongation rate) of each cell. Cells grew and divided in a monolayer within the chambers, and were removed either by antibiotic-mediated killing or by “flow” death, i.e. departure from the growth chamber due to cellular growth (Fig. 2a).
FIG. 2.

Lytic response to carbenicillin antibiotics. a) Schematic representation of the microfluidics device, where cells confined to growth chambers are monitored for hundreds of generations. b) The number of cells decreases sharply following each 100 ug/mL carbenicillin treatment. The measured lysis rate is also in phase with the antibiotic treatments. c) Average lysis rate in response to each 20-minutes treatment of carbenicillin (number of treatments = 25). The lysis rate peaks approximately 10 minutes after antibiotic removal. d) The rate of cell lysis increases with cell age (mean ± std. dev., n = 3 minutes).
Before the first antibiotic treatment, the average number of cells in each growth chamber, shown in Fig. 2b, was stable, indicating that cell divisions and “flow” deaths (Fig. 2a) were balanced. Then, the number of surviving cells systematically decreased following each antibiotic treatment, and the population recovered and stabilized at a lower population size that was sustained over time (consisting of ~15–30 cells). While a small fraction of cells still undergo a “flow” death during and after the antibiotic treatments, most of the population decrease is attributed to cell lysis. The occurrence of every lysis event was recorded and the average lysis rate following each treatment is shown in Fig. 2b, demonstrating that cell lysis is highly correlated with the antibiotic treatments (Fig. 2b, lower panel). No resistance to the carbenicillin treatments emerged and cells remained susceptible to the antibiotic after 25 treatments.
Fig. 2c shows the lysis rate averaged over each 90 minutes treatment. The lysis rate increased linearly with carbenicillin exposure and peaked approximately 10 minutes after external carbenicillin has been removed. The survival probabilities under other fluctuation regimes are shown in Fig. S1. Under these experimental conditions, a given cell has a cumulative probability of approximately 27% to undergo lysis following each treatment [30].
To determine whether cell lysis occurs in an age-dependent manner, we next calculated the age-dependent lysis probability for cells under cyclical carbenicillin treatments. We find in Fig. 2d that the lysis probability is strongly dependent on the time since the last division, and progressively increases by a factor of ~3 when the time since the last division exceeds 25 minutes. In fact, this threshold coincides with the average division age of cells growing in the absence of carbenicillin treatments (Fig. S2), suggesting that cells nearing divisions may be more sensitive to carbenicillin treatments.
Life-history measurements of the reproductive function
In order to directly quantify the selective forces acting on the cells during the antibiotic treatments, we next measured the age-dependent division rate q(x) and the survival function ℓ(x). Note that since each cell division yields two cells with age zero, the reproductive rate is twice the division rate, i.e. b(x)=2q(x). We denote by m(x) the age-specific antibiotic killing rate, and since both killing and cell divisions remove cells from any given age, we have l′/l = −q − m. Both q(x) and l(x) were measured for two different experiments in which cell populations were grown either under cyclical carbenicillin treatments (Fig. 3a–b, blue line) or under constant conditions (Fig. 3a–b, dashed line). Under cyclical carbenicillin treatments, the large number of environmental periods (25 cycles) and the large number of independent populations (n=18) ensured that the q(x) and l(x) functions converged to a stable form when averaged over the entire duration of the experiment.
FIG. 3.

Age-dependent growth and survival functions. a) The age-dependent division probability obtained from life-history measurements of a population under cyclical carbenicillin treatments (q(x), blue line) differs from a population grown under constant conditions (dashed line). Inset: the bimodal distribution of q(x) is caused by the carbenicillin-dependent division rate, where cellular divisions are avoided during carbenicillin treatments. b) Graph of the survival function ℓ(x) under carbenicillin treatments (blue line) as a function of the cell age. A non-negligible fraction of persister cells survive more than 2h under carbenicillin treatments compared with a population grown in the absence of selection (dashed lines). Inset: Carbenicillin treatments decrease the survival probability for ages ≤ 28 minutes (blue line) compared to an untreated population (dashed line). c) The fraction of cellular deaths caused by lysis decreases once cells survive a single carbenicillin treatment cycle (dashed line at t = 90 minutes). d) An example of a persister cell which survives multiple antibiotic treatments, but fails to revert to a proliferative state. e) The average elongation rate decreases with increasing cell lifetime for cells under cyclical carbenicillin treatments (blue line) but remains constant for the untreated population (dashed line).
To measure q(x), we first identified every division that occurred inside the growth chambers and compiled the time since the cell’s last division for each event. We next used this information to compute the age-dependent division probability for all ages x ∈ [0, 100] minutes. Under carbenicillin treatments, we obtained a bimodal distribution because cells tend not to divide under antibiotic treatments (Fig. 3a, inset). Cells avoid dividing during each treatment, and only resume divisions approximately 20 minutes following antibiotic removal (Fig. S3).
The survival function ℓ(x) is shown as a function of cell age, the time since last division (Fig. 3b). The survival probability is lower at ages ≤ 28 minutes for cells subjected to carbenicillin treatments, confirming the age-dependent lysis rate measured above. The fraction of cells that reach older ages, on the other hand, is increased in the presence of carbenicillin treatments. This observation, as we show below, is consistent with the presence of persister cells within the population whose cell division rate is reduced during antibiotic exposures.
We show in Fig. 3c the cause of death for cells growing inside the growth chambers under carbenicillin treatments, which is either lysis or “flow” death. While the fraction of cells that die through cell lysis remains stable during the first cycle (t< 90 minutes), it progressively decreases with each antibiotic cycle. Fig. S3 shows that carbenicillin treatments have no effect on cellular growth, implying that the increase in “flow” deaths is not attributed to a change in cell elongation rate. Instead, we observe that most of the cells that survive multiple treatments are slow-growing cells (i.e. persister cells [31–33]) which are unaffected by repeated antibiotic treatments (Fig. 3d). Cells were more likely to be observed in a persister state with increasing cell lifetime (i.e. time since birth), which leads to a decrease in the average growth rate of the population (Fig. 3e). Persistence, an example of a reversible stochastic switch, is a beneficial survival strategy when environments change infrequently [11, 34]. In our experiments, the timescale of the carbenicillin treatments is fast, on the order of the cell division time, hence reversal of persistence is not beneficial and does not contribute significantly to population growth (Fig. 3d).
Optimal lineages and selection: experiment
Having directly measured cells’ life-history parameters, we next attempted to extract the same information from lineage analysis of a single surviving cell within each population. Indeed, from the preceding analysis of lysis timing, we expected the lineages that survived the 25 carbenicillin treatments should exhibit obvious differences from those which did not – e.g. by avoiding divisions just before, during, or just after carbenicillin treatments. Therefore, the lineage age distribution for surviving lineages should differ from the population-wide average (Fig. 4a). We first compare in Fig. 4b the average age of the lineage and of the whole population over a single 90-minutes treatment, and draw two observations: 1) the average age of the lineage is higher than the population’s for the interval t =[−20, 50] minutes, suggesting that the surviving cells go through a lower number of division events and 2) the average age of the surviving lineage decreases less rapidly upon antibiotic removal (t = [20, 40] minutes), indicating that the surviving cells, on average, did not immediately divide after carbenicillin has been removed from the environment. Both 1) and 2) indirectly confirm a strong age-dependent lysis rate caused by carbenicillin treatments, where the surviving lineage avoided division during sensitive ages. We stress that this observation does not imply active decision-making in individual cells, and may arise as a direct consequence of age-dependent selection.
FIG. 4.

Lineage distribution and selection. a) Diagram illustrating lineage (teal) and population (orange) measurements. b) The average age of the surviving lineage is lower than that of the population average during each treatment cycle, suggesting that the surviving lineage, on average, goes through a lower number of divisions. c) The age-distribution of population is underrepresented for ages between 25 and 50 minutes and enriched with younger cells. The different distributions reflect the age-dependent rate of lysis, whose effect is to remove older cells from the population but not from the surviving lineage. Inset: Although there exists differences between the lineage and population age distributions for cell populations grown in the absence of selection (i.e. constant conditions), no enrichment for cells older than 25 minutes is observed in the lineage age distribution. d) Comparison between the two measurements of the reproduction function, obtained using direct life-history measurements (k(x)= b(x) ℓ(x), dashed line) or extracted from the surviving lineage age-distribution (ks(x) in Eq. 4, blue circles) are in very good agreement. Data is reported as the population average ± std. dev. (n = 18 populations). Inset: comparison between the rate of change of the reproduction function (κ(x) ≡ k′(x)/k(x)) obtained from the life-history and surviving lineage measurements (mean ± std. dev., n = 18 populations)
Conversely, the age-dependent structure of the surviving lineage differs from the population average. Fig. 4c shows that the surviving lineage contains a larger fraction of cells whose age is between 25 and 60 minutes and a lower fraction of younger cells. This over-representation in the 25–60 minutes range suggests that cells in the surviving lineage are, on average, able to avoid cellular lysis during the carbenicillin treatments. The population, on the other hand, contains many lineages that terminated following a carbenicillin treatment, so a lower fraction of cells survive past the age of 25 minutes. The over-representation of younger cells in the population distribution, a phenomenon also observed in the absence of selection (Fig. 4c, inset), results from the continuous flow of cells out of the channel at a rate equal to the population growth rate Λ – whereas the surviving lineage consists precisely of those cells that escaped this removal process.
The signatures of the age-dependent selection caused by carbenicillin treatments detected in Fig. 4b–c confirmed that the surviving lineage differs from the population-wide distributions. We next used the surviving lineage distribution ρs(x) to directly extract the reproductive function k(x) and compared it with the life-history measurements obtained in Fig. 4. In [21], the following explicit expression for the optimal lineage age-distribution was derived:
| (3) |
where τ̄ is the mean age of the mothers at birth. Inverting this expression, we obtain
| (4) |
which enables the reproductive function, labeled here as ks(x), to be measured using the optimal lineage statistics ρ*. In addition to ρ*, inversion requires Λ to either be independently measured or inferred directly from the lineage statistics. For example, in the absence of mortality (m = 0) all cells eventually divide, and the total expected number of offspring of each cell is . Applying this constraint in (4) allows Λ to be determined from the lineage data alone. In our analysis of the data, which involves cell death, we avoided making this assumption and measured Λ directly in the microfluidics device. Interestingly, however, we found that the value of Λ measured (0.024 ± 0.003 min−1) was in close agreement with the value inferred from lineage data (0.023 ± 0.004 min−1). This observation indicates that cells are able to make up for reduced division rates at younger ages, when mortality is high (Fig. 3b), by increased division rates later in life (Fig. 3a). In different biological contexts, different constraints on k(x) may exist, which would similarly enable inference of the growth rate Λ from lineage analysis.
In Fig. 4d, we plot the reproductive function ks(x) extracted from the age distribution of the surviving lineage shown in Fig. 4c using Eq. 4 (blue circles, see methods section for details). The measurement of ks(x) is made using the lineage statistics of a single surviving cell in each of the 18 populations. We next compare this reproductive function with the experimentally determined k(x) from the life-history traits b(x) and ℓ(x) measured in Figs. 3a and b, respectively (Fig. 4d, dashed line). The function k(x) is obtained by combining every division and lysis events (Ndiv = 15004,Nlysis = 6785) that occurred in the 18 populations. Strikingly, both measurements used independent methods to find reproductive functions that are in very good agreement, especially when considering the shape of κ(x), a more natural measure of an organism’s fitness [21] (Fig. 4d, inset).
Each method provides an accurate measurement of the reproductive function, and while both agree within experimental error, extracting k(x) from the surviving lineage ρs(x) requires a significantly lower amount of data. Indeed, instead of monitoring all members of a population and explicitly measuring the reproductive function k(x), we have shown that it is enough to track a single cell back in time, record every division event to derive the age-distribution ρs(x), and use Eq. 4 to measure ks(x) with a similar level of accuracy. We note that, in contrast to lineage statistics, the population age distribution cannot in general be used to infer the reproductive function, as it is determined by l(x) and Λ, and does not contain explicit dependence on b(x) [21]. Our results demonstrate that 1) the surviving lineage measured in the growth chambers is a very good approximation to the optimal lineage and 2) lineage-based measurements provide an alternative, and more direct, method to characterize the selective forces acting on a population.
DISCUSSION
In this paper, we applied the optimal lineage formulation of population dynamics [21] to quantify the growth and survival of E. coli bacteria subjected to cyclical treatments of an antibiotic shown to affect cellular lysis in an age-dependent manner. We first measured the survival and reproductive functions directly from life-history data by monitoring and compiling every lysis and division event in 18 separate populations under 20 minute treatments of a lethal dose of carbenicillin. We then confirmed the optimal lineage formalism by inferring the age-dependent reproductive function using the lineage data alone. Strikingly, the properties of a few surviving lineages provided a highly accurate measurement of the reproductive function.
Our approach provides a simple yet powerful method to study selective pressures acting on populations. Using the optimal lineage relation (Eq. 2), which links between selective strength on life-history traits and surviving lineages statistics, one can directly measure the strength of selection in a model-free way. Moreover, by applying this relation using a specific model of reproductive fitness, we have shown that signatures of age-dependent selection can be extracted from the statistical properties of a few surviving lineages.
The result outlined in Eq. 2 can be generalized to include other traits, for example phenotypic states [20] or other physiological properties. Since a population’s growth rate Λ depends exclusively on the form of the optimal lineage distribution ρ*, knowledge of the optimal (or surviving) lineage distribution can be used to generate relations similar to Eq. 2. Broadly speaking, any observed difference in trait frequency along a surviving lineage vs. in individual cells within a population suggests that the trait experiences selection during the population dynamics. For instance, the surviving lineage and population distribution of 1) position inside the growth chamber and 2) elongation rate for cells grown under constant conditions differ (Fig. S4), suggesting that both of those properties are subject to selection within our device. From lineage statistics, we can infer that birth location inside the growth chamber is the strongest selective pressure acting on the population, and the optimal lineage relation suggests that the population would benefit the most by increasing the fitness of cells away from the main flow channel (Fig. S4).
From an epidemiological perspective, studying the ancestry of a single individual provides a better estimate of the selection pressures than by looking at a cross-section of the population at a fixed time [35]. By measuring the properties of the surviving lineages within a population, it may be possible to directly infer the traits, behaviors or survival strategies that directly affect species’ survival. Trait values that are most often observed along lineages will maximally affect the growth rate of the population. Recognizing the specific traits of surviving members of a population can provide great insight into the evolutionary pressures acting on individuals. Generalizations of this path-integral approach to other biological systems can thus be used to detect and characterize the selective pressures acting on a population, and we hope they may provide significant insight into the emergence of survival strategies –such as antibiotic resistance– and the initial steps of speciation.
METHODS AND MATERIALS
Strain construction
The non-motile F3 strain of E. coli used in these experiments was obtained from the Wakamoto lab (University of Tokyo). The strain is based on the W3110 background and has the fliC, fimA, and flu gene knocked out to decrease cell aggregation and surface adhesion [36]. The strains carried a plasmid conferring kanamycin resistance and expressed GFPmut2 under the control of the rpsL promoter [37].
Device description and fabrication
E. coli were grown inside 7.5 microns wide by 50 microns long by 1 micron high growth chambers. The device was made using standard soft lithography techniques on a SU-8 master and details concerning the device fabrication have been described elsewhere [38]. A constant rate of liquid flow was maintained inside the main flow channel. Each reservoir was pressured to 6psi and flow was controlled using inline solenoid valves (Cole Parmer) connected to a computer-controlled arduino microcontroller.
Experimental conditions and cyclical antibiotic treatments
Cells from a −80C storage were plated on an agar plate containing Luria Bertani (LB) broth and 50μg/mL of kanamycin. A single colony was suspended in fresh LB+kanamycin and grown until it reached an OD600 of 0.2. Then, 4 mL of the cell culture was spun down and resuspended in 10μL of fresh LB. The concentrated cell culture was then inoculated inside the output port of the microfluidic device and the cells were flushed out of the main chamber with fresh LB 5 minutes after inoculation. Tubes connected to either a LB+25 μg/mL kanamycin reservoir or LB+25 μg/mL kanamycin+100μg/mL carbenicillin were attached to each input port. For experiments performed under constant conditions, only a single input port connected to a LB+25 μg/mL kanamycin reservoir was used. Micromanager [39] was used to control the microscope, record a fluorescent image (Andor Luca, Andor) of each growth chambers every minutes, and control the state of each solenoid valve. While 20 growth chambers were monitored during the experiment, only 18 were used in the analysis: two chambers were excluded because the number of cells decreased to zero less than 10h after the start of the experiment.
Image processing and path reconstruction
A gaussian blur filter was applied to each image to remove features smaller than 0.75 pixels and a boxcar filter is used to remove features greater than 7 pixels. The filtered image was then converted into a binary image using an adaptive threshold method (box size = 15 pixels) and a custom routine applied to the resulting image separates touching cells using a watershed algorithm [40]. Each cell within the binary image was then labeled and an algorithm is used to extract each cell’s position, length, width, orientation, and fluorescence intensity. The area that overlaps between all cells in different frames was recorded and the generated assignment problem was solved using the Hungarian algorithm [41]. From the reconstructed cell path, a second round of processing was used to correct mistakes in tracking [40] to generate the life-history data.
Divisions, age, elongation rates and lysis events
Division events were found by locating sudden decreases in cell length that are either greater than 1.5 microns or 30% of the total length of a cell. Then, the algorithm assigned a mother/daughter relationship based on pole inheritance (i.e. the mother inherits the older pole) following each division event. This information was then used to assign to each cell an age and a lifetime variable: the age of both the mother and the daughter is reset to zero at every division event while the lifetime continues to increase over time. With the exception of Fig. 3c and e which used lifetimes, all of our analysis used cell ages. The elongation rate was found by fitting an exponential function to the length of each cell between two division events (L(t)= L(0)ert). Lysis events were found by locating cells that cease to exist a distance larger than 5 microns away from the end of the growth chamber; cells that died closer than 5 microns from the end of the growth chambers were assigned a “flow” death.
Age distributions and the reproductive function
The age distribution for all cells present inside the growth chamber at each time was computed and averaged over time to find the age distribution in Fig. 4b–c. The reproductive rate b(x) was found directly by computing q(x), the probability that a cell underwent a division event between age x and x + 1 for all ages x ∈ [0, 100] minutes (Fig. 3a), and using the relation b(x)=2q(x). The survival function ℓ(x) (Fig. 3b) was found by computing the probability that a cell survived to age x using every life-history that ended in either cell division or lysis; those that ended in a flow death were excluded since these events are due to population growth rather than intrinsic physiology of individual cells. The reproductive function was then computed using k(x)= l(x)b(x) and κ(x) ≡ k′(x)/k(x) was computed by taking the derivative of k(x). A 3-point moving average filter was applied to k(x) before differentiation to find κ(x). Since we averaged over all periods with and without carbenicillin, our results pertain to effective, time-averaged parameters.
Measurements of the growth rate Λ
Two independent growth-rate measurements were used: one based on population-wide division rates (Λp) and a second that used only the lineage data (Λℓ). First, Λp was determined from the unique solution [21] to the expression
| (5) |
which can be obtained from Eq. 4 by multiplying both sides by e−Λx and integrating, noting that ρ* (0) = 1/τ̄. Using the reproductive function shown in Fig. 4d (dashed line), this method yields Λp =0.024 ± 0.003 min−1 mean ± std. dev., n=18). The second method used a constraint on k(x), assuming the expected total reproductive output of each cell is two, i.e. . Applying this constraint, integrating both sides of Eq. 4 over x (by parts on the r.h.s.) yields an equation for Λℓ that depends on ρ* (x):
| (6) |
The equation above was used to find Λℓ exclusively with the lineage data. The value of τ̄= 28 minutes (std. dev = 2 minutes, n = 18) was found by calculating the average cell division time along each lineage, and we computed Λℓ =0.023 ± 0.004 min−1 (mean ± std. dev., n=18).
Lineage analysis
In each of the 18 growth chambers a single cell present at t=40h was randomly selected and was tracked backward in time until time t=0h to generate a lineage history (2 populations were rejected because no cell survived past T=10h). The the growth rate Λℓ and the age distribution ρs(x) along each surviving lineage was then used in combination with Eq. 4 to infer the reproductive function ks(x) from lineage data. The reproductive functions obtained from each of the 18 lineage histories were then averaged together to generate ks(x) shown in Fig. 4d (blue line).
Supplementary Material
Acknowledgments
We would like to thank Yuichi Wakamoto for discussions. This work was supported by NIH grant R01-GM-097356. This work was partially supported by the Chicago Fellows program (G.L.). This work was performed in part at the Cornell NanoScale Facility, a member of the National Nanotechnology Infrastructure Network, which is supported by the National Science Foundation (Grant ECS-0335765).
Contributor Information
Guillaume Lambert, The Institute of Genomics and Systems Biology, The University of Chicago.
Edo Kussell, Department of Biology and Center for Genomics and Systems Biology, New York University and Department of Physics, New York University.
References
- 1.Darwin Charles. On the Origin of Species by Means of Natural Selection, Or, The Preservation of Favoured Races in the Struggle for Life. J. Murray; 1859. [PMC free article] [PubMed] [Google Scholar]
- 2.Allen Orr H. The genetic theory of adaptation: a brief history. Nature Reviews Genetics. 2005;6(2):119–127. doi: 10.1038/nrg1523. [DOI] [PubMed] [Google Scholar]
- 3.Schluter Dolph. Estimating the form of natural selection on a quantitative trait. Evolution. 2010;42(5):2510–2520. doi: 10.2307/2408904. [DOI] [PubMed] [Google Scholar]
- 4.Shaw Ruth G, Geyer Charles J. Inferring fitness landscapes. Evolution. 2010;64(9):2510–2520. doi: 10.1111/j.1558-5646.2010.01010.x. [DOI] [PubMed] [Google Scholar]
- 5.Elena Santiago F, Lenski Richard E. Evolution experiments with microorganisms: the dynamics and genetic bases of adaptation. Nature Reviews Genetics. 2003;4(6):457–469. doi: 10.1038/nrg1088. [DOI] [PubMed] [Google Scholar]
- 6.Kassen Rees, Rainey Paul B. The ecology and genetics of microbial diversity. Annual Review of Microbiology. 2004;58(1):207–231. doi: 10.1146/annurev.micro.58.030603.123654. [DOI] [PubMed] [Google Scholar]
- 7.Taute Katja M, Gude Sebastian, Nghe Philippe, Tans Sander J. Evolutionary constraints in variable environments, from proteins to networks. Trends in Genetics. 2014;30(5):192–198. doi: 10.1016/j.tig.2014.04.003. [DOI] [PubMed] [Google Scholar]
- 8.Justice Sheryl S, Hunstad David A, Cegelski Lynette, Hultgren Scott J. Morphological plasticity as a bacterial survival strategy. Nature Reviews Microbiology. 2008;6(2):162–168. doi: 10.1038/nrmicro1820. [DOI] [PubMed] [Google Scholar]
- 9.Lenormand Thomas, Roze Denis, Rousset François. Stochasticity in evolution. Trends in Ecology & Evolution. 2009;24(3):157–165. doi: 10.1016/j.tree.2008.09.014. [DOI] [PubMed] [Google Scholar]
- 10.Lim Han N, van Oudenaarden Alexander. A multistep epigenetic switch enables the stable inheritance of DNA methylation states. Nature Genetics. 2007;39(2):269–275. doi: 10.1038/ng1956. [DOI] [PubMed] [Google Scholar]
- 11.Kussell Edo, Leibler Stanislas. Phenotypic diversity, population growth, and information in fluctuating environments. Science. 2005;309(5743):2075–2078. doi: 10.1126/science.1114383. [DOI] [PubMed] [Google Scholar]
- 12.Dhar Neeraj, McKinney John D. Microbial phenotypic heterogeneity and antibiotic tolerance. Current Opinion in Microbiology. 2007;10(1):30–38. doi: 10.1016/j.mib.2006.12.007. [DOI] [PubMed] [Google Scholar]
- 13.Barrett Rowan DH, Schluter Dolph. Adaptation from standing genetic variation. Trends in Ecology & Evolution. 2008;23(1):38–44. doi: 10.1016/j.tree.2007.09.008. [DOI] [PubMed] [Google Scholar]
- 14.Hudson RR. Gene genealogies and the coalescent process. Oxford Surveys in Evolutionary Biology. 1990;7 [Google Scholar]
- 15.Price George R. Selection and covariance. Nature. 1970;227(5257):520–521. doi: 10.1038/227520a0. [DOI] [PubMed] [Google Scholar]
- 16.Patwa Z, Wahl LM. The fixation probability of beneficial mutations. Journal of The Royal Society Interface. 2008;5(28):1279–1289. doi: 10.1098/rsif.2008.0248. [DOI] [PMC free article] [PubMed] [Google Scholar]
- 17.Brommer Jon E. The evolution of fitness in life-history theory. Biological Reviews. 2000;75(3):377–404. doi: 10.1111/j.1469-185X.2000.tb00049.x. [DOI] [PubMed] [Google Scholar]
- 18.McGraw James B, Caswell Hal. Estimation of individual fitness from life-history data. The American Naturalist. 1996;147(1):47–64. [Google Scholar]
- 19.Shaw Ruth G, Geyer Charles J, Wagenius Stuart, Hangelbroek Helen H, Etterson Julie R. Unifying lifehistory analyses for inference of fitness and population growth. The American Naturalist. 2008;172(1):E35–E47. doi: 10.1086/523972. [DOI] [PubMed] [Google Scholar]
- 20.Leibler Stanislas, Kussell Edo. Individual histories and selection in heterogeneous populations. Proceedings of the National Academy of Sciences. 2010;107(29):13183–13188. doi: 10.1073/pnas.0912538107. [DOI] [PMC free article] [PubMed] [Google Scholar]
- 21.Wakamoto Yuichi, Grosberg Alexander Y, Kussell Edo. Optimal lineage principle for age-structured populations. Evolution. 2012;66(1):115–134. doi: 10.1111/j.1558-5646.2011.01418.x. [DOI] [PubMed] [Google Scholar]
- 22.Fisher RA. The genetical theory of natural selection. The Clarendon Press; 1930. [Google Scholar]
- 23.Charlesworth Brian. Evolution in age-structured populations. Cambridge University Press; 1994. [Google Scholar]
- 24.Hamilton William D. The moulding of senescence by natural selection. Journal of theoretical biology. 1966;12(1):12–45. doi: 10.1016/0022-5193(66)90184-6. [DOI] [PubMed] [Google Scholar]
- 25.Tomasz A. The mechanism of the irreversible antimicrobial effects of penicillins: How the beta-lactam antibiotics kill and lyse bacteria. Annual Review of Microbiology. 1979;33(1):113–137. doi: 10.1146/annurev.mi.33.100179.000553. [DOI] [PubMed] [Google Scholar]
- 26.Kohanski Michael A, Dwyer Daniel J, Collins James J. How antibiotics kill bacteria: from targets to networks. Nature Reviews Microbiology. 2010;8(6):423–435. doi: 10.1038/nrmicro2333. [DOI] [PMC free article] [PubMed] [Google Scholar]
- 27.Miller Christine, Thomsen Line Elnif, Gaggero Carina, Mosseri Ronen, Ingmer Hanne, Cohen Stanley N. SOS response induction by β-lactams and bacterial defense against antibiotic lethality. Science. 2004;305(5690):1629–1631. doi: 10.1126/science.1101630. [DOI] [PubMed] [Google Scholar]
- 28.Chung Hak Suk, Yao Zhizhong, Goehring Nathan W, Kishony Roy, Beckwith Jon, Kahne Daniel. Rapid -lactam-induced lysis requires successful assembly of the cell division machinery. Proceedings of the National Academy of Sciences. 2009;106(51):21872–21877. doi: 10.1073/pnas.0911674106. [DOI] [PMC free article] [PubMed] [Google Scholar]
- 29.Yao Zhizhong, Kahne Daniel, Kishony Roy. Distinct single-cell morphological dynamics under beta-lactam antibiotics. Molecular Cell. 2012;48(5):705–712. doi: 10.1016/j.molcel.2012.09.016. [DOI] [PMC free article] [PubMed] [Google Scholar]
- 30.Note1. While the number of cells per chamber decreases by ~50% following each antitiobic treatment, only half of this decrease is due to cell lysis. The rest of the decrease in cell density is due to filamentation, which artificially decreases the absolute number of cells inside the growth chambers.
- 31.Keren Iris, Shah Devang, Spoering Amy, Kaldalu Niilo, Lewis Kim. Specialized persister cells and the mechanism of multidrug tolerance in escherichia coli. Journal of Bacteriology. 2004;186(24):8172–8180. doi: 10.1128/JB.186.24.8172-8180.2004. [DOI] [PMC free article] [PubMed] [Google Scholar]
- 32.Balaban Nathalie Q, Merrin Jack, Chait Remy, Kowalik Lukasz, Leibler Stanislas. Bacterial persistence as a phenotypic switch. Science. 2004;305(5690):1622–1625. doi: 10.1126/science.1099390. [DOI] [PubMed] [Google Scholar]
- 33.Levin Bruce R, Rozen Daniel E. Non-inherited antibiotic resistance. Nature Reviews Microbiology. 2006;4(7):556–562. doi: 10.1038/nrmicro1445. [DOI] [PubMed] [Google Scholar]
- 34.Kussell Edo, Kishony Roy, Balaban Nathalie Q, Leibler Stanislas. Bacterial persistence a model of survival in changing environments. Genetics. 2005;169(4):1807–1814. doi: 10.1534/genetics.104.035352. [DOI] [PMC free article] [PubMed] [Google Scholar]
- 35.Stearns Stephen C, Byars Sean G, Govindaraju Diddahally R, Ewbank Douglas. Measuring selection in contemporary human populations. Nature Reviews Genetics. 2010;11(9):611–622. doi: 10.1038/nrg2831. [DOI] [PubMed] [Google Scholar]
- 36.Merrin Jack, Leibler Stanislas, Chuang John S. Printing multistrain bacterial patterns with a piezoelectric inkjet printer. PLoS ONE. 2007;2(7):e663. doi: 10.1371/journal.pone.0000663. [DOI] [PMC free article] [PubMed] [Google Scholar]
- 37.Zaslaver Alon, Bren Anat, Ronen Michal, Itzkovitz Shalev, Kikoin Ilya, Shavit Seagull, Liebermeister Wolfram, Surette Michael G, Alon Uri. A comprehensive library of fluorescent transcriptional reporters for escherichia coli. Nature methods. 2006;3(8):623–628. doi: 10.1038/nmeth895. [DOI] [PubMed] [Google Scholar]
- 38.Lambert Guillaume, Kussell Edo. Memory and fitness optimization of bacteria under fluctuating environments. PLoS Genetics. 2014;10(9):e1004556. doi: 10.1371/journal.pgen.1004556. [DOI] [PMC free article] [PubMed] [Google Scholar]
- 39.Edelstein Arthur, Amodaj Nenad, Hoover Karl, Vale Ron, Stuurman Nico. Computer control of microscopes using uManager. In: Ausubel Frederick M, Brent Roger, Kingston Robert E, Moore David D, Seidman JG, Smith John A, Struhl Kevin., editors. Current Protocols in Molecular Biology. John Wiley & Sons, Inc; Hoboken, NJ, USA: Oct, 2010. [DOI] [PMC free article] [PubMed] [Google Scholar]
- 40.Guillaume Lambert. Celltracker: a set of tools to track fluorescently tagged bacterial cells. 2014 http://github.com/guillambert/celltracker.
- 41.Munkres J. Algorithms for the assignment and transportation problems. Journal of the Society for Industrial and Applied Mathematics. 1957;5(1):32–38. doi: 10.1137/0105003. [DOI] [Google Scholar]
Associated Data
This section collects any data citations, data availability statements, or supplementary materials included in this article.