

Abstract
Objectives
The aim of this study was to investigate pathological mechanisms underlying brain tissue alterations in mild cognitive impairment (MCI) using multi-contrast 3 T magnetic resonance imaging (MRI).
Methods
Forty-two MCI patients and 77 healthy controls (HC) underwent T1/T2* relaxometry as well as Magnetization Transfer (MT) MRI. Between-groups comparisons in MRI metrics were performed using permutation-based tests. Using MRI data, a generalized linear model (GLM) was computed to predict clinical performance and a support-vector machine (SVM) classification was used to classify MCI and HC subjects.
Results
Multi-parametric MRI data showed microstructural brain alterations in MCI patients vs HC that might be interpreted as: (i) a broad loss of myelin/cellular proteins and tissue microstructure in the hippocampus (p ≤ 0.01) and global white matter (p < 0.05); and (ii) iron accumulation in the pallidus nucleus (p ≤ 0.05). MRI metrics accurately predicted memory and executive performances in patients (p ≤ 0.005). SVM classification reached an accuracy of 75% to separate MCI and HC, and performed best using both volumes and T1/T2*/MT metrics.
Conclusion
Multi-contrast MRI appears to be a promising approach to infer pathophysiological mechanisms leading to brain tissue alterations in MCI. Likewise, parametric MRI data provide powerful correlates of cognitive deficits and improve automatic disease classification based on morphometric features.
Keywords: Multi-contrast MRI, Quantitative MRI, Mild cognitive impairment, Relaxometry, Magnetization transfer imaging
Highlights
-
•
Forty-two MCI patients and 77 HC underwent multi-contrast quantitative MRI.
-
•
MCI patients showed T1/T2* increase and MTR decrease in the hippocampus.
-
•
MCI patients exhibited T1 increase in WM and T2* decrease in the pallidus.
-
•
MRI metrics accurately predicted memory and executive function in patients.
-
•
SVM classified MCI patients with 75% accuracy using volumetric/parametric MRI.
1. Introduction
Mild cognitive impairment (MCI) is defined as cognitive decline greater than expected for an individual's age and education level but that does not interfere notably with activities of daily life (Albert et al., 2011; Gauthier et al., 2006). MCI is considered a prodromal phase to dementia since it has been estimated that more than half of the patients progress to dementia within 5 years (Gauthier et al., 2006).
The aetiology of MCI appears quite heterogeneous as it encompasses degenerative diseases (Alzheimer's disease (AD), fronto-temporal lobe degeneration, dementia with Lewy bodies), vascular and psychiatric disorders and other medical conditions (diabetes, systemic cancer etc. (Petersen and Negash, 2008)).
Structural and functional magnetic resonance imaging (MRI) have been extensively applied to identify brain abnormalities in MCI patients, to perform early diagnosis and estimate time to progression to AD or other dementias (for review see (McConathy and Sheline, 2015; Schuff and Zhu, 2007)). Most structural MRI studies applied morphometric analysis to MCI patients evidencing volumetric decrease in the temporal lobe (cortex and hippocampus, for review see (McConathy and Sheline, 2015; Schuff and Zhu, 2007)). Longitudinal structural MRI studies in MCI subjects revealed that hippocampal atrophy rates negatively correlate with time to conversion to AD (Leung et al., 2013; Westman et al., 2012). Interestingly, reduced cortical volumes in the parietal and frontal lobes have also been reported before development of MCI, preceding hippocampal atrophy (Burgmans et al., 2009; Westman et al., 2012).
Local atrophy processes are therefore a common characteristic of MCI brains. Nevertheless, morphometric measurements reveal gross pathological processes and lack of sensitivity to microstructural tissue changes, which precede local atrophy and might help in identifying the nature of the underlying pathological process.
Quantitative MRI relaxometry is sensitive to brain tissue properties, both in health and pathology (Deoni, 2010; Deoni, 2011; Lamar et al., 2014). Similarly, Magnetization Transfer Imaging (MTI) techniques provide semi-quantitative (MTR, Magnetization Transfer Ratio (Wolff and Balaban, 1989)) or quantitative (magnetization transfer maps (Gochberg and Gore, 2007; Muller et al., 2013)) metrics to assess the integrity of macromolecules in the brain tissue such as myelin or cellular membranes components (proteins, cholesterol, phosphatidylcholine and galactocerebrosides) (Barkovich, 2000).
To date, only few structural investigations applied MRI relaxometry and MTI to MCI patients, suggesting both myelin loss and neurodegeneration in the hippocampus (Haris et al., 2009; Kiefer et al., 2009) and white/grey matter (van Es et al., 2007; van Es et al., 2006). Yet, all these studies applied a single contrast approach to investigate MCI pathophysiology and, to our knowledge, there has been no attempt to combine multiple quantitative MRI contrasts to study MCI physiopathology.
At least for other types of brain pathology, multi-contrast investigations have demonstrated higher sensitivity and specificity (Bonnier et al., 2014; Granziera et al., 2013; Vavasour et al., 2011). T1 relaxometry measurements are sensitive to both tissue loss/increase and to paramagnetic substances like iron (Deoni, 2010; Levitt, 2008), rendering the interpretation of single-contrast quantitative T1 changes in MCI studies very challenging; combining T1 with T2* measurements, which are strongly influenced by local iron presence (Langkammer et al., 2010), might help disentangling the presence of tissue structure alterations from iron deposition that has been reported in MCI patients (Haller et al., 2010; Smith et al., 2010). Also, MTI investigations alone relate about the integrity of macrostructural components in a tissue, as MTI metrics are mainly influenced by large molecular aggregates like myelin or cellular lipids and proteins (Helms, 2014). Nonetheless, combining MTI with T1 relaxometry, provides broader measures of brain tissue alterations, since T1 metrics are also affected by micromolecular changes. Last, since T1 relaxation times and MTI have shown some potential to detect neurofibrillary tangles (Berger R., 2011; Haris et al., 2009) and amyloid plaque deposition (Bigot et al., 2014; Meadowcroft et al., 2009) in animal models, they appear to be promising complementary approaches to study brain tissue pathology leading to cognitive impairment.
In this study, we sought to perform a multi-contrast MRI investigation of the nature of brain structural changes in a heterogeneous cohort of MCI patients. To achieve this goal, we applied an MRI sequence that is sensitive to micro and macromolecular components of the brain tissue (T1 relaxometry) with others that are sensitive to macromolecular presence/integrity and/or water accumulation (MTI and T2* relaxometry) as well as iron presence (T2* relaxometry). Last, we assessed the cognitive correlates of the identified imaging biomarkers and estimated the power in discriminating between MCI patients from HC by performing automatic disease classification.
2. Methods
Forty-two MCI patients (30:12, F: M; age 70.5 ± 9.5, mean ± standard deviation, SD; 30 amnestic MCI-aMCI, 12 non-amnestic MCI-naMCI) and 77 HC (58:19, F:M; age 66.4 ± 7.1, mean ± SD) were enrolled in the study. Cerebrovascular risk factors are reported in Table 1. Written consent was obtained from all participants. The study was approved by the ethic committee of Lausanne University Hospital (CHUV).
Table 1.
Cerebrovascular risk factors. HC: Healthy controls; MCI: mild cognitive impairment patients; p values are reported after correction for multiple comparison.
| HC (n = 76) | MCI (n = 42) | p-Value | |
|---|---|---|---|
| Hypertension | 20 | 21 | 0.05 |
| Tobacco | 13 | 5 | 1.8 |
| Diabetes | 3 | 5 | 0.6 |
| Hypercholesterolemia | 22 | 17 | 0.8 |
MCI patients were recruited in the geronto-psychiatric, geriatric and memory clinics of the University Hospitals of Lausanne and Geneva over a 2-year period (2010–2012) and were properly diagnosed at the time of the enrolment. Inclusion criteria were the following: (i) age ≥ 55 years, (ii) Caucasian origin, (iii) Clinical Dementia Rating (Morris, 1993) (CDR) = 0.5, (iv) no major psychiatric (psychiatric axis I disorders with the exception of affective and adaptation disorders as well as dementia according to DSM-IV (American Psychiatric Association, 2000) and NINCDS-ADRDA (National Institute of Neurological and Communicative Disorders and Stroke Alzheimer's Disease and Related Disorders Association) (McKhann et al., 1984) or neurological disorders, (v) no current substance abuse or severe physical illness, and (vi) ≥6 years of education.
2.1. Neurobehavioral examination
All enrolled subjects completed the Hospital Anxiety and Depression Scale (Zigmond and Snaith, 1983) (HADS) and a Mini Mental State Examination (MMSE). Additional information was obtained by family members through the Neuropsychiatric Inventory Questionnaire (NPI-Q) (Cummings et al., 1994), the evaluation of the Basic and Instrumental Activities of Daily Living (BADL; IADL) (Katz, 1983; Lawton and Brody, 1969) and the Informant Questionnaire on Cognitive Decline in the Elderly (IQCODE) (Jorm and Jacomb, 1989).
2.2. Neuropsychological assessment
All MCI participants were administered an extended battery of neuropsychological tests, mainly covering two cognitive domains (memory and executive functions), recognized as an essential component of early diagnosis of Alzheimer's disease (Van der Linden and Juillerat, 2004; Weintraub et al., 2012).
Episodic memory was assessed by a verbal RL/RI-48 task (Adam et al., 2007), while to assess executive functions, we used three tests proposed by GREFFEX (Godefroy et al., 2010): a verbal fluency task (categorical and literal fluency in 2 min), a flexibility task (Trail Making Test B), and an inhibition task (Stroop test).
2.3. Mild cognitive impairment diagnosis
The clinical diagnosis of MCI was based on the criteria proposed by (Winblad et al., 2004). A cognitive decline was diagnosed using the CDR scale and a CDR = 0.5 was diagnostic for MCI (Morris, 1993; Morris et al., 2001), independently from the MMSE result.
2.4. HC recruitment and inclusion/exclusion criteria
Healthy controls were recruited through public advertisement in the Lausanne area as well as by personal contacts with family members and acquaintances of the patients. Healthy controls were enrolled according to the following inclusion criteria: age ≥ 55 years, Caucasian ethnicity, MMSE ≥ 27 and Clinical Dementia Rating scale (Hughes et al., 1982) (CDR) = 0. Exclusion criteria were: MCI or dementia, neurological or psychiatric disease, alcohol abuse or psychotropic drugs consumption, severe medical illness, and ≤ 4 educational years.
2.5. MRI acquisition and image processing
All participants underwent structural MRI at 3 T (Magnetom Trio, a Tim System, Siemens Healthcare, Erlangen, Germany) using a 32-channel head coil.
The MRI protocol included: (i) an MPRAGE scan based on (Jack et al., 2010) (TR/TE = 2400/3 ms, TI: 900 ms, voxel size = 1 × 1 × 1.2 mm3, FoV = 256 × 240 × 212 mm, iPAT = 2, ST = 5:12 min), (ii) an MP2RAGE acquisition (Marques et al., 2010) to provide T1 relaxometry maps (TR/TE = 5000/3 ms, TI1/TI2 = 700 ms/2500 ms, FA = 4°/4°, voxel size = 1 × 1 × 1.2 mm3, FoV = 256 × 240 × 212 mm, iPAT = 3, ST = 8:22 min), and Magnetization Transfer Imaging (MTI) using an 8-echo FLASH acquisition as in (Granziera et al., 2013) (TR = 48 ms, TE ranging from 2.3 to 23.1 ms, voxel size = 2 × 2 × 2 mm3, FoV = 256 × 256 × 192 mm, 8 echos, ST = 2 × 3 min) (Granziera et al., 2013). Magnetization Transfer Ratio (MTR) was computed from the MTI acquisition as follows: MTR = (M0 − MT)/M0 × 100, where MT and M0 are, respectively, the image intensities acquired with and without magnetization transfer saturation pulse (MT pulse: flip angle: 220°; duration: 4000 ms; pulse offset: 2000 Hz; spoiler moment: 25,000 µs × mT/m (Helms et al., 2009)). T2* maps were calculated from the MTI acquisition by least-squares fitting of an exponential decay to the multiple-echo M0 experimental data.
T2-weighted transverse plane images were also acquired with conventional fast spin-echo sequence (TR/TE = 4000/95 ms, voxel size = 0.73 × 0.51 × 5.0 mm, gap between slices = 1.5 mm, matrix = 314 × 448, FOV = 230 mm). T2 weighted images were qualitatively examined by a neuroradiologist to exclude subjects with neoplastic or vascular lesions (i.e. strokes, haemorrhages and vascular malformations).
Bias-field correction, tissue classification, subcortical nuclei and lobar segmentation were performed on the MPRAGE volumes using Morphobox (Roche et al., 2011; Schmitter et al., 2015), as previously reported (Bonnier et al., 2014; Granziera et al., 2013). The following 7 regions-of-interest (ROI) were extracted: global white and cortical gray matter (WM and cGM), thalamus, caudate, globus pallidus, putamen and hippocampus. Segmentation quality was manually confirmed by one neurologist. Subsequently, T1, MTR and T2* maps were aligned to the MPRAGE volume by a rigid body registration with 6 degrees of freedom and mutual information cost function using ELASTIX (Klein et al., 2010). Average MTR, T1 and T2* values were obtained for all ROIs.
White matter hypointesities were quantified on MPRAGE images using Freesurfer software (https://surfer.nmr.mgh.harvard.edu/).
2.6. Volumetric assessment
Volumetric information was computed for all the 7 ROIs mentioned above and for WM and cGM of each lobe (frontal, parietal, temporal and occipital) on MPRAGE and MP2RAGE images.
2.7. Statistical analysis
Statistical analysis was performed with R-project software (http://www.r-project.org/). Permutation-based univariate t-tests and multivariate Hotelling tests with 10,000 permutations, were applied to compare parametric maps in all ROIs between MCI patients and HC as well as between the aMCI subgroup and HC. Age and gender were used as covariates and correction for family-wise error rate was performed for multiple comparisons (7 ROIs per contrast).
Volumes and WM abnormality differences between groups were calculated using an analysis of variance with age and gender as covariates.
A multivariate linear regression of clinical scores was performed using a generalized linear model (GLM) applied to T1, MTR and T2* in all ROIs. Educational years were considered in addition to age and gender as it also affects cognitive performance. Cognitive scores were adapted using Box–Cox transformation to satisfy model assumption for normality (Osborne, 2010).
2.8. Classification of MCI patients and healthy controls
Classification performance was evaluated with volumes and parametric features (mean T1, MTR and T2*) extracted from all the 7 ROIs segmented in all HC and MCI subjects.
A cost-sensitive soft-margin support vector machine (SVM) (Cortes and Vapnik, 1995) was employed using the LIBSVM library (Chang and Lin, 2011), where the cost parameter was optimized. To account for the imbalance in the group sizes, the features were weighted in the SVM. No subject was excluded. Due to the small sample size, the discriminability of the data set was estimated by leave-one-sample-out cross-validation. This procedure excludes data and label from one instance, trains with the remaining instances and then predicts the left-out instance. This procedure is repeated for every instance. Correction for age was performed using linear detrending as in Dukart et al. (2011).
3. Results
MCI patients were older than HC (p = 0.02) but the groups did not differ for gender (p > 0.7) nor for education (p > 0.2). Patients had cognitive impairment in both executive and memory domains as summarized in Table 2.
Table 2.
Demographic characteristics and neuropsychological assessment. HC: Healthy controls; MCI: mild cognitive impairment patients; IF_Stroop: interference Stroop test; TMT: trail making test; p values are reported after correction for multiple comparison.
| HC (n = 77) | MCI (n = 42) | p-Value | |
|---|---|---|---|
| Age | 66.4 ± 7.1 | 70.5 ± 9.5 | 0.02 |
| Gender | 19/58 | 12/30 | 0.65 |
| Education (y) | 2.2 ± 0.6 | 2.1 ± 0.6 | 0.19 |
| MMSE | 29.2 ± 1.1 | 27.8 ± 1.6 | <0.001 |
| Immediate recall | 42.1 ± 3.0 | 35.9 ± 5.8 | <0.001 |
| Category cued recall | 29.3 ± 5.1 | 20.0 ± 6.5 | <0.001 |
| Verbal fluency on category tasks | 33.7 ± 6.4 | 23.2 ± 8.6 | <0.001 |
| Verbal fluency on letters | 25.3 ± 5.3 | 20.5 ± 6.3 | <0.001 |
| Stroop 1 | 12.8 ± 2.2 | 15.3 ± 4.2 | <0.001 |
| Stroop 2 | 15.5 ± 2.7 | 20.8 ± 6.2 | <0.001 |
| Stroop 3 | 24.4 ± 5.9 | 38.4 ± 16.1 | <0.001 |
| IF_Stroop | 1.9 ± 0.4 | 2.6 ± 1.0 | <0.001 |
| TMT A | 36.7 ± 10.7 | 53.9 ± 20.9 | <0.001 |
| TMT B | 84.5 ± 27 | 131.5 ± 51.3 | <0.001 |
| Ratio_TMT | 2.4 ± 0.7 | 2.7 ± 1.1 | 0.08 |
The HADS revealed mild depression in 5 subjects (4 HC and 1 MCI patient) HC and moderate anxiety in 4 subjects (2 MCI patients and 2 HC). Since no significant difference in anxiety and depression was observed between the two groups, these subjects were not excluded from the analysis.
There were no differences between groups in most of the vascular risk factors (diabetes, smoke and hypercholesterolemia, Table 1), with the exception of hypertension (p = 0.05, Table 1). The freesurfer evaluation of hypointensities revealed slightly more hypointensities in HC than MCI (HC: 2992 ± 2280 voxels (= 3.6 ± 2.7 ml); MCI: 2762 ± 5914 voxels (=3.3 ± 7.1 ml), p = 0.02).
Comparing the whole MCI group (n = 42) to the HC (n = 77), univariate analysis on the 7 segmented ROIs revealed: (i) a significant increase of mean T1 relaxation time in the global WM and hippocampus of MCI vs HC (WM MCI: 935 ± 32 ms, mean ± SD vs HC: 909 ± 34 ms, mean ± SD, p = 0.02; hippocampus MCI: 1466 ± 90, mean ± SD vs HC: 1405 ± 56, mean ± SD, p = 0.003); and (ii) a significant decrease of the MTR in the hippocampus of MCI vs HC (hippocampus MCI: 0.32 ± 0.04, mean ± SD vs HC: 0.34 ± 0.01, mean ± SD, p = 0.009), Fig. 1. T2* was increased in the hippocampus and decreased in globus pallidus of MCI patients vs HC (hippocampus MCI: 81 ± 20 ms, mean ± SD vs HC: 70 ± 9 ms, mean ± SD, p = 0.01; globus pallidus MCI: 32 ± 3 ms, mean ± SD vs HC: 30 ± 4 ms, mean ± SD, p = 0.05), Fig. 1.
Fig. 1.

Mean MTR, T1 and T2* relaxation times in the seven ROIs considered (Th: thalamus, Pu: putamen, Pa: pallidus nucleus; Ca: caudate; Hip: hippocampus; GM: grey matter; WM: white matter).
Multivariate analysis on T1, T2* and MTR in the 7 ROIs showed differences between patients and controls in the hippocampus (p = 0.01).
ROIs normalized by total intracranial volume did not significantly differ between the two groups.
The analysis performed on the subset of aMCI patients confirmed the T1 increase and MTR decrease in the hippocampus of MCI subjects compared to controls (p = 0.03 and p = 0.04 respectively) as well as the decrease in the globus pallidus T2*.
The analysis of the lobar WM differences between the whole MCI cohort and HC evidenced that T1 WM abnormalities were widely distributed and significantly higher in frontal (p = 0.03), parietal (p = 0.01) and occipital (p = 0.02) WM of MCI patients vs HC, Fig. 2.
Fig. 2.

Mean MTR, T1 and T2* relaxation times in the brain lobes (PGM: parietal grey matter; PWM: parietal white matter; OGM: occipital grey matter; OWM: occipital white matter; FGM: frontal grey matter; FWM: frontal white matter; TGM: temporal grey matter; TWM: temporal white matter).
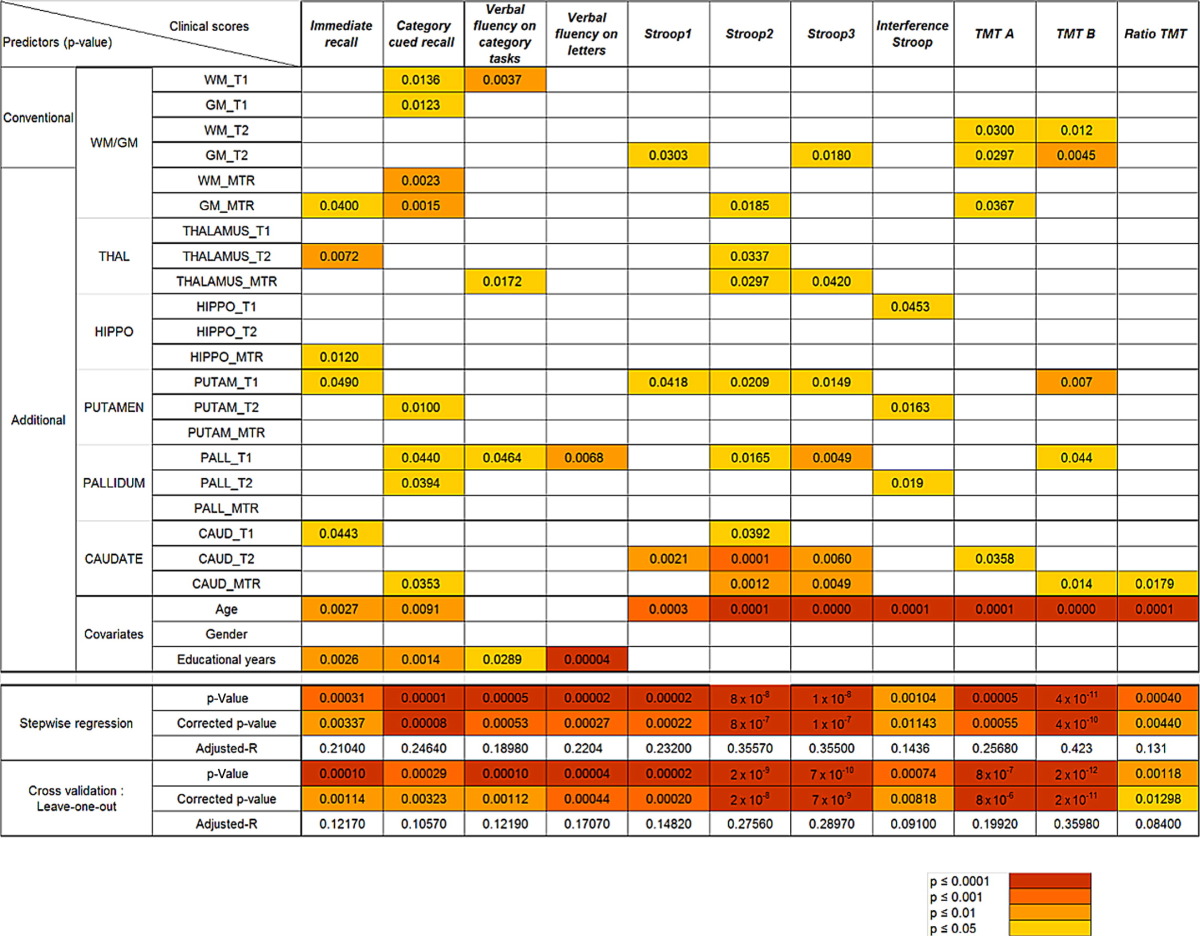
A GLM applied in the patient population evidenced that memory (p < 0.0001) and executive performances (p < 0.001) were highly predicted by age, education and T1-MTR-T2* characteristics of WM/GM, hippocampus, thalamus, caudate, putamen, and globus pallidus (Table 3).
Table 3.
Multiple regression analysis performed using a generalized linear model between MRI characteristics, covariates, and clinical scores in patients. Top part: Each line corresponds to the p-values of each predictor for every regression model performed. Bottom part: Each line corresponds to the p-values, corrected p-values, and adjusted-R of each model (n = 11) subjected to regression, cross-validation analysis and correction for multiple comparison.The colour scheme signifies the difference in significance: Dark orange p ≤ 0.0001, light orange p ≤ 0.001, yellow p ≤ 0.01, light yellow p ≤ 0.05.
SVM classification of MCI patients and HC based on (i) all 7 volumetric features calculated on MPRAGE images yielded a balanced accuracy of 70% (sensitivity of 55% and specificity of 78%); on (ii) volumes calculated on MPRAGE images and parametric features showed a balanced accuracy of 75% (60% sensitivity and 83% specificity); and on (iii) volumetric measurements calculated on MPRAGE images and T1-based measurements only exhibited lower balanced accuracy (68%), sensitivity (60%) and specificity (73%).
SVM classification performed on (i) parametric features and volumetric measurements on MP2RAGE images lead to a balanced accuracy (66%), sensitivity (52%) and specificity (73%) and on (ii) volumetric measurements on MP2RAGE images and T1 measurements yielded a balanced accuracy (73%), sensitivity (55%) and specificity (82%).
Last, we performed SVM classification in the subgroup of aMCI patients and the whole group of HC based on volumetric features calculated on MPRAGE images and parametric features, and reached a balanced accuracy of 79% (sensitivity 60% and specificity 87%).
4. Discussion
Our multi-contrast MRI study shows WM and hippocampal microstructural alterations in MCI patients compared to healthy controls, suggesting loss of microstructure, myelin and/or cellular membrane proteins. Furthermore, our results provide evidence of iron accumulation in the globus pallidus of MCI subjects.
Brain microstructural properties in MCI patients were strong predictors of memory and executive performances and improved the classification of MCI subjects versus controls, compared to volumetric measures only.
Quantitative and semi-quantitative multi-parametric MRI may provide useful information about the pathological substrate of MCI. An increase in T1 relaxation times may point at a loss in tissue micro- and macrostructural integrity (Deoni, 2010; Levitt, 2008), including myelin damage (Koenig, 1991; Labadie et al., 2014) and iron loss (Gelman et al., 2001). Similarly, T2* relaxation times strongly depend on the local iron content with high iron leading to shortened T2* values (Stuber et al., 2014). MTR is a semi-quantitative marker of structural integrity, which is sensitive to the proportion of macromolecules (myelin and cellular membrane components such as lipids and proteins) (Kucharczyk et al., 1994) relative to water. A reduced MTR indicates therefore a loss of macromolecules and/or microscopic oedema (Helms, 2014; Henkelman et al., 2001).
In this work, we studied a heterogeneous cohort of patients with MCI, who did not suffer from any severe medical condition, nor of any neurological or psychiatric disorders (only one patient reported moderate anxiety and two moderate depression). A trend to significantly higher number of hypertensive subjects was observed in the patients cohort compared to the control one.
Multi-parametric MRI data evidenced a significant increase in T1 and decrease of MTR and T2* in the hippocampus of MCI patients compared to HC. The concomitant changes in T1, MTR and T2* suggest that, a loss of myelin/cellular membrane integrity and possibly iron, is the major determinant of the observed alterations. These findings are compatible with pathological studies showing synaptic loss and neuronal degeneration in MCI (Vemuri et al., 2010).
Similarly, the broad T1 increase in WM (frontal, parietal and occipital) most likely indicates loss of subcortical microstructural integrity. In this context, three major pathophysiological mechanisms have been proposed as causes of WM alterations in MCI: (i) tissue rarefaction of vascular origin (Scheltens et al., 1995) (ii) Wallerian degeneration secondary to GM pathology (Englund, 1998), oligodendrocyte death and reactive gliosis (Englund and Brun, 1990) and (iii) retrogenesis, a process leading to WM degeneration through reverse myelogenesis (Reisberg et al., 2002). The observed increase in WM T1 might be compatible with all these mechanisms. Nevertheless, Wallerian degeneration and reverse myelogenesis appear unlikely since we did not observe any cortical abnormalities in our patients cohort nor changes in WM MTR. On the other hand, MCI patients presented a trend to higher arterial tension when compared to HC (see Table 1). Therefore, the most plausible explanation of the T1 increase in WM in our cohort is a tissue rarefaction of vascular origin. Interestingly, T1 abnormalities reflected a damage that was independent from focal vascular damage (WM hypointensities), which were more numerous in HC compared to MCI patients.
We also observed a decrease in T2* in the globus pallidus of MCI patients compared to HC, suggesting iron accumulation. This finding confirms previous reports (Haller et al., 2010; Smith et al., 2010) and supports the hypothesis that MCI patients may exhibit accelerated iron accumulation in other brain regions than the cortex, where it is expected with aging (Haller et al., 2010; Smith et al., 2010).
Few MRI studies applied relaxometry and Magnetization Transfer Imaging to MCI patients. House et al. compared R2 relaxometry features between elderly participants with mild to severe cognitive impairment and healthy controls, showing increased iron and in several WM regions (House et al., 2006). Only one study reported increased T1 relaxation times in the hippocampus of AD and MCI patients compared to controls (Haris et al., 2009) and, to our knowledge, no report is available about T2* relaxometry in MCI patients.
On the other hand, reduced MTR has been previously reported in GM and WM in MCI subjects compared to HC and the MTR metric has been shown to correlate with cognitive performance (Kabani et al., 2002a; Kabani et al., 2002c; van Es et al., 2007; van Es et al., 2006). Interestingly, MTR changes were also observed in the absence of volumetric differences (Kabani et al., 2002c) as we report for both relaxometry and MTR measurements, suggesting that parametric MRI might be sensitive to pre-atrophy brain changes in MCI.
Yet, we did not detect any alterations in MCI WM MTR, which might depend on the milder cognitive deficits (MMSE) of our patients compared to those studied in previous studies (Haris et al., 2009; Kabani et al., 2002a; Kabani et al., 2002c; van Es et al., 2007; van Es et al., 2006) and/or on the lack of sensitivity of this semi-quantitative metric to subtle tissue alterations. Future studies applying quantitative MTI might provide more sensitive measures to confirm or discard the reverse myelogenesis aetiology of MCI.
Our work provide also evidence that multi-contrast MRI in MCI is a strong predictor of memory and executive function in patients. This aspect confirms the clinical value of quantitative MRI and would benefit from further exploration in longitudinal settings.
Last, adding T1, MTR and T2* characteristics to volumetric features, we showed that the classification of MCI patients vs HC improved compared to the one performed on volumes only (75% vs 70% balanced accuracy). These results confirm and extend previous work showing improved classification performance when multimodal data were used compared to one single modality (Zhang et al., 2011).
In summary, multi-parametric MRI holds promises to improve the understanding of MCI pathophysiology and automated methods to support patients' diagnosis. Future longitudinal studies are needed to determine the prognostic values of multi-parametric biomarkers in MCI.
Authors' contributions
Study design (AD, RM, AVG, GK); collection, analysis, and interpretation of data (CG, AD, AaD, GB, DR, AR, MBC, DS, SK, RM, AVG and GK); writing of the report and decision to submit the paper for publication (CG, AD, AaD, GB, DR, AR, MBC, DS, SK, RM, AVG and GK).
Conflicts of interest
Dr Roche and Dr Krueger work for Siemens AG. The other authors have nothing to disclose in relation to this study.
Funding
This work was supported by the National Science Foundation grant 3200BO-122263, the Swiss National Science Foundation grant PZ00P3_131914/1 and the Centre d'Imagerie BioMédicale (CIBM) of the University of Lausanne (UNIL), the Swiss Federal Institute of Technology Lausanne (EPFL), the University of Geneva (UniGe), the Centre Hospitalier Universitaire Vaudois (CHUV), the Hôpitaux Universitaires de Genève (HUG) and the Leenaards and the Jeantet Foundations.
References
- American Psychiatric Association . Diagnostic and Statistical Manual of Mental Disorders. fourth edition. American Psychiatric Association; Washington, DC: 2000. [Google Scholar]
- Adam S., Van der Linden M., Ivanoiu A., Juillerat A.C., Bechet S., Salmon E. Optimization of encoding specificity for the diagnosis of early AD: the RI-48 task. J. clin. exp. neuropsychol. 2007;29(5):477–487. doi: 10.1080/13803390600775339. 17564913 [DOI] [PubMed] [Google Scholar]
- Albert M.S., DeKosky S.T., Dickson D., Dubois B., Feldman H.H., Fox N.C., Gamst A., Holtzman D.M., Jagust W.J., Petersen R.C., Snyder P.J., Carrillo M.C., Thies B., Phelps C.H. The diagnosis of mild cognitive impairment due to Alzheimer's disease: recommendations from the National Institute on Aging-Alzheimer's Association workgroups on diagnostic guidelines for Alzheimer's disease. Alzheimers Dement. 2011;7(3):270–279. doi: 10.1016/j.jalz.2011.03.008. 21514249 [DOI] [PMC free article] [PubMed] [Google Scholar]
- Barkovich A.J. Concepts of myelin and myelination in neuroradiology. A.J.N.R. Am. j. neuroradiol. 2000;21(6):1099–1109. 10871022 [PMC free article] [PubMed] [Google Scholar]
- Berger R., Fenty M., Iba M., Lee M.Y., Detre J.A., Borthakur A. T1ρ MRI as a marker of neurofibrillary tangles in a mouse model of alzheimer disease. Proc. Intl. Soc. Mag. Reson. Med. 2011;19:2228. [Google Scholar]
- Bigot C., Vanhoutte G., Verhoye M., Van der Linden A. Magnetization transfer contrast imaging reveals amyloid pathology in Alzheimer's disease transgenic mice. NeuroImage. 2014;87:111–119. doi: 10.1016/j.neuroimage.2013.10.056. 24188815 [DOI] [PubMed] [Google Scholar]
- Bonnier G., Roche A., Romascano D., Simioni S., Meskaldji D., Rotzinger D., Lin Y.C., Menegaz G., Schluep M., Du Pasquier R., Sumpf T.J., Frahm J., Thiran J.P., Krueger G., Granziera C. Advanced MRI unravels the nature of tissue alterations in early multiple sclerosis. Ann Clin Transl Neurol. 2014;1(6):423–432. doi: 10.1002/acn3.68. 25356412 [DOI] [PMC free article] [PubMed] [Google Scholar]
- Burgmans S., van Boxtel M.P., Smeets F., Vuurman E.F., Gronenschild E.H., Verhey F.R., Uylings H.B., Jolles J. Prefrontal cortex atrophy predicts dementia over a six-year period. Neurobiol. aging. 2009;30(9):1413–1419. doi: 10.1016/j.neurobiolaging.2007.11.028. 18258339 [DOI] [PubMed] [Google Scholar]
- Chang C.-C., Lin C.-J. LIBSVM. A.C.M. Transactions Intell. Syst. Technol. 2011;2(3):1–27. [Google Scholar]
- Cortes C., Vapnik V. Support-vector networks. Mach. Learn. 1995;20(3):273–297. [Google Scholar]
- Cummings J.L., Mega M., Gray K., Rosenberg-Thompson S., Carusi D.A., Gornbein J. The neuropsychiatric inventory: comprehensive assessment of psychopathology in dementia. Neurology. 1994;44(12):2308–2314. doi: 10.1212/wnl.44.12.2308. 7991117 [DOI] [PubMed] [Google Scholar]
- Deoni S.C. Quantitative relaxometry of the brain. Top. Magn. Reson. Imaging TMRI. 2010;21(2):101–113. doi: 10.1097/RMR.0b013e31821e56d8. 21613875 [DOI] [PMC free article] [PubMed] [Google Scholar]
- Deoni S.C. Magnetic resonance relaxation and quantitative measurement in the brain. Methods Mol. Biol. 2011;711:65–108. doi: 10.1007/978-1-61737-992-5_4. 21279598 [DOI] [PubMed] [Google Scholar]
- Dukart J., Schroeter M.L., Mueller K., Alzheimer's Disease Neuroimaging Initiative Age correction in dementia--matching to a healthy brain. PLOS ONE. 2011;6(7):e22193. doi: 10.1371/journal.pone.0022193. 21829449 [DOI] [PMC free article] [PubMed] [Google Scholar]
- Englund E. Neuropathology of white matter changes in Alzheimer's disease and vascular dementia. Dement. geriatr. cogn. disord. 1998;9(Suppl. 1):6–12. doi: 10.1159/000051183. 9716238 [DOI] [PubMed] [Google Scholar]
- Englund E., Brun A. White matter changes in dementia of Alzheimer's type: the difference in vulnerability between cell compartments. Histopathology. 1990;16(5):433–439. doi: 10.1111/j.1365-2559.1990.tb01542.x. 2361659 [DOI] [PubMed] [Google Scholar]
- Gauthier S., Reisberg B., Zaudig M., Petersen R.C., Ritchie K., Broich K., Belleville S., Brodaty H., Bennett D., Chertkow H., Cummings J.L., de Leon M., Feldman H., Ganguli M., Hampel H., Scheltens P., Tierney M.C., Whitehouse P., Winblad B., International Psychogeriatric Association Expert Conference on mild cognitive impairment Mild cognitive impairment. Lancet. 2006;367(9518):1262–1270. doi: 10.1016/S0140-6736(06)68542-5. 16631882 [DOI] [PubMed] [Google Scholar]
- Gelman N., Ewing J.R., Gorell J.M., Spickler E.M., Solomon E.G. Interregional variation of longitudinal relaxation rates in human brain at 3.0 T: relation to estimated iron and water contents. Magn. Reson. Med. Off. J. Soc. Magn. Reson. Med. / Soc. Magn. Reson. Med. 2001;45(1):71–79. doi: 10.1002/1522-2594(200101)45:1<71::aid-mrm1011>3.0.co;2-2. [DOI] [PubMed] [Google Scholar]
- Gochberg D.F., Gore J.C. Quantitative magnetization transfer imaging via selective inversion recovery with short repetition times. Magn. Reson. Med. Off. J. Soc. Magn. Reson. Med. / Soc. Magn. Reson. Med. 2007;57(2):437–441. doi: 10.1002/mrm.21143. 17260381 [DOI] [PMC free article] [PubMed] [Google Scholar]
- Godefroy O., Azouvi P., Robert P., Roussel M., LeGall D., Meulemans T., Groupe de Réflexion sur l'Evaluation des Fonctions Exécutives Study Group Dysexecutive syndrome: diagnostic criteria and validation study. Ann. Neurol. 2010;68(6):855–864. doi: 10.1002/ana.22117. 21194155 [DOI] [PubMed] [Google Scholar]
- Granziera C., Daducci A., Simioni S., Cavassini M., Roche A., Meskaldji D., Kober T., Metral M., Calmy A., Helms G., Hirschel B., Lazeyras F., Meuli R., Krueger G., Du Pasquier R.A. Micro-structural brain alterations in aviremic HIV+ patients with minor neurocognitive disorders: a multi-contrast study at high field. PLOS ONE. 2013;8(9):e72547. doi: 10.1371/journal.pone.0072547. 24039777 [DOI] [PMC free article] [PubMed] [Google Scholar]
- Haller S., Bartsch A., Nguyen D., Rodriguez C., Emch J., Gold G., Lovblad K.O., Giannakopoulos P. Cerebral microhemorrhage and iron deposition in mild cognitive impairment: susceptibility-weighted MR imaging assessment. Radiology. 2010;257(3):764–773. doi: 10.1148/radiol.10100612. 20923870 [DOI] [PubMed] [Google Scholar]
- Haris M., McArdle E., Fenty M., Singh A., Davatzikos C., Trojanowski J.Q., Melhem E.R., Clark C.M., Borthakur A. Early marker for Alzheimer's disease: hippocampus T1rho (T(1rho)) estimation. J. Magn. Reson. Imaging. 2009;29(5):1008–1012. doi: 10.1002/jmri.21735. 19388096 [DOI] [PMC free article] [PubMed] [Google Scholar]
- Helms G. Tissue properties from quantitative MRI. In: Toga A.W., editor. Brain Mapping: An Encyclopedic Reference. Elsevier; Oxford: 2014. [Google Scholar]
- Helms G., Draganski B., Frackowiak R., Ashburner J., Weiskopf N. Improved segmentation of deep brain grey matter structures using magnetization transfer (MT) parameter maps. NeuroImage. 2009;47(1):194–198. doi: 10.1016/j.neuroimage.2009.03.053. 19344771 [DOI] [PMC free article] [PubMed] [Google Scholar]
- Henkelman R.M., Stanisz G.J., Graham S.J. Magnetization transfer in MRI: a review. N.M.R. Biomed. 2001;14(2):57–64. doi: 10.1002/nbm.683. 11320533 [DOI] [PubMed] [Google Scholar]
- House M.J., St Pierre T.G., Foster J.K., Martins R.N., Clarnette R. Quantitative MR imaging R2 relaxometry in elderly participants reporting memory loss. A.J.N.R. Am. j. neuroradiol. 2006;27(2):430–439. 16484425 [PMC free article] [PubMed] [Google Scholar]
- Hughes C.P., Berg L., Danziger W.L., Coben L.A., Martin R.L. A new clinical scale for the staging of dementia. Br. J. psychiatry j. ment. sci. 1982;140(6):566–572. doi: 10.1192/bjp.140.6.566. [DOI] [PubMed] [Google Scholar]
- Levitt M.H. Spin Dynamics: Basics of Nuclear Magnetic Resonance. second edition. Wiley-Blackwell; New York: 2008. [Google Scholar]
- Jack C.R., Jr., Bernstein M.A., Borowski B.J., Gunter J.L., Fox N.C., Thompson P.M., Schuff N., Krueger G., Killiany R.J., Decarli C.S., Dale A.M., Carmichael O.W., Tosun D., Weiner M.W., Alzheimer's Disease Neuroimaging Initiative Update on the magnetic resonance imaging core of the Alzheimer's disease neuroimaging initiative. Alzheimers Dement. 2010;6(3):212–220. doi: 10.1016/j.jalz.2010.03.004. [DOI] [PMC free article] [PubMed] [Google Scholar]
- Jorm A.F., Jacomb P.A. The informant questionnaire on cognitive decline in the elderly (IQCODE): socio-demographic correlates, reliability, validity and some norms. Psychol. Med. 1989;19(4):1015–1022. doi: 10.1017/s0033291700005742. 2594878 [DOI] [PubMed] [Google Scholar]
- Kabani N.J., Sled J.G., Chertkow H. Magnetization transfer ratio in mild cognitive impairment and dementia of Alzheimer's type. NeuroImage. 2002;15(3):604–610. doi: 10.1006/nimg.2001.0992. 11848703 [DOI] [PubMed] [Google Scholar]
- Kabani N.J., Sled J.G., Shuper A., Chertkow H. Regional magnetization transfer ratio changes in mild cognitive impairment. Magn. Reson. Med. Off. J. Soc. Magn. Reson. Med. / Soc. Magn. Reson. Med. 2002;47(1):143–148. doi: 10.1002/mrm.10028. 11754453 [DOI] [PubMed] [Google Scholar]
- Katz S. Assessing self-maintenance: activities of daily living, mobility, and instrumental activities of daily living. J. Am. Geriatr. Soc. 1983;31(12):721–727. doi: 10.1111/j.1532-5415.1983.tb03391.x. 6418786 [DOI] [PubMed] [Google Scholar]
- Kiefer C., Brockhaus L., Cattapan-Ludewig K., Ballinari P., Burren Y., Schroth G., Wiest R. Multi-parametric classification of Alzheimer's disease and mild cognitive impairment: the impact of quantitative magnetization transfer MR imaging. NeuroImage. 2009;48(4):657–667. doi: 10.1016/j.neuroimage.2009.07.005. 19607926 [DOI] [PubMed] [Google Scholar]
- Klein S., Staring M., Murphy K., Viergever M.A., Pluim J.P. elastix: a toolbox for intensity-based medical image registration. I.E.E.E. Transactions Med. Imaging. 2010;29(1):196–205. doi: 10.1109/TMI.2009.2035616. 19923044 [DOI] [PubMed] [Google Scholar]
- Koenig S.H. Cholesterol of myelin is the determinant of gray-white contrast in MRI of brain. Magn. Reson. Med. Off. J. Soc. Magn. Reson. Med. / Soc. Magn. Reson. Med. 1991;20(2):285–291. doi: 10.1002/mrm.1910200210. 1775053 [DOI] [PubMed] [Google Scholar]
- Kucharczyk W., Macdonald P.M., Stanisz G.J., Henkelman R.M. Relaxivity and magnetization transfer of white matter lipids at MR imaging: importance of cerebrosides and pH. Radiology. 1994;192(2):521–529. doi: 10.1148/radiology.192.2.8029426. 8029426 [DOI] [PubMed] [Google Scholar]
- Labadie C., Lee J.H., Rooney W.D., Jarchow S., Aubert-Frécon M., Springer C.S., Jr., Möller H.E. Myelin water mapping by spatially regularized longitudinal relaxographic imaging at high magnetic fields. Magn. Reson. Med. Off. J. Soc. Magn. Reson. Med. / Soc. Magn. Reson. Med. 2014;71(1):375–387. doi: 10.1002/mrm.24670. 23468414 [DOI] [PubMed] [Google Scholar]
- Lamar M., Zhou X.J., Charlton R.A., Dean D., Little D., Deoni S.C. In vivo quantification of white matter microstructure for use in aging: a focus on two emerging techniques. Am. J. geriatr. psychiatry off. j. Am. Assoc. Geriatr. Psychiatry. 2014;22(2):111–121. doi: 10.1016/j.jagp.2013.08.001. 24080382 [DOI] [PMC free article] [PubMed] [Google Scholar]
- Langkammer C., Krebs N., Goessler W., Scheurer E., Ebner F., Yen K., Fazekas F., Ropele S. Quantitative MR imaging of brain iron: a postmortem validation study. Radiology. 2010;257(2):455–462. doi: 10.1148/radiol.10100495. 20843991 [DOI] [PubMed] [Google Scholar]
- Lawton M.P., Brody E.M. Assessment of older people: self-maintaining and instrumental activities of daily living. Gerontologist. 1969;9(3):179–186. 5349366 [PubMed] [Google Scholar]
- Leung K.K., Bartlett J.W., Barnes J., Manning E.N., Ourselin S., Fox N.C., Alzheimer's Disease Neuroimaging Initiative Cerebral atrophy in mild cognitive impairment and Alzheimer disease: rates and acceleration. Neurology. 2013;80(7):648–654. doi: 10.1212/WNL.0b013e318281ccd3. 23303849 [DOI] [PMC free article] [PubMed] [Google Scholar]
- Marques J.P., Kober T., Krueger G., van der Zwaag W., Van de Moortele P.F., Gruetter R. MP2RAGE, a self bias-field corrected sequence for improved segmentation and T1-mapping at high field. NeuroImage. 2010;49(2):1271–1281. doi: 10.1016/j.neuroimage.2009.10.002. 19819338 [DOI] [PubMed] [Google Scholar]
- McConathy J., Sheline Y.I. Imaging biomarkers associated with cognitive decline: a review. Biol. Psychiatry. 2015;77(8):685–692. doi: 10.1016/j.biopsych.2014.08.024. 25442005 [DOI] [PMC free article] [PubMed] [Google Scholar]
- McKhann G., Drachman D., Folstein M., Katzman R., Price D., Stadlan E.M. Clinical diagnosis of Alzheimer's disease: report of the NINCDS-ADRDA Work Group under the auspices of Department of Health and Human Services Task Force on Alzheimer's Disease. Neurol. 1984;34(7):939–944. doi: 10.1212/wnl.34.7.939. 6610841 [DOI] [PubMed] [Google Scholar]
- Meadowcroft M.D., Connor J.R., Smith M.B., Yang Q.X. MRI and histological analysis of beta-amyloid plaques in both human Alzheimer's disease and APP/PS1 transgenic mice. J. magn. reson. imaging. 2009;29(5):997–1007. doi: 10.1002/jmri.21731. 19388095 [DOI] [PMC free article] [PubMed] [Google Scholar]
- Morris J.C. The clinical dementia rating (CDR): current version and scoring rules. Neurology. 1993;43(11):2412–2414. doi: 10.1212/wnl.43.11.2412-a. 8232972 [DOI] [PubMed] [Google Scholar]
- Morris J.C., Storandt M., Miller J.P., McKeel D.W., Price J.L., Rubin E.H., Berg L. Mild cognitive impairment represents early-stage Alzheimer disease. Arch. neurol. 2001;58(3):397–405. doi: 10.1001/archneur.58.3.397. 11255443 [DOI] [PubMed] [Google Scholar]
- Müller D.K., Pampel A., Möller H.E. Matrix-algebra-based calculations of the time evolution of the binary spin-bath model for magnetization transfer. J. magn. reson. 2013;230:88–97. doi: 10.1016/j.jmr.2013.01.013. 23454578 [DOI] [PubMed] [Google Scholar]
- Osborne J.W. Improving your data transformations: applying Box–Cox transformations as a best practice. Pract. Assess. Res. Eval. 2010;15:1–9. [Google Scholar]
- Petersen R.C., Negash S. Mild cognitive impairment: an overview. C.N.S. Spectr. 2008;13(1):45–53. doi: 10.1017/s1092852900016151. 18204414 [DOI] [PubMed] [Google Scholar]
- Reisberg B., Franssen E.H., Souren L.E., Auer S.R., Akram I., Kenowsky S. Evidence and mechanisms of retrogenesis in Alzheimer's and other dementias: management and treatment import. Am. J. Alzheimers dis. other demen. 2002;17(4):202–212. doi: 10.1177/153331750201700411. 12184509 [DOI] [PMC free article] [PubMed] [Google Scholar]
- Roche A., Ribes D., Bach-Cuadra M., Krüger G. On the convergence of em-like algorithms for image segmentation using Markov random fields. Med. Image Anal. 2011;15(6):830–839. doi: 10.1016/j.media.2011.05.002. 21621449 [DOI] [PubMed] [Google Scholar]
- Scheltens P., Barkhof F., Leys D., Wolters E.C., Ravid R., Kamphorst W. Histopathologic correlates of white matter changes on MRI in Alzheimer's disease and normal aging. Neurol. 1995;45(5):883–888. doi: 10.1212/wnl.45.5.883. 7746401 [DOI] [PubMed] [Google Scholar]
- Schmitter D., Roche A., Maréchal B., Ribes D., Abdulkadir A., Bach-Cuadra M., Daducci A., Granziera C., Klöppel S., Maeder P., Meuli R., Krueger G., Alzheimer's Disease Neuroimaging Initiative An evaluation of volume-based morphometry for prediction of mild cognitive impairment and Alzheimer's disease. Neuroimage Clin. 2015;7:7–17. doi: 10.1016/j.nicl.2014.11.001. 25429357 [DOI] [PMC free article] [PubMed] [Google Scholar]
- Schuff N., Zhu X.P. Imaging of mild cognitive impairment and early dementia. Br. J. radiol. 2007;80(Spec No 2):S109–S114. doi: 10.1259/bjr/63830887. 18445740 [DOI] [PubMed] [Google Scholar]
- Smith M.A., Zhu X., Tabaton M., Liu G., McKeel D.W., Jr., Cohen M.L., Wang X., Siedlak S.L., Dwyer B.E., Hayashi T., Nakamura M., Nunomura A., Perry G. Increased iron and free radical generation in preclinical Alzheimer disease and mild cognitive impairment. J. Alzheimers dis. JAD. 2010;19(1):363–372. doi: 10.3233/JAD-2010-1239. 20061651 [DOI] [PMC free article] [PubMed] [Google Scholar]
- Stüber C., Morawski M., Schäfer A., Labadie C., Wähnert M., Leuze C., Streicher M., Barapatre N., Reimann K., Geyer S., Spemann D., Turner R. Myelin and iron concentration in the human brain: a quantitative study of MRI contrast. NeuroImage. 2014;93(1):95–106. doi: 10.1016/j.neuroimage.2014.02.026. 24607447 [DOI] [PubMed] [Google Scholar]
- Van der Linden M., Juillerat A.C. Neuropsychological rehabilitation in early stage Alzheimer's disease: principles, methods and perspectives. Rev. Neurol. (Paris) 2004;160(4 Pt 2):S64–S70. doi: 10.1016/s0035-3787(04)70945-5. 15118554 [DOI] [PubMed] [Google Scholar]
- van Es A.C., van der Flier W.M., Admiraal-Behloul F., Olofsen H., Bollen E.L., Middelkoop H.A., Weverling-Rijnsburger A.W., van der Grond J., Westendorp R.G., van Buchem M.A. Lobar distribution of changes in gray matter and white matter in memory clinic patients: detected using magnetization transfer imaging. A.J.N.R. Am. j. neuroradiol. 2007;28(10):1938–1942. doi: 10.3174/ajnr.A0687. 17925378 [DOI] [PMC free article] [PubMed] [Google Scholar]
- van Es A.C., van der Flier W.M., Admiraal-Behloul F., Olofsen H., Bollen E.L., Middelkoop H.A., Weverling-Rijnsburger A.W., Westendorp R.G., van Buchem M.A. Magnetization transfer imaging of gray and white matter in mild cognitive impairment and Alzheimer's disease. Neurobiol. aging. 2006;27(12):1757–1762. doi: 10.1016/j.neurobiolaging.2005.09.042. 16290268 [DOI] [PubMed] [Google Scholar]
- Vavasour I.M., Laule C., Li D.K., Traboulsee A.L., MacKay A.L. Is the magnetization transfer ratio a marker for myelin in multiple sclerosis? J. magn. reson. imaging. 2011;33(3):713–718. doi: 10.1002/jmri.22441. 21563257 [DOI] [PubMed] [Google Scholar]
- Vemuri P., Wiste H.J., Weigand S.D., Knopman D.S., Trojanowski J.Q., Shaw L.M., Bernstein M.A., Aisen P.S., Weiner M., Petersen R.C., Jack C.R., Jr., Alzheimer's Disease Neuroimaging Initiative Serial MRI and CSF biomarkers in normal aging, MCI, and AD. Neurology. 2010;75(2):143–151. doi: 10.1212/WNL.0b013e3181e7ca82. 20625167 [DOI] [PMC free article] [PubMed] [Google Scholar]
- Weintraub S., Wicklund A.H., Salmon D.P. The neuropsychological profile of Alzheimer disease. Cold Spring Harb. Perspect. Med. 2012;2(4):a006171. doi: 10.1101/cshperspect.a006171. 22474609 [DOI] [PMC free article] [PubMed] [Google Scholar]
- Westman E., Muehlboeck J.S., Simmons A. Combining MRI and CSF measures for classification of Alzheimer's disease and prediction of mild cognitive impairment conversion. NeuroImage. 2012;62(1):229–238. doi: 10.1016/j.neuroimage.2012.04.056. 22580170 [DOI] [PubMed] [Google Scholar]
- Winblad B., Palmer K., Kivipelto M., Jelic V., Fratiglioni L., Wahlund L.O., Nordberg A., Bäckman L., Albert M., Almkvist O., Arai H., Basun H., Blennow K., de Leon M., DeCarli C., Erkinjuntti T., Giacobini E., Graff C., Hardy J., Jack C., Jorm A., Ritchie K., van Duijn C., Visser P., Petersen R.C. Mild cognitive impairment − beyond controversies, towards a consensus: report of the International Working Group on mild cognitive impairment. J. intern. med. 2004;256(3):240–246. doi: 10.1111/j.1365-2796.2004.01380.x. 15324367 [DOI] [PubMed] [Google Scholar]
- Wolff S.D., Balaban R.S. Magnetization transfer contrast (MTC) and tissue water proton relaxation in vivo. Magn. Reson. Med. Off. J. Soc. Magn. Reson. Med. / Soc. Magn. Reson. Med. 1989;10(1):135–144. doi: 10.1002/mrm.1910100113. 2547135 [DOI] [PubMed] [Google Scholar]
- Zhang D., Wang Y., Zhou L., Yuan H., Shen D., Alzheimer's Disease Neuroimaging Initiative Multimodal classification of Alzheimer's disease and mild cognitive impairment. NeuroImage. 2011;55(3):856–867. doi: 10.1016/j.neuroimage.2011.01.008. 21236349 [DOI] [PMC free article] [PubMed] [Google Scholar]
- Zigmond A.S., Snaith R.P. The hospital anxiety and depression scale. Acta Psychiatr. Scand. 1983;67(6):361–370. doi: 10.1111/j.1600-0447.1983.tb09716.x. 6880820 [DOI] [PubMed] [Google Scholar]