

Abstract
In this study, we present the novel findings that chronic ethanol consumption induces mitochondrial protein hyperacetylation in the kidney and correlates with significantly increased renal oxidative stress. A major proteomic footprint of alcoholic liver disease (ALD) is an increase in hepatic mitochondrial protein acetylation. Protein hyperacetylation has been shown to alter enzymatic function of numerous proteins and plays a role in regulating metabolic processes. Renal mitochondrial targets of hyperacetylation include numerous metabolic and antioxidant pathways, such as lipid metabolism, oxidative phosphorylation, and amino acid metabolism, as well as glutathione and thioredoxin pathways. Disruption of protein lysine acetylation has the potential to impair renal function through metabolic dysregulation and decreased antioxidant capacity. Due to a significant elevation in ethanol-mediated renal oxidative stress, we highlight the acetylation of superoxide dismutase, peroxiredoxins, glutathione reductase, and glutathione transferase enzymes. Since oxidative stress is a known factor in ethanol-induced nephrotoxicity, we examined biochemical markers of protein hyperacetylation and oxidative stress. Our results demonstrate increased protein acetylation concurrent with depleted glutathione, altered Cys redox potential, and the presence of 4-HNE protein modifications in our 6-week model of early-stage alcoholic nephrotoxicity. These findings support the hypothesis that ethanol metabolism causes an influx of mitochondrial metabolic substrate, resulting in mitochondrial protein hyperacetylation with the potential to impact mitochondrial metabolic and antioxidant processes.
Keywords: Ethanol, Kidney, Acetylation, 4-Hydroxynonenal, Oxidative stress, Glutathione
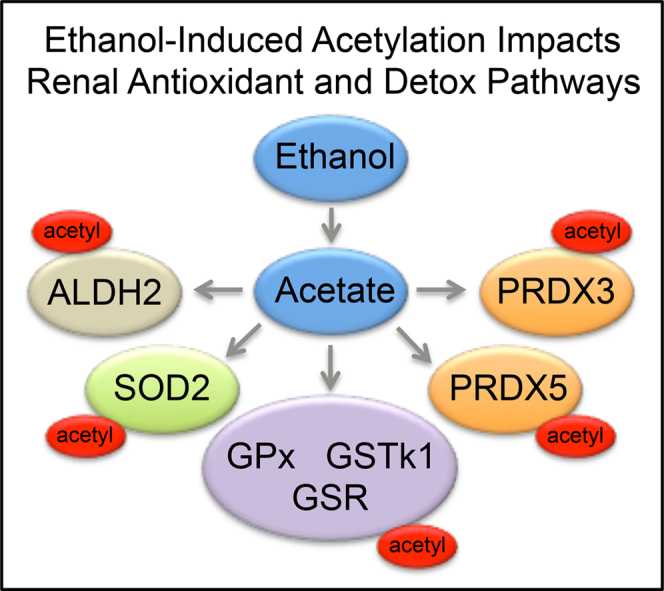
Graphical abstract
Highlights
-
•
Chronic ethanol metabolism induces mitochondrial protein hyperacetylation in the kidney.
-
•
Ethanol-induced hyperacetylation occurs on metabolic and antioxidant proteins.
-
•
The onset of renal oxidative stress correlates with mitochondrial protein hyperacetylation.
1. Introduction
A recent report by the World Health Organization found that roughly 3.3 million deaths, or 5.9% of all global deaths, were attributable to alcohol consumption [1]. While the dangers of alcohol consumption are well known, the precise molecular and cellular mechanisms of tissue injury associated with chronic alcohol use are highly complex and multifactorial [2–4]. Oxidative stress is thought to play a role in ethanol-induced renal damage [5].
The liver is a primary target organ of ethanol toxicity, causing pathologies like steatosis, inflammation, and oxidative stress [6]. The onset of alcoholic liver disease (ALD) correlates with chronic kidney disease; however, the impact of ethanol consumption on renal function remains largely unexamined [7]. Disruptions in renal function include increased oxidative stress and endothelial dysfunction [8]. While some studies suggest that chronic ethanol ingestion is not nephrotoxic, the development of acute kidney injury (AKI) associates with the mortality of ALD [5,8]. Thus, due to the fact that chronic ethanol consumption affects organ systems other than the liver, understanding the mechanisms that lead to impaired renal function is central to alleviating ethanol-related mortality.
A major proteomic footprint of ALD is a substantial increase in mitochondrial protein acetylation [9–11]. Protein hyperacetylation induces a suppressive effect on many metabolic pathways and likely plays a key role in regulating mitochondrial processes, such as antioxidant defense and energy metabolism [12]. Although enzymatic mechanisms of acetylation occur via acetyltransferase enzymes, mitochondrial protein acetylation is now hypothesized to occur mainly through non-enzymatic mechanisms [13–15]. The mitochondrial deacetylase sirtuin 3 (SIRT3) removes specific sites of acetylation; however, SIRT3 expression and activity are unchanged in a 6-week Lieber–DeCarli model of ethanol toxicity [16]. A current hypothesis suggests that lysine acetylation serves, in part, as a covalent imprint of metabolic status, such as over-nutrition or under-nutrition [17]. Ethanol metabolism provides a hyper-influx of metabolic substrate through an overabundance of acetate. Amelioration of excess acetate generated from ethanol metabolism is primarily handled through lipid synthesis and cellular export into the bloodstream [18]. An intriguing and novel pathway for compensating with this acetate burden is through the non-enzymatic acetylation of protein lysine residues via acetyl-CoA.
Here, we report that ethanol-induced mitochondrial protein hyperacetylation occurs in the kidney. Utilizing a 6-week murine model of chronic ethanol consumption, renal mitochondrial proteins were examined by highly sensitive and specific acetylomics techniques, revealing ethanol-dependent increases in acetylated proteins. Pathway analyses demonstrated that hyperacetylated proteins from renal mitochondria are involved in a number of metabolic pathways, like the TCA cycle, oxidative phosphorylation, β-oxidation, and antioxidant defense. A key finding relating to a mechanism of alcoholic nephrotoxicity is the hyperacetylation of numerous antioxidant proteins. These hyperacetylated proteins include superoxide dismutase (SOD2), peroxiredoxins (PRX), glutathione reductase (GSR), and glutathione transferase (GST) enzymes. Given these particular targets of hyperacetylation, we examined markers of oxidative stress, including increased lipid peroxidation and altered renal cysteine and glutathione redox status.
2. Materials and methods
2.1. Animal studies
All procedures involving animals were approved by the Institutional Animal Care and Use Committee of the University of Colorado and were performed in accordance with published National Institutes of Health guidelines. Male, C57BL/6J mice were obtained (Jackson Laboratories) for pair-fed ethanol feeding studies (n=12). Mice were fed a modified Lieber–DeCarli liquid diet (Bio-Serv, Frenchtown, NJ) for 6 weeks as previously described [10,19]. Upon study completion, animals were anesthetized via intraperitoneal injection of sodium pentobarbital and euthanized via exsanguination. Kidneys were excised, weighed, and subjected to differential centrifugation using a sucrose gradient for subcellular fractionation to obtain mitochondrial-enriched fractions. Assays for plasma alanine aminotransferase (ALT) (Sekisui, Lexington, MA), hepatic and plasma triglycerides (Sekisui, Lexington, MA), plasma creatinine (Cayman, Ann Arbor, Michigan), and blood ethanol (BioAssay Systems, Hayward, CA) were performed as described elsewhere [20].
2.2. Western blotting
For immunoblotting, 25 µg of kidney mitochondrial extract were separated by standard SDS-PAGE using 12% gels run at 150 V for 1.5 h and transferred to a Hybond-PVDF membrane (GE Healthcare, Buckinghamshire, UK). Membranes were blocked for 60 min with TBS/0.1% Tween (TBS-T) and 5% non-fat dry milk (NFDM). Membranes were then probed with primary antibodies directed against acetyl-Lys (Cell Signaling, Danvers, MA). A protein assay (BCA) and paired VDAC Western using the identical conditions were performed to verify load control for the acetyl-Lys Western. Following 3 washes with TBS-T, a horseradish peroxidase conjugated secondary was applied for one hour at a 1:10,000 dilution and membrane visualization was performed via Storm Imager (GE Lifesciences, Pittsburgh, PA). Band intensities were quantified using Image J [21].
2.3. Immunohistochemistry
Sections of freshly excised kidney tissue were placed in 10% neutral buffered formalin (Sigma) for 16 h, followed by incubation in 70% ethanol overnight. Samples were processed, embedded in paraffin, cut, and sections mounted on slides by the University of Colorado Anschutz Medical Center Histology Core. Standard hematoxylin and eosin (H&E) and periodic-acid Schiff (PAS) staining was performed. Immunohistochemical characterization was performed using rabbit polyclonal antibodies directed against 4-HNE (in-house), cytochrome P450-2E1 (Cyp2E1) (Millipore, Billerica, MA) and acetyl-lysine (Cell Signaling, Woburn, MA) as described [22–24]. Histologic images were captured on an Olympus BX51 microscope equipped with a four megapixel Macrofire digital camera (Optronics; Goleta, CA) using the PictureFrame Application 2.3 (Optronics). Images in any composite were cropped and assembled in an identical way using Photoshop CS2 (Adobe Systems, Inc.; Mountain View, CA).
2.4. Determination of renal Cys and GSH redox status
Renal concentrations of cysteine (Cys), cystine (CySS), GSH, and GSSG were determined using a method by Jones et al.[49]. Briefly, a small piece of kidney tissue was extracted using 500 μL of a 5% (w/v) perchloric acid solution containing 0.2 M boric acid and 10 μM γ-Glu-Glu. The tissue was sonicated and protein was pelleted via centrifugation. 300 μL of supernatant was then incubated with iodoacetic acid for 20 min in the dark, then derivatized with dansyl chloride overnight at room temperature in the dark. Unreacted dansyl chloride was extracted using chloroform and the mixture was centrifuged. The aqueous layer (upper layer) was then analyzed by HPLC and fluorescence detection. The redox potentials for Cys (EhCySS) and GSH (EhGSSG) were calculated using the Nernst equation.
2.5. Acetylomics
Kidney mitochondrial proteins (1 mg) were trypsin-digested and incubated overnight at 4 °C with acetyl-Lys antibody conjugated to agarose (80 μL bead slurry, Immunechem, Burnaby, British Columbia, Canada) [10]. After incubation, supernatants were removed and the beads were washed 5× with ice cold PBS. Peptides were eluted with 0.1 N HCl three times, pooled, evaporated to dryness, resuspended in 0.1% TFA in water, purified via C18 ZipTip (EMD Millipore), and resuspended in 0.1% formic acid in water for LC–MS/MS analysis. Identification of acetylated mitochondrial peptides was performed using nHPLC–MS/MS at a flow rate of 300 nL/min with a gradient of 5–40% 0.1% formic acid in acetonitrile (ACN) over 240 min on C18 trapping (20×0.1 mm2) and analytical columns (250×0.075 mm2). The nLC was coupled to a nano-ESI source and Impact HD Q-TOF mass spectrometer (Bruker Daltonics, Inc., Billerica, MA). The instrument was operated using intensity dependent CID MS/MS. MS/MS data analysis was performed using Mascot (version 2.2.04, Matrixscience) by Proteinscape (Bruker Daltonics, Billerica, MA). The final protein list included only protein IDs with a probability of 99% or greater and peptide IDs required a 95% cutoff. Manual validation of each acetylated peptide ID was performed to discard false positives and only acetylated peptides were included in our pathway analysis. The resulting gene list of acetylated proteins was analyzed by the Database for Annotation, Visualization and Integrated Discovery (DAVID, v6.7) for biological process enrichment [25]. Significance was determined by fold enrichment >5.0 and Benjamini corrected p<0.001.
2.6. Statistical analysis
Statistical analysis and generation of graphs were performed using GraphPad Prism 4.02 (GraphPad Software, San Diego, CA). Differences between control- and ethanol-fed mice were assessed using an unpaired Student’s t-test. Differences were considered significant if p<0.05 as determined using Student’s t-test.
3. Results
3.1. Chronic ethanol consumption alters hepatic and renal parameters
The data presented in Table 1 details the impact of this 6-week chronic ethanol model on liver and kidney parameters. Consistent with previous reports of liver injury using a similar model, a significant increase in plasma and hepatic triglycerides, and plasma ALT was observed [26,27]. Examining renal toxicity, plasma creatinine levels were elevated 1.6-fold following chronic ethanol consumption. Blood urea nitrogen levels were unchanged (data not shown), indicating a very early stage of ethanol-mediated nephrotoxicity. Additionally, blood ethanol was found to be 245.6 mg/dL at the completion of the ethanol challenge, consistent with other models of ethanol toxicity [20]. Together, these data demonstrate that this pair-feeding model results in the early-stages of both hepatic and renal pathology due to ethanol toxicity.
Table 1.
Biochemical markers of ethanol toxicity.
| Parameter╪ | Control | Ethanol |
|---|---|---|
| ALT (IU/L) | 45.90±2.39 | 84.37±7.20b |
| Liver triglycerides (mmol/L/mg) | 0.044±0.015 | 0.077±0.036a |
| Plasma Triglycerides (mmol/L) | 0.301±0.015 | 0.423±0.020a |
| Plasma Creatinine (μmol/L) | 138.54±11.05 | 230.54±8.40b |
| Blood Ethanol (mg/dL) | N/A | 245.6±24.5 |
Letter superscripts (a) or (b) denote significant difference of p<0.05 or p<0.01.
Data are presented as mean±SEM. Statistical significance was determined by paired Student’s t-test.
3.2. Ethanol-induced renal mitochondrial protein hyperacetylation
Since nephrotoxicity is associated with alcohol consumption and ethanol-fed mice display mitochondrial protein hyperacetylation, we investigated the acetylation of renal mitochondrial proteins as a result of ethanol feeding [5, 9]. Chronic ethanol consumption increased mitochondrial protein acetylation in renal tissue by approximately 60% compared to controls, p>0.05 (Fig. 1). To further characterize ethanol-induced renal protein hyperacetylation, immunohistochemistry was performed using renal tissue sections and a polyclonal antibody to acetyl-lysine. Increased renal acetyl-lysine staining was evident in both the proximal and distal convoluted tubules but not in the intertubule connective tissue or the vasculature (Fig. 1). Although strong acetyl-lysine staining was observed in the nuclei of some Loop of Henle epithelia and Glomerular nuclei, the number of nuclei strongly stained in the control and ethanol treated animals was similar.
Fig. 1.

Mitochondrial protein acetylation is increased in renal tissue of ethanol-fed mice. (A) Western blot (n=3 mice per group) and (B) Immunohistochemical analysis with anti-acetyl-lysine antibody demonstrate a significant increase in protein acetylation in renal tissue due to ethanol metabolism (*P<0.05) (size bar=50 μm).
Since protein acetylation is highly associated with ethanol metabolism, ethanol-inducible Cyp2E1 was monitored and found to be highly elevated in the ethanol-fed mice compared to the pair-fed control mice (Fig. 2) [5]. Cyp2E1 therefore serves as a robust marker for the presence of renal ethanol metabolism. To investigate altered renal pathology due to Cyp2E1 induction, PAS staining was performed. Histologic analysis of PAS stained sections of kidney did not reveal any grossly abnormal structures, lipid accumulation, fibrosis, or inflammation (Fig. 2). The relative thickness of the basement membranes of glomerular capillaries of juxtaglomerular glomeruli was examined, as was the tunica media thickness of the afferent arterioles for these same glomeruli, and no changes were observed between control and ethanol-fed mice. The absence of increased thickness in the basement membrane suggests that any defect in the filtration membrane is still at a very early stage. The absence of increased thickness in the afferent arteriole tunica media suggests that there is neither hypertension, nor the associated increased thickness of the glomerular basement membranes [28].
Fig. 2.

H&E staining (A and B) did not reveal any grossly abnormal structures, lipid accumulation, or inflammation. As observed by PAS staining, the glomerular basement membranes (blue arrows) and the muscular layer of the afferent arterioles (yellow arrows) of (C) WT and (D) EtOH fed mice were of similar thicknesses. Immunohistochemical analysis of kidney tissue demonstrates a major increase in Cyp2E1 protein levels between control (E) and ethanol feeding groups (F) and minor increase in 4-hydroxynonenal-protein adducts (G and H) as a result of ethanol metabolism (400× magnification). [P=proximal convoluted tubule, D=distal convoluted tubule, G=glomerulus, size bar=20 μm (C and D) and 50 μm (A, B, E, F, G and H).]
3.3. Ethanol consumption causes renal lipid peroxidation and significant oxidation of renal Cys redox potential (EhCySS) and GSH redox potential (EhGSSG)
We hypothesis that increased protein acetylation suppresses antioxidant protein function and leads to increased oxidative stress. Increased generation of reactive oxygen species (ROS) is known to contribute to the accumulation of lipid peroxidation products, including 4-HNE, and the subsequent electrophilic modification of both DNA and proteins [16,22,29]. To determine if 4-HNE protein adducts occur concomitant to protein hyperacetylation, renal tissue sections were analyzed for 4-HNE modified protein. As shown in Fig. 2, chronic ethanol exposure resulted in a slight increase in 4-HNE-protein adduction in proximal and distal convoluted tubule cells and their nuclei.
After 6-weeks of ethanol consumption, ethanol-fed animals displayed significant reductions in renal Cys, as well as renal CySS (Fig. 3). These reduced Cys and CySS levels resulted in a significant oxidation of the Cys/CySS redox potential (EhCySS). Ethanol-mediated changes in GSH, GSSG and the GSH/GSSG redox potential (EhGSSG) were also determined. As expected, ethanol-fed animals displayed a significant decrease in renal GSH without altering GSSG levels, thus resulting in a decreased EhGSSG ratio; therefore, oxidation of EhGSSG was driven primarily by the significant depletion of renal GSH. Together, these data indicate that ethanol consumption significantly oxidized both EhCySS and EhGSSG due to depletion of Cys, CySS and GSH, resulting in an oxidizing environment in the kidney.
Fig. 3.

Six weeks of ethanol consumption significantly alters renal cysteine and GSH redox status. Cys (A), CySS (B), GSH (D), and GSSG (E) were determined using dansyl chloride derivatization, HPLC, and fluorescence detection. Redox potential for cysteine (EhCySS, C) and GSH (EhGSSG, F) were calculated using the Nernst equation. N=5 per group; *P<0.05, **P<0.01.
3.4. Renal acetylome analysis
A mass spectrometry-based proteomics approach was utilized to compare acetylated peptides in renal mitochondrial extracts from control- and ethanol-fed mice. Mitochondrial acetyl-peptide analysis revealed striking details regarding ethanol-mediated lysine acetylation. A total of 294 acetylated peptides were identified in control kidney versus 454 in ethanol kidney. These findings establish a 55% increase in acetylated peptides in renal mitochondrial proteins due to ethanol consumption (Supplementary Table 1), which is in agreement with the observed 60% increase by the anti-acetyl-Lys Western analysis presented in Fig. 1. In total, 132 and 199 acetylated proteins were detected in the control and ethanol samples, respectively, and 116 of these proteins were identified in both sample groups (Fig. 4). The level of acetyl-Lys enrichment in kidney tissue represents an increase in both the number of sites of acetylation per protein as well as an increase in the number of MS/MS spectra that lead to acetyl-peptide identification for a specific acetylation event.
Fig. 4.

MS analysis reveals renal mitochondrial protein hyperacetylation during chronic ethanol consumption. A total of 215 unique acetylated proteins were identified by our acetylomics approach. 116 Proteins were found in both control and ethanol samples, with 16 and 83 found solely in control and ethanol, respectively. In total, 294 and 454 acetylated peptides were identified in control and ethanol samples, respectively, revealing a 55% increase in acetylated peptides found as a result of ethanol consumption.
In order to examine mitochondrial metabolic pathways impacted by acetylation in our renal tissue, the gene list of acetylated proteins was submitted for pathway analysis via DAVID [25]. Table 2 compares the similarities between metabolic pathways identified as a result of acetyl-peptide enrichment in renal tissue. Interestingly, the top-ranked biological processes were similar, but the level of significance for each pathway is different. Bioinformatics analyses for the enrichment of biological processes found a majority of mitochondrial pathways impacted by acetylation, such as, lipid metabolism, oxidative phosphorylation, and amino acid metabolism.
Table 2.
The top-ranked KEGG pathways or PIR keywords impacted by renal mitochondrial protein acetylation in control and ethanol groups.
| Biological pathway or keyword |
Benjamini (corrected p-value) |
|
|---|---|---|
| Control | Ethanol | |
| Mitochondrion | 8.30E−87 | 4.20E−133 |
| Transit peptide | 3.80E−70 | 4.90E−107 |
| Mitochondrion inner membrane | 2.70E−17 | 1.10E−35 |
| Fatty acid metabolism | 2.00E−25 | 9.40E−31 |
| Flavoprotein | 1.00E−17 | 5.30E−23 |
| Lipid metabolism | 2.40E−18 | 4.10E−20 |
| FAD | 1.60E−14 | 1.30E−19 |
| Peroxisome | 1.30E−24 | 1.90E−19 |
| Oxidative phosphorylation | 1.70E−07 | 1.80E−18 |
| Propanoate metabolism | 1.60E−07 | 3.50E−16 |
| NAD | 1.10E−16 | 1.90E−15 |
| Citrate cycle (TCA cycle) | 6.60E−10 | 1.90E−11 |
| Hydrogen ion transport | 3.10E−07 | 4.20E−10 |
| Lysine degradation | 8.30E−09 | 8.00E−10 |
| Transport | 7.70E−05 | 4.20E−09 |
| ATP synthesis | 7.30E−06 | 6.80E−09 |
| Tryptophan metabolism | 1.50E−06 | 1.40E−07 |
| Beta-alanine metabolism | 1.20E−04 | 3.20E−06 |
| Lyase | 2.00E−06 | 4.70E−05 |
| Limonene and pinene degradation | 4.00E−04 | 1.00E−04 |
KEGG pathway and PIR keywords with enrichment >5.0 and Benjamini <0.001.
A number of key redox protein targets were identified from our acetylomics analysis. Here, numerous antioxidant proteins demonstrated an increase in acetylation following ethanol treatment (Table 3). Our work discovered the hyperacetylation of superoxide dismutase (SOD2), glutathione peroxidase (GPx), glutathione S-transferase isoform Kappa 1 (GSTK1), glutathione reductase (GSR), peroxiredoxin 3 and 5 (PRDX3, PRDX5). GSR was acetylated only in the ethanol treatment group, and revealed a novel site of acetylation at Lys332. Of note for SOD2, a inhibitory site Lys122 was only found acetylated in the ethanol group [30]. Mitochondrial ethanol metabolizing enzymes were also targets of lysine acetylation, which included alcohol dehydrogenase (ZADH2), catalase (CATA), and aldehyde dehydrogenase (ALDH2) (Supplementary data).
Table 3.
Acetylation of antioxidant and detox related proteins identified in kidney mitochondrial isolate from control and ethanol-fed groups.
| Group | Cmpda | Peptide sequence | AcLys | |
|---|---|---|---|---|
| SOD2 | Cont | 1 | K.HSLPDLPYDYGALEPHINAQIMQLHHSKHHAAYVNNLNATEEK.Y | K53 |
| Cont | 6 | K.HHAAYVNNLNATEEKYHEALAK.G | K68 | |
| Cont | 1 | R.DFGSFEKFK.E | K130 | |
| EtOH | 27 | K.HHAAYVNNLNATEEKYHEALAK.G | K68 | |
| EtOH | 3 | K.GELLEAIKR.D | K122 | |
| EtOH | 5 | R.DFGSFEKFK.E | K130 | |
| GPx | Cont | 4 | K.YVRPGGGFEPNFTLFEKCEVNGEK.A | K112 |
| Cont | 1 | R.NALPTPSDDPTALMTDPKYIIWSPVCR.N | K146 | |
| EtOH | 1 | R.DYTEMNDLQKR.L | K62 | |
| EtOH | 5 | K.YVRPGGGFEPNFTLFEKCEVNGEK.A | K112 | |
| GSTK1 | Cont | 8 | K.AGMSTAQAQHFLEKISTQQVK.N | K158 |
| Cont | 1 | K.LIENTDAACKYGAFGLPTTVAHVDGK.T | K177 | |
| EtOH | 20 | K.AGMSTAQAQHFLEKISTQQVK.N | K158 | |
| EtOH | 12 | K.AGMSTAQAQHFLEKISTQQVK.N | K158 | |
| EtOH | 2 | K.LIENTDAACKYGAFGLPTTVAHVDGK.T | K177 | |
| GSR | EtOH | 2 | K.VGIQTDEKGHILVDEFQNTNVK.G | K332 |
| PRDX3 | Cont | 2 | K.ELSLDDFKGK.Y | K92 |
| EtOH | 7 | K.ELSLDDFKGK.Y | K92 | |
| PRDX5 | Cont | 5 | K.VNLAELFKGK.K | K79 |
| EtOH | 4 | K.KVNLAELFKGK.K | K79 | |
| EtOH | 7 | K.VNLAELFKGK.K | K79 | |
| ALDH2 | Cont | 3 | K.FKTIEEVVGR.A | K430 |
| Cont | 3 | R.ANDSKYGLAAAVFTK.D | K443 | |
| EtOH | 4 | R.KTFPTVNPSTGEVICQVAEGNKEDVDKAVK.A | K75 | |
| EtOH | 7 | K.TFPTVNPSTGEVICQVAEGNKEDVDKAVK.A | K75 | |
| EtOH | 10 | R.KTFPTVNPSTGEVICQVAEGNKEDVDKAVK.A | K80 | |
| EtOH | 3 | K.FKTIEEVVGR.A | K430 | |
| EtOH | 2 | R.ANDSKYGLAAAVFTK.D | K443 |
Modified residues are bold and represent: M—methionine oxidation, C—carbamidomethyl, K—acetyl. Novel acetyl-Lys identifications are highlighted in italicbold.
Cmpd is assigned by Proteinscape and represents number of MS/MS spectra that lead to the ID of the peptide. See Supplementary data for complete MS/MS dataset.
4. Discussion
In this report we demonstrate that ethanol-induced mitochondrial protein hyperacetylation occurs in the kidney during the early onset of alcohol toxicity. This protein hyperacetylation, which is known to perturb the function of some mitochondrial proteins, is believed to be a factor that contributes to ethanol-mediated mitochondrial dysfunction. Examining biochemical markers of ethanol toxicity such as plasma ALT and creatinine confirms the initial stages of liver and kidney dysfunction are occurring in our model; however, as noted above, lack of significant changes in BUN and PAS staining suggests the impact of ethanol on renal function is at an early stage [5]. Immunohistochemical analyses also demonstrate increased lipid peroxidation resulting from oxidative stress, as 4-HNE protein adducts are increased [31]. Furthermore, a significant level of oxidative stress is achieved, as revealed by significant oxidation of renal EhCySS and EhGSSG [20,32]. In aggregate, the present study defines renal mitochondrial protein hyperacetylation and oxidative stress in a model of alcohol toxicity.
An often-overlooked condition of those hospitalized with ALD is kidney failure, which contributes significantly to patient mortality [33]. While impaired kidney function is a known result of ethanol toxicity, elucidating mechanisms of ethanol-induced kidney damage requires further attention [8,34,35]. Recent literature has demonstrated numerous ethanol-related impairments of renal function. These include uptake and metabolism of folate, electrolyte balance, ATPase activity, growth factor and steroid utilization, and ultrastructural abnormalities, among others [8]. Furthermore, impaired fluid handling results in ascites and extensive liver damage results in hepatorenal syndrome [34]. The discovery of ethanol-induced renal protein hyperacetylation provides another avenue of investigation towards understanding biochemical pathways of ethanol nephrotoxicity. Additionally, these findings contribute to the elucidation of mechanisms contributing to mitochondrial dysfunction due to alcohol metabolism. Importantly, a recent publication showed that increased renal mitochondrial protein acetylation occurs in a model of diabetes [36]. Similar acetylation profiles in diabetic nephropathy and ethanol-induced nephropathy provide a common, yet unexplored, avenue of research regarding the impact of protein acetylation and mitochondrial function. In each instance, a broad array of biological processes are impacted by hyperacetylation in renal tissue and likely contributes to renal impairment in both models of ethanol nephrotoxicity and diabetic nephropathy.
Altered metabolic pathways are highlighted as prominent targets of renal hyperacetylation in our model. Previously observed metabolic effects of ethanol metabolism, and consequent increases in NADH/NADPH, result in altered glucose metabolism, amino acid metabolism, and β-oxidation [37,38]. Acetyl-targets are found throughout amino acid and fatty acid metabolism, and oxidative phosphorylation. Specifically, increased enrichment of biological pathways or keywords due to ethanol includes fatty acid metabolism, flavoprotein, lipid metabolism, FAD, oxidative phosphorylation, and propanoate metabolism. Interestingly, propanoate metabolism includes four enzymes related to acetyl-CoA generation and hyperacetylation of related proteins likely indicates a negative feedback from cellular acetate overload. Additionally, flavoprotein and FAD highlights a metabolic link between the TCA cycle and oxidative phosphorylation, likely depressed in part due to the suppressive effect of protein hyperacetylation. The kidney is a metabolically active tissue, involved in uptake and secretion of many substances, and these processes utilize transport systems that require ATP [39]. Therefore, hyperacetylation of proteins directly related to ATP production, could impair kidney function.
In addition to metabolic dysregulation, oxidative stress has recently been highlighted as a key player in ethanol nephrotoxicity [5,40,41]. Here, we present the novel finding that antioxidant proteins are hyperacetylated in the kidney due to ethanol consumption. These include SOD2, GPx, GSTK1, GSR, PRDX3, and PRDX5. A critical SOD2 lysine residue, K122, was found acetylated under ethanol-feeding conditions and was not identified in the control group. Also, acetylation of K68 was identified by a 4.5-fold increase in ethanol-fed mice versus control-fed mice. Acetylation of these residues is reported to significantly inhibit SOD2 activity, resulting in an increase in both superoxide concentrations and genomic instability [30,42]. These findings support, in part, a previously reported decrease in SOD2 activity during ethanol toxicity [43]. Furthermore, it has been shown that overexpression of SOD2 is effective against hepatocyte mitochondrial oxidative stress, and is protective against alcohol-induced liver injury, thereby implicating this regulatory site in ROS induced nephrotoxicity [44]. Peroxiredoxins have recently been reported to display decreased expression in models of ethanol consumption, contributing to mitochondrial redox imbalance [45,46]. Interestingly, we found PRX3 and PRX5 to be hyperacetylated in kidneys of ethanol-fed animals, yet further research is needed to uncover mechanisms of PRX regulation via lysine acetylation. Little is known regarding the impact of lysine acetylation on GPx, GSTK1, and GSR; however, glutathione depletion is a known consequence of ethanol toxicity and remains a prominent target for therapeutic intervention of ethanol toxicity [20,44]. Interestingly, we report the first ever identification of GSR acetylation at K322, which was identified only in the ethanol-fed group. This is an important observation, as chronic ethanol exposure has been shown to cause a significant decrease in GPx activity and GSH concentrations, and activation of glutathione reductase correlated with a recovery in GSH levels [47]. Additionally, ethanol consumption resulted in a 16 mV and 26 mV oxidation in EhCySS and EhGSSG, respectively. This is critically important, because a 30 mV change in the redox potential (EhGSSG) can result in a 10-fold change in the ratio of protein dithiol/disulfide motif [48]. Therefore, in addition to protein acetylation, significant protein oxidation could occur, resulting in dramatically altered protein function. These findings implicate a critical role for lysine hyperacetylation in ethanol-induced oxidative stress, glutathione regulation, and mitochondrial dysfunction.
The finding that protein hyperacetylation occurs during diabetic nephropathy and also during ethanol-induced kidney damage provides an exciting area of research linking mitochondrial protein acetylation, metabolic regulation, free radical defenses, and oxidative stress (Fig. 5). Overall, the findings presented here add another aspect to the already complex lysine acetylome landscape; in particular, the role protein hyperacetylation plays in ethanol-induced kidney damage. By perturbing mitochondrial processes through protein acetylation, ethanol metabolism provides a unique mechanism of enzymatic regulation and metabolic dysfunction via the non-enzymatic acetylation of lysine residues. These results raise the possibility of utilizing the regulatory function of lysine acetylation on protein function as a therapeutic target to alter the impact of ethanol consumption on mitochondrial processes, thereby protecting renal mitochondria as a means to retard the pathology of acute renal injury associated with high mortality outcomes in chronic alcohol toxicity. Since acetylation and oxidative stress are significantly increased in renal alcohol toxicity, future studies will focus on the impact of ethanol-induced hyperacetylation on antioxidant protein structure and function. Overall, these findings support the new hypothesis that due to an ethanol-mediated influx of acetate, the liver and kidney acetylate proteins involved in fatty acid, protein, and carbohydrate metabolism, as well as oxidative phosphorylation, and antioxidant pathways in order to prevent excessive input of respiration substrates. Consequently, deranged metabolism and oxidative stress may persist as a negative side effect of the non-enzymatic acetylation of mitochondrial proteins.
Fig. 5.

Ethanol metabolism induces renal mitochondrial protein hyperacetylation. Mounting evidence supports the conclusion ethanol metabolism results in an influx of carbon metabolic units into the mitochondria and stimulates the non-enzymatic acetylation of solvent accessible and electrostatic-amenable protein lysine residues. This hyperacetylation likely plays a role in altered protein function, contributing to renal dysfunction.
Conflict of interest
The authors have no conflict of interest to report.
Acknowledgments
This work was supported, in part, by NIH (Grants NIAAA-R01AA022146 (K.S.F.) and NIEHS-R00ES022266 (J.R.R.)). The authors acknowledge Joe Gomez and the Skaggs School of Pharmacy and Pharmaceutical Sciences Mass Spectrometry Core Facility for assistance with acetylomics sample analysis. The authors thank Guillaume Tremintin and Henri O’Connor at Bruker Daltonics for ProteinScape software support.
Footnotes
Supplementary data associated with this article can be found in the online version at doi:10.1016/j.redox.2015.06.021.
Supplementary data
Supplementary material
References
- 1.World Health Organization . World Health Organization; Geneva: 2014. Global Status Report on Alcohol and Health 2014. [Google Scholar]
- 2.Vidali M., Stewart S.F., Albano E. Interplay between oxidative stress and immunity in the progression of alcohol-mediated liver injury. Trends Mol. Med. 2008;14:63–71. doi: 10.1016/j.molmed.2007.12.005. [DOI] [PubMed] [Google Scholar]
- 3.Das S.K., Vasudevan D.M. Alcohol-induced oxidative stress. Life Sci. 2007;81:177–187. doi: 10.1016/j.lfs.2007.05.005. [DOI] [PubMed] [Google Scholar]
- 4.Seitz H.K., Lieber C.S., Stickel F., Salaspuro M., Schlemmer H.P., Horie Y. Alcoholic liver disease: from pathophysiology to therapy. Alcohol. Clin. Exp. Res. 2005;29:1276–1281. doi: 10.1097/01.alc.0000171896.37022.f7. [DOI] [PubMed] [Google Scholar]
- 5.Latchoumycandane C., Nagy L.E., McIntyre T.M. Chronic ethanol ingestion induces oxidative kidney injury through taurine-inhibitable inflammation. Free Radic. Biol. Med. 2014;69:403–416. doi: 10.1016/j.freeradbiomed.2014.01.001. [DOI] [PMC free article] [PubMed] [Google Scholar]
- 6.Lieber C.S. Alcoholic fatty liver: its pathogenesis and mechanism of progression to inflammation and fibrosis. Alcohol. 2004;34:9–19. doi: 10.1016/j.alcohol.2004.07.008. [DOI] [PubMed] [Google Scholar]
- 7.Labib M., Abdel-Kader M., Ranganath L., Martin S., Marks V. Impaired renal tubular function in chronic alcoholics. J. R. Soc. Med. 1989;82:139–141. doi: 10.1177/014107688908200307. [DOI] [PMC free article] [PubMed] [Google Scholar]
- 8.Das Kumar S., Vasudevan D.M. Alcohol induced effects on kidney. Indian J. Clin. Biochem. 2008;23:4–9. doi: 10.1007/s12291-008-0003-9. [DOI] [PMC free article] [PubMed] [Google Scholar]
- 9.Fritz K.S., Galligan J.J., Hirschey M.D., Verdin E., Petersen D.R. Mitochondrial acetylome analysis in a mouse model of alcohol-induced liver injury utilizing SIRT3 knockout mice. J. Proteome Res. 2012;11:1633–1643. doi: 10.1021/pr2008384. [DOI] [PMC free article] [PubMed] [Google Scholar]
- 10.Fritz K.S., Green M.F., Petersen D.R., Hirschey M.D. Ethanol metabolism modifies hepatic protein acylation in mice. PloS One. 2013;8:e75868. doi: 10.1371/journal.pone.0075868. [DOI] [PMC free article] [PubMed] [Google Scholar]
- 11.Picklo M.J., Sr. Ethanol intoxication increases hepatic n-lysyl protein acetylation. Biochem. Biophys. Res. Commun. 2008;376:615–619. doi: 10.1016/j.bbrc.2008.09.039. [DOI] [PubMed] [Google Scholar]
- 12.Choudhary C., Weinert B.T., Nishida Y., Verdin E., Mann M. The growing landscape of lysine acetylation links metabolism and cell signalling. Nat. Rev. Mol. Cell Biol. 2014;15:536–550. doi: 10.1038/nrm3841. [DOI] [PubMed] [Google Scholar]
- 13.Baeza J., Smallegan M.J., Denu J.M. Site-specific reactivity of nonenzymatic lysine acetylation. ACS Chem. Biol. 2015;10:122–128. doi: 10.1021/cb500848p. [DOI] [PMC free article] [PubMed] [Google Scholar]
- 14.Scott I., Webster B.R., Li J.H., Sack M.N. Identification of a molecular component of the mitochondrial acetyltransferase programme: a novel role for GCN5L1. Biochem. J. 2012;443:655–661. doi: 10.1042/BJ20120118. [DOI] [PMC free article] [PubMed] [Google Scholar]
- 15.Wagner G.R., Hirschey M.D. Nonenzymatic protein acylation as a carbon stress regulated by sirtuin deacylases. Mol. Cell. 2014;54:5–16. doi: 10.1016/j.molcel.2014.03.027. [DOI] [PMC free article] [PubMed] [Google Scholar]
- 16.Fritz K.S., Galligan J.J., Smathers R.L., Roede J.R., Shearn C.T., Reigan P., Petersen D.R. 4-hydroxynonenal inhibits SIRT3 via thiol-specific modification. Chem. Res. Toxicol. 2011;24:651–662. doi: 10.1021/tx100355a. [DOI] [PMC free article] [PubMed] [Google Scholar]
- 17.Ghanta S., Grossmann R.E., Brenner C. Mitochondrial protein acetylation as a cell-intrinsic, evolutionary driver of fat storage: chemical and metabolic logic of acetyl-lysine modifications. Crit. Rev. Biochem. Mol. Biol. 2013;48:561–574. doi: 10.3109/10409238.2013.838204. [DOI] [PMC free article] [PubMed] [Google Scholar]
- 18.Kendrick S.F., O’Boyle G., Mann J., Zeybel M., Palmer J., Jones D.E., Day C.P. Acetate, the key modulator of inflammatory responses in acute alcoholic hepatitis. Hepatology. 2010;51:1988–1997. doi: 10.1002/hep.23572. [DOI] [PubMed] [Google Scholar]
- 19.Lieber C.S., DeCarli L.M. The feeding of alcohol in liquid diets: two decades of applications and 1982 update. Alcohol. Clin. Exp. Res. 1982;6:523–531. doi: 10.1111/j.1530-0277.1982.tb05017.x. [DOI] [PubMed] [Google Scholar]
- 20.Smathers R.L., Galligan J.J., Shearn C.T., Fritz K.S., Mercer K., Ronis M., Orlicky D.J., Davidson N.O., Petersen D.R. Susceptibility of L-FABP−/− mice to oxidative stress in early-stage alcoholic liver. J. Lipid Res. 2013;54:1335–1345. doi: 10.1194/jlr.M034892. [DOI] [PMC free article] [PubMed] [Google Scholar]
- 21.Schneider C.A., Rasband W.S., Eliceiri K.W. Nih image to imagej: 25 years of image analysis. Nat. Methods. 2012;9:671–675. doi: 10.1038/nmeth.2089. [DOI] [PMC free article] [PubMed] [Google Scholar]
- 22.Shearn C.T., Smathers R.L., Backos D.S., Reigan P., Orlicky D.J., Petersen D.R. Increased carbonylation of the lipid phosphatase pten contributes to AKT2 activation in a murine model of early alcohol-induced steatosis. Free Radic. Biol. Med. 2013;65C:680–692. doi: 10.1016/j.freeradbiomed.2013.07.011. [DOI] [PMC free article] [PubMed] [Google Scholar]
- 23.Shearn C.T., Backos D.S., Orlicky D.J., Smathers-McCullough R.L., Petersen D.R. Identification of 5’ amp activated kinase as a target of reactive aldehydes during chronic ingestion of high concentrations of ethanol. J. Biol. Chem. 2014 doi: 10.1074/jbc.M113.543942. [DOI] [PMC free article] [PubMed] [Google Scholar]
- 24.Roede J.R., Orlicky D.J., Fisher A.B., Petersen D.R. Overexpression of peroxiredoxin 6 does not prevent ethanol-mediated oxidative stress and may play a role in hepatic lipid accumulation. J. Pharmacol. Exp. Ther. 2009;330:79–88. doi: 10.1124/jpet.109.152983. [DOI] [PMC free article] [PubMed] [Google Scholar]
- 25.Ashburner M., Ball C.A., Blake J.A., Botstein D., Butler H., Cherry J.M., Davis A.P., Dolinski K., Dwight S.S., Eppig J.T., Harris M.A., Hill D.P., Issel-Tarver L., Kasarskis A., Lewis S., Matese J.C., Richardson J.E., Ringwald M., Rubin G.M., Sherlock G. Gene ontology: tool for the unification of biology. The gene ontology consortium. Nat. Genet. 2000;25:25–29. doi: 10.1038/75556. [DOI] [PMC free article] [PubMed] [Google Scholar]
- 26.Galligan J.J., Smathers R.L., Shearn C.T., Fritz K.S., Backos D.S., Jiang H., Franklin C.C., Orlicky D.J., Maclean K.N., Petersen D.R. Oxidative stress and the ER stress response in a murine model for early-stage alcoholic liver disease. J. Toxicol. 2012;2012:207594. doi: 10.1155/2012/207594. [DOI] [PMC free article] [PubMed] [Google Scholar]
- 27.Shearn C.T., Smathers R.L., Jiang H., Orlicky D.J., Maclean K.N., Petersen D.R. Increased dietary fat contributes to dysregulation of the LKB1/AMPK pathway and increased damage in a mouse model of early-stage ethanol-mediated steatosis. J. Nutr. Biochem. 2013;24:1436–1445. doi: 10.1016/j.jnutbio.2012.12.002. [DOI] [PMC free article] [PubMed] [Google Scholar]
- 28.Vleming L.J., Baelde J.J., Westendorp R.G., Daha M.R., van Es L.A., Bruijn J.A. The glomerular deposition of PAS positive material correlates with renal function in human kidney diseases. Clin. Nephrol. 1997;47:158–167. [PubMed] [Google Scholar]
- 29.Smathers R.L., Galligan J.J., Stewart B.J., Petersen D.R. Overview of lipid peroxidation products and hepatic protein modification in alcoholic liver disease. Chem. Biol. Interact. 2011;192:107–112. doi: 10.1016/j.cbi.2011.02.021. [DOI] [PMC free article] [PubMed] [Google Scholar]
- 30.Tao R., Coleman M.C., Pennington J.D., Ozden O., Park S.H., Jiang H., Kim H.S., Flynn C.R., Hill S., Hayes McDonald W., Olivier A.K., Spitz D.R., Gius D. SIRT3-mediated deacetylation of evolutionarily conserved lysine 122 regulates mnsod activity in response to stress. Mol. Cell. 2010;40:893–904. doi: 10.1016/j.molcel.2010.12.013. [DOI] [PMC free article] [PubMed] [Google Scholar]
- 31.Fritz K.S., Petersen D.R. An overview of the chemistry and biology of reactive aldehydes. Free Radic. Biol. Med. 2013;59:85–91. doi: 10.1016/j.freeradbiomed.2012.06.025. [DOI] [PMC free article] [PubMed] [Google Scholar]
- 32.Jones D.P., Go Y.M., Anderson C.L., Ziegler T.R., Kinkade J.M., Jr., Kirlin W.G. Cysteine/cystine couple is a newly recognized node in the circuitry for biologic redox signaling and control. FASEB J. 2004;18:1246–1248. doi: 10.1096/fj.03-0971fje. [DOI] [PubMed] [Google Scholar]
- 33.Altamirano J., Fagundes C., Dominguez M., Garcia E., Michelena J., Cardenas A., Guevara M., Pereira G., Torres-Vigil K., Arroyo V., Caballeria J., Gines P., Bataller R. Acute kidney injury is an early predictor of mortality for patients with alcoholic hepatitis. Clin. Gastroenterol. Hepatol.: Off. Clin. Pract. J. Am. Gastroenterol. Assoc. 2012;10(65–71):e63. doi: 10.1016/j.cgh.2011.09.011. [DOI] [PubMed] [Google Scholar]
- 34.Epstein M. Alcohol’s impact on kidney function. Alcohol Health Res. World. 1997;21:84–92. [PMC free article] [PubMed] [Google Scholar]
- 35.Van Thiel D.H., Gavaler J.S., Little J.M., Lester R. Alcohol: its effect on the kidney. Metab.: Clin. Exp. 1977;26:857–866. doi: 10.1016/0026-0495(77)90004-x. [DOI] [PubMed] [Google Scholar]
- 36.Kosanam H., Thai K., Zhang Y., Advani A., Connelly K.A., Diamandis E.P., Gilbert R.E. Diabetes induces lysine acetylation of intermediary metabolism enzymes in the kidney. Diabetes. 2014;63:2432–2439. doi: 10.2337/db12-1770. [DOI] [PubMed] [Google Scholar]
- 37.Stryer L.B J.M., Tymoczko J.L. W. H. Freeman; New York: 2002. Biochemistry. [Google Scholar]
- 38.Purohit V., Gao B., Song B.J. Molecular mechanisms of alcoholic fatty liver. Alcohol. Clin. Exp. Res. 2009;33:191–205. doi: 10.1111/j.1530-0277.2008.00827.x. [DOI] [PMC free article] [PubMed] [Google Scholar]
- 39.Kriz W. Adenosine and ATP: traffic regulators in the kidney. J. Clin. Investig. 2004;114:611–613. doi: 10.1172/JCI22669. [DOI] [PMC free article] [PubMed] [Google Scholar]
- 40.Dinu D., Nechifor M.T., Movileanu L. Ethanol-induced alterations of the antioxidant defense system in rat kidney. J. Biochem. Mol. Toxicol. 2005;19:386–395. doi: 10.1002/jbt.20101. [DOI] [PubMed] [Google Scholar]
- 41.Das S.K., Varadhan S., Dhanya L., Mukherjee S., Vasudevan D.M. Effects of chronic ethanol exposure on renal function tests and oxidative stress in kidney. Indian J. Clin. Biochem. 2008;23:341–344. doi: 10.1007/s12291-008-0075-6. [DOI] [PMC free article] [PubMed] [Google Scholar]
- 42.Chen Y., Zhang J., Lin Y., Lei Q., Guan K.L., Zhao S., Xiong Y. Tumour suppressor SIRT3 deacetylates and activates manganese superoxide dismutase to scavenge ROS. EMBO Rep. 2011;12:534–541. doi: 10.1038/embor.2011.65. [DOI] [PMC free article] [PubMed] [Google Scholar]
- 43.Vidhya A., Renjugopal V., Indira M. Impact of thiamine supplementation in the reversal of ethanol induced toxicity in rats. Indian J. Physiol. Pharmacol. 2013;57:406–417. [PubMed] [Google Scholar]
- 44.Wheeler M.D., Nakagami M., Bradford B.U., Uesugi T., Mason R.P., Connor H.D., Dikalova A., Kadiiska M., Thurman R.G. Overexpression of manganese superoxide dismutase prevents alcohol-induced liver injury in the rat. J. Biol. Chem. 2001;276:36664–36672. doi: 10.1074/jbc.M105352200. [DOI] [PubMed] [Google Scholar]
- 45.Roede J.R., Stewart B.J., Petersen D.R. Decreased expression of peroxiredoxin 6 in a mouse model of ethanol consumption. Free Radic. Biol. Med. 2008;45:1551–1558. doi: 10.1016/j.freeradbiomed.2008.08.032. [DOI] [PubMed] [Google Scholar]
- 46.Liang Y., Harris F.L., Jones D.P., Brown L.A. Alcohol induces mitochondrial redox imbalance in alveolar macrophages. Free Radic. Biol. Med. 2013;65:1427–1434. doi: 10.1016/j.freeradbiomed.2013.10.010. [DOI] [PMC free article] [PubMed] [Google Scholar]
- 47.Zhou Z., Wang L., Song Z., Saari J.T., McClain C.J., Kang Y.J. Zinc supplementation prevents alcoholic liver injury in mice through attenuation of oxidative stress. Am. J. Pathol. 2005;166:1681–1690. doi: 10.1016/S0002-9440(10)62478-9. [DOI] [PMC free article] [PubMed] [Google Scholar]
- 48.Jones D.P. Redefining oxidative stress. Antioxid. Redox Signal. 2006;8:1865–1879. doi: 10.1089/ars.2006.8.1865. [DOI] [PubMed] [Google Scholar]
- 49.Jones D.P., Carlson J.L., Samiec P.S., Sternberg P., Mody V.C., Reed R.L., Brown L.A. Glutathione measurement in human plasma. Evaluation of sample collection, storage and derivatization conditions for analysis of dansyl derivatives by HPLC. Clin. Chim. Acta. 1998;275(2):175–184. doi: 10.1016/s0009-8981(98)00089-8. [DOI] [PubMed] [Google Scholar]
Associated Data
This section collects any data citations, data availability statements, or supplementary materials included in this article.
Supplementary Materials
Supplementary material