

Abstract
Background. Hepatitis C virus (HCV) genotype 1 is the most prevalent worldwide. Subtype 1a, compared with 1b, shows lower response rates and higher propensity to select for drug resistance to NS3 and selected NS5A and nonnucleoside NS5B inhibitors. Two distinct clades of subtype 1a have been described.
Methods. Using Bayesian methodology, we performed a time-scaled phylogeny reconstruction of clade separation and characterized the geographic distribution, phylodynamics, and association with natural resistance variants of NS3 sequences from 362 patients carrying subtype 1a HCV.
Results. All sequences segregated in 2 clearly distinct clades. Clade I showed an earlier origin from the common ancestor compared with clade II. Clade I virus was more prevalent in non-European countries, represented mostly by United States, compared with European (75.7% vs 49.3%; P < .001). The prevalence of the natural NS3 variant Q80K, associated with resistance to the macrocyclic protease inhibitor simeprevir, was detected in 51.6% of clade I and 0% of clade II (P < .001); clade I showed a lower genetic barrier for Q80K, whereas no sign of selective pressure at any protease inhibitor resistance-associated codon was detected.
Conclusions. Hepatitis C virus subtype 1a clades have a clearly different distribution in Europe and the United States, and the natural resistance mutation Q80K is exclusively associated with clade I.
Keywords: drug resistance, genotype 1a, HCV, protease, Q80K
With an estimated 160 million infected individuals worldwide, hepatitis C virus (HCV) is a major cause of global morbidity and mortality [1, 2]. Chronic infection is established in up to 85% of patients, and a fraction of these develop progressive liver fibrosis, eventually leading to cirrhosis, end-stage liver disease, hepatocellular carcinoma, and selected extrahepatic disorders [3, 4]. In recent years, the development and regulatory approval of several direct-acting antiviral agents (DAAs) have dramatically increased the cure rate of chronic HCV infection [5]. Hepatitis C virus is genetically heterogeneous and classified into genotypes and several subtypes [6]. Different HCV genotypes and subtypes show distinct geographical distribution and association with risk categories in the population [7]. Genotype 1 is the most frequent worldwide, with subtype 1b prevailing in most of European countries, with the exception of patients with human immunodeficiency virus (HIV) coinfection, where 1a prevails, whereas 1a is the most prevalent subtype in North America, parts of South America, the United Kingdom, Scandinavia, and Australia [7]. More importantly, HCV genotype has been a major factor impacting the response to HCV treatment since the pre-DAA era, with genotypes 2 and 3 more sensitive to the association of pegylated interferon with ribavirin compared with genotypes 1 and 4. Among DAAs, the activity of NS3 protease inhibitors (NS3i) and nonnucleoside inhibitors of the NS5B viral polymerase tend to be more restricted to specific genotypes, with some exceptions regarding agents from the newer generations [8, 9], whereas nucleoside or nucleotide NS5B inhibitors and NS5A protein inhibitors have a broader, pan-genotypic activity [10]. Several clinical studies have shown a different activity of NS3i and nonnucleoside NS5B inhibitors towards HCV subtypes 1a and 1b, with the former yielding lower response rates and a higher propensity to select drug resistance mutations at virological failure [11]. Pretreatment natural resistance to protease inhibitors is rare among patients infected with HCV genotype 1 [12]; however, a varied proportion of subtype 1a viruses carry a natural mutant in the NS3 protease region, Q80K, leading to reduced susceptibility in vitro to some macrocyclic protease inhibitors [13] and a reduced in vivo response to simeprevir when combined with pegylated interferon and ribavirin [14], but not in association with sofosbuvir [15]. Indeed, the US Food and Drug Administration, European Medicines Agency, and expert guidelines consider or recommend testing for the presence of Q80K in patients infected with HCV subtype 1a before starting treatment with simeprevir in combination with pegylated interferons and ribavirin [16–20].
Segregation of HCV subtype 1a into 2 distinct clades was originally reported in 2011 based on full-length virus genome analysis [21]. More recently, the same 2 distinct subtype 1a clades have been described by us [22] and others [23] based on NS3 sequencing. Aims of this study were to investigate the variability of subtype 1a, its phylodynamics, as well as to examine the association of the different clades with epidemiological factors and with the presence of naturally occurring NS3i resistance mutations.
PATIENTS AND METHODS
Patients and Datasets
Individual plasma samples were obtained in 2003–2013 from 134 NS3i-naive patients chronically infected with HCV subtype 1a from 6 Italian centers (Rome, Brescia, Firenze, Lecce, and 2 centers in Siena) and 66 from 4 German centers (Cologne, Düsseldorf, Essen, and Kaiserslautern). All of these patients provided written informed consent for use of their anonymized sequence and linked clinical data. Epidemiological and demographic data were available for most of these patients. The complete dataset contained these 200 Italian and German sequences plus 162 subtype 1a sequences downloaded from the Los Alamos National Laboratory (LANL) HCV sequence database (http://hcv.lanl.gov/content/index) on the basis of the following inclusion criteria: (1) sequences already published in peer-reviewed journals; (2) no uncertainty about the subtype assignment; (3) known country of origin as indicated in the original publication; (4) unique identification of the case; (5) known sampling date. Although all of the Italian sequences comprised the whole NS3 protease coding region (amino acid 1–180), the German and LANL sequences had different starting amino acids. The complete dataset (n = 362) was built to estimate the HCV subtype 1a NS3 protease gene mean evolutionary rate and to perform the time-scaled phylogeny, the selective pressure analysis, and the analysis of resistance associated mutations. The sampling locations of the sequences were as follows: Italy (n = 134); Germany (n = 66); France (n = 6); Spain (n = 3); Brazil (n = 2); United States (n = 148); and Egypt, Australia, and Japan (n = 1 each). The sampling dates were from 1977 to 2013.
Samples were analyzed phylogenetically to confirm their subtype 1a and assigned to a clade. Then, the 362 samples were divided into 4 nested sub-datasets that were built to study the phylodynamics: (1) I-ALL dataset consisted of 219 phylogenetic-clade I samples of the complete dataset; 64 of the 219 sequences were Italian, 35 were German, and 120 were LANL sequences; (2) I-IT dataset included only the 64 Italian sequences from the dataset I-ALL; (3) II-ALL dataset comprised 143 sequences phylogenetic-clade II of the complete dataset (70 sequences were Italian isolates, 31 were German, and 42 were LANL sequences); (4) II-IT dataset included only the 70 Italian isolates of the dataset II-ALL.
To avoid the influence of convergent evolution for drug-resistance mutations on the phylogenetic analysis, the same analyses were performed also on the resistance codons-stripped dataset, removing the resistance codons as defined by the International Antiviral Society-USA (IAS-USA) update published by Wyles [24] (https://www.iasusa.org/sites/default/files/uploads/hcv_chart_2013.pdf). Sequences of all datasets were aligned using CLUSTAL X and manually edited with Bioedit, as described [25] previously.
Hepatitis C virus genotype and subtype were confirmed by the BioAfrica-Oxford HCV subtyping tool (version 2.0) (http://www.bioafrica.net/rega-genotype/html/subtypinghcv.html). The ModelTest version 3.7 [26] was used to select the simplest evolutionary model that adequately fitted the sequence data, as described previously [27].
NS3 Sequencing, Resistance Mutations, and Genetic Barrier
Sanger NS3 sequencing for the plasma samples from the Italian sites was performed as previously described [22]. Samples from the German sites were processed, amplified by reverse transcription polymerase chain reaction, and sequenced (using HCV-specific primers for this study) as previously described [28]. The Italian and German sequences have been submitted to GenBank (HCV NS3 sequences used in this study and previously submitted [22] to GenBank include accession numbers JN704206, JN704210, JN704218 through JN704220, JN704224, JN704229 through JN704242, JN704244, JN704246 through JN704254, JN704256, JN704257, JN704260 through JN704264, JN704266 through JN704270, JN704273 through JN704277, JN704278 through JN704286, JN704290, JN704291, JN704293 through JN704295, JN704193, JN704194, JN704198, JN704199, JN704202 through JN704204. New HCV NS3 sequences used in this study have been submitted under accession numbers KP411614 through KP411746.) Genotyping and subtyping was based on phylogenetic analysis of the same NS3 sequence [22].
NS3i resistance-associated mutations were analyzed based on the latest IAS-USA reference list [24]. The genetic barrier was analyzed for the codons associated with resistance mutations. For each codon, we calculated an arithmetic sum score for the smallest number of transitions and/or transversions required for evolution to the target resistance mutation, counting 1 for transitions and 2.5 for transversions [29].
The clade-specific genetic barrier was computed as the weighted average score for all the codon variants found in the sequences of that clade and different from that coding for the target resistance mutation.
Evolutionary Rate Estimates and Time-Scaled Phylogeny Reconstruction
A statistical method, based on the coalescent theory, was used to estimate the epidemic history of HCV subtype 1a from the viral gene sequences obtained as well as to describe the relationship between the demographic history of a population and the genealogy of individuals sampled randomly from it [25, 30]. The evolutionary rates were estimated with the complete dataset (sampling dates 1977 to 2013) using a Bayesian-Markov-Chain-Monte-Carlo (MCMC) method implemented in the BEAST package version 1.7.4 [31, 32] under a strict and relaxed clock with an uncorrelated log normal rate distribution. As coalescent priors, 4 parametric demographic models of population growth (constant size, exponential, expansion, and logistic growth) and a Bayesian skyline plot ([BSP], a non-parametric piecewise-constant model) were compared. The MCMC chains were run for at least 150 million generations and sampled every 15 000 steps. Convergence of the MCMC was assessed by calculating the estimated sample size (ESS) for each parameter. Only ESS values >250 were accepted. Uncertainty in the estimates was indicated by 95% highest posterior density (95% HPD) intervals, and the best fitting models were selected using a Bayes factor ([BF] using marginal likelihoods) implemented in BEAST [32]. In accordance with Kass and Raftery [33], the strength of the evidence against H0 was evaluated as follows: 2 ln BF <2 = no evidence; 2–6 = weak evidence; 6–10 = strong evidence; and >10 = very strong evidence. A negative 2 ln BF indicates evidence in favor of H0. Only values ≥6 were considered significant. To reconstruct the time-scaled phylogeny of HCV subtype 1a, a constant demographic model with a relaxed molecular clock was used, assuming the TN93 + I + G model of nucleotide substitution.
Bayesian analysis was also performed on the resistance codons stripped dataset. Population dynamics was also analyzed in the 4 sub-datasets implementing a relaxed molecular clock model under the BSP using 50 million generations sampled every 5000 steps with the model of nucleotide substitution previously selected with ModelTest [25].
Selective Pressure Analysis
Selective pressure analysis was performed on the complete dataset. The dN/dS rate (ω) was estimated by the maximum-likelihood approach implemented in the program HyPhy [34]. Site-specific positive and negative selection were estimated by 2 different algorithms: the fixed-effects likelihood (FEL), which fits an ω rate to every site and uses the likelihood ratio to test if dN ≠ dS; and the random effect likelihood (REL), a variant of the Nielsen-Yang approach [35], which assumes that a discrete distribution of rates exists across sites and allows both dS and dN to vary independently site by site. The 2 methods have been described in more detail elsewhere [34]. To select sites under selective pressure and keep our test conservative, a P value of ≤ .1 or a posterior probability of ≥0.9 as relaxed critical value [36] was assumed. Part of the analysis was conducted by using the web-based interface Datamonkey (http://www.datamonkey.org/). For evolutionary analysis, the reference sequence with accession number AF009606 was used to trace the position of the amino acids found under positive selection.
RESULTS
Evolutionary Rate Estimates, Time-Scaled Phylogeny Reconstruction, and Phylodynamics
Bayes factor analysis showed that the relaxed clock fitted the data significantly better than the strict clock (2lnBF between the strict and relaxed clock was 160 in favor of the latter). Under the relaxed clock, the BF analysis showed that the constant model was better than the other models (2lnBF > 700). Under the relaxed log-normal clock and constant model, the analysis of the HCV subtype 1a NS3 gene (complete dataset) led to a mean evolutionary rate estimate of 3.24 × 10⁻³ (95% HPD, 2.28–4.27 × 10⁻³).
Bayesian phylogenetic tree of the complete dataset (Figure 1A) showed a clear separation between 2 clades, which were labeled as clade I and II in agreement with original designation [21].
Figure 1.

Bayesian phylogenetic tree. A, Bayesian maximum clade credibility tree of all hepatitis C virus 1a subtype sequences with branch lengths scaled in time by enforcing a relaxed molecular clock. Branches labeled with asterisks are well supported, having a posterior probability >0.90. Tip dates for each node represent the year of isolate collection. B, Geographic origin of the sequences on the phylogenetic tree based on a subset of 192 sequences from Europe and the Americas with known geographic origin and sequencing date. Abbreviations: BR, Brazil; EU, Europe; US, United States.
Analysis of the dated tree showed that the tree root dated back to the year 1964 (95% HPD, 1941–1976). Clade I and II dated back to the year 1966 (95% HPD, 1952–1972) and 1975 (95% HPD, 1961–1989), respectively. Bayesian analysis on the resistance codons stripped dataset revealed the same significant separation in clade I and II without any interspersed sequences (data not shown). The phylogeographic analysis of the clades showed a European origin for clade II and a mixed origin in both Europe and the United States for clade I (Figure 1B).
The demographic history of HCV subtype 1a NS3 protease gene performed on sub-dataset I-ALL showed that the clade I epidemic increased exponentially from the year 1995 to the year 2004 and has remained fairly constant up to today (Figure 2A). The corresponding demographic history of HCV-1a NS3 gene performed on dataset I-IT showed that the Italian clade I epidemic increased after the year 2000 until approximately the year 2006 and remained fairly constant to this day (Figure 2B). The phylodynamics of HCV-1a NS3 protease gene analyzed on the dataset II-ALL showed that the clade II epidemic increased from approximately 2001 to 2006 and has remained fairly constant up to today (Figure 2C). Overall, the demographic increase of clade II showed a somewhat less steep and less pronounced increase compared with clade I. The demographic history of Italian clade II performed on dataset II-IT showed a very similar phylodynamic profile as in dataset II-ALL (Figure 2D).
Figure 2.

Effective population size (Ne) estimates from Bayesian phylogenetic analysis. A, complete subset of clade I sequences; (B) Italian subset of clade I sequences; (C) complete subset of clade II sequences; (D) Italian subset of clade II sequences. The solid black lines and the shaded blue upper and lower bounds represent, respectively, median and 95% high posterior density interval estimates of Ne over time. Ne values were estimated in BEAST package version 1.8.0 using a nonparametric Skyline evolutionary model assuming a relaxed clock.
Factors Associated With the Two Distinct Subtype 1a Clades
Table 1 summarizes the analysis of the association of some demographic, epidemiological, and virological factors with segregation of European HCV 1a into clade I or II. We found no significant association with known risk factor and time from HCV diagnosis, calendar year of sampling, or HCV viral load, whereas clade II tended to be associated with the presence of HIV coinfection.
Table 1.
Comparison of Main Characteristics Among European HCV Subtype 1a Patient Sequences
| Patients Characteristics (n Available)a | Total n = 209 | Clade I n = 103 | Clade II n = 106 | P Value |
|---|---|---|---|---|
| Age, median years (IQR) (n = 168) | 47 (43–50) | 47 (44–50) | 46 (41–52) | .11 |
| Gender, % males (n = 168) | 74.7 | 71.4 | 77.5 | .55 |
| Mode of HCV acquisition (%) (n = 132) | 0.59 | |||
| IV drug use | 48.3 | 43.7 | 52.8 | |
| Blood/blood products | 2.4 | 3.9 | 0.9 | |
| Sexual contacts | 12.4 | 14.6 | 10.4 | |
| Unknown | 36.8 | 37.9 | 35.8 | |
| HIV coinfection (%) (n = 196) | 55.6 | 49.5 | 61.6 | .08 |
| HCV RNA load, median log IU/mL (IQR) (n = 196) | 6.06 (5.26–6.64) | 5.97 (5.21–6.61) | 6.13 (5.42–6.65) | .19 |
| Calendar year of sequencing, median (IQR) | 2011 (2010–2012) | 2011 (2010–2012) | 2011 (2010–2011) | .11 |
| Time from HCV diagnosis, median years (IQR) (n = 125) | 15.4 (7.9–19.1) | 16.0 (10.4–18.8) | 15.1 (6.4–20.0) | .79 |
Abbreviations: HCV, hepatitis C virus; HIV, human immunodeficiency virus; IQR, interquartile range; IV, intravenous.
a For the characteristics not available in all cases, the number of cases with available data are specified in parentheses with each characteristic.
When looking at sequences in geographic origin, a significant difference in clade prevalence was observed between European and non-European sequences, which were mostly represented by sequences from the United States. Indeed, less than half of HCV 1a sequences from Europe belonged to clade I, whereas this clade represented approximately 3 of 4 American sequences (P < .0001; see Figure 3). In particular, the numbers with clade I or II were 64 (47.8%) and 70 (52.2%) for Italian sequences, 35 (53.0%) and 31 (47.0%) for German sequences, 4 (66.7%) and 2 (33.3%) for those from France, 0 (0%) and 3 (100%) for Spanish sequences, and 112 (75.7%) and 36 (24.3%) for US sequences, respectively; both Brazilian, the Japanese and the Egyptian sequences were clade I, whereas the Australian sequence was clade II.
Figure 3.
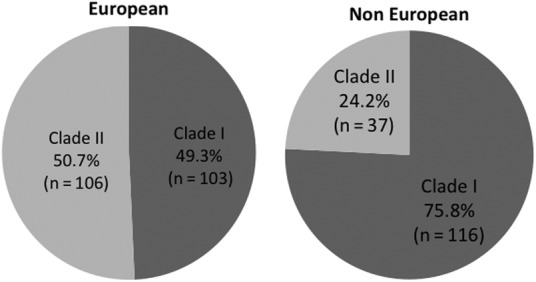
Distribution of the relative frequency of clade I and II in European and non-European hepatitis C virus subtype 1a sequences.
Natural NS3i Resistance-Associated Mutations and Genetic Barrier to Resistance in the Two Subtype 1a Clades
The prevalence of natural resistance-associated mutations in clade I and II is shown in Figure 4A. The Q80K mutation was detected in 111 of 215 (51.6%) of the clade I strains genotyped (4 sequences did not include codon 80) but was completely absent in the 141 clade II sequences genotyped at this position (2 sequences did not include this codon; P < .0001). The prevalence of Q80K in clade I isolates was 56 of 99 (56.6%) among those from European centers [35 of 64 (54.7%) in sequences from Italy; 21 of 35 (60.0%) from Germany; the 4 clade I sequences from France lacked the codon 80]; 54 of 112 (48.2%) among those from centers in the United States; and 1 of 4 (25%) among those from other countries. Due to this different prevalence of Q80K in the 2 genotype 1a clades and their different geographical distribution, the overall prevalence of Q80K among the 1a isolates was higher in the United States compared with Europe (54 of 148 [36.5%] vs 56 of 203 [27.6%], respectively, χ2; P = .076). Other NS3i resistance mutations were all very rare and not differently distributed in the 2 clades, with the exception of a slightly higher prevalence of D168E in clade II (1.4% vs 0% in clade I; P = .08).
Figure 4.

Distribution of (A) frequency of natural resistance mutations and (B) genetic barrier to resistance mutations in the NS3 protease gene region of clade I and II subtype 1a hepatitis C virus.
The calculated genetic barrier to evolve from a nonresistance to the corresponding resistance codon differed for Q80K and R155M (lower for clade I) and for Q80L, S122A, and V158I (lower for clade II) (see Figure 4B). However, all of these codons, with the exception of Q80K for clade I, showed a high genetic barrier for evolution to resistant mutants in both clades.
Selective Pressure Analysis
Selective pressure analysis revealed more than 93% of codons with ω (dN/dS) <1, showing a strong negative selective pressure. Only 1 site was found under positive selective pressure as confirmed by both REL and FEL analysis, namely NS3 codon 94 with residues (N, G, S, C).
DISCUSSION
In this analysis of a well defined set of HCV subtype 1a NS3 sequences from Europe and the Americas, we confirm that virtually all sequences can be grouped in 2 clearly distinct clades, and we demonstrate that NS3 sequencing is sufficient to categorize strains into these clades. The distribution of the clades in the United States and Europe is significantly different, with clade I being more prevalent in the United States and both clades equally distributed in Europe. The separation of the clades from a common ancestor seems a relatively recent event, having occurred around the year 1964. Clade II originated in approximately 1961–1989, 1 decade later than clade I (1952–1975) and with more evidences tracing its origin in Europe compared with the United States. Moreover, the dynamics of the spread of clade II seems slightly slower than that of clade I. This is the first study to investigate the phylodynamics and geographic distribution of subtype 1a clades. These data complement previous phylogenetic analyses, tracing a sharp increase in transmission of subtypes 1a and 1b between 1940 and 1980, with the spread of 1b preceding that of 1a by more than 15 years [37].
It is interesting to note that the Q80K mutation, a natural variant conferring a certain degree of resistance to some macrocyclic protease inhibitors including the recently approved simeprevir [13, 14, 38, 39], was detected in 51.6% of clade I strains but was completely absent in clade II in this series. The classification of sequences into the 2 different clades after deleting this codon showed that the presence of this substitution was not responsible for the observed clade segregation.
The exclusive association of Q80K with clade I and the higher frequency of clade I among the 1a sub-genotypes from the United States compared with those from Europe justifies the higher prevalence of Q80K in genotype 1a in the United States compared with Europe. This suggests that more patients in the United States compared with Europe will have to be excluded from certain simeprevir-based regimens, based on natural resistance. Nonetheless, it must be noted that the presence of the Q80K mutation per se may be not sufficient for failing a simeprevir-based regimen, probably as a result of the activity of the accompanying drugs or some other favorable factors [40, 41]. In particular, Q80K does not seem to influence the activity of simeprevir when combined with sofosbuvir [15]. Moreover, response to faldaprevir, another macrocyclic protease inhibitor whose development has been recently discontinued, was also reduced with subtype 1a, but this was not associated with the presence of Q80K [39]. Currently, both the American and the European Association for the Study of the Liver recommend testing for the presence of the Q80K mutation before treatment with simeprevir in association with pegylated interferon and ribavirin in patients infected with HCV subtype 1a [18, 19]. Our results are in partial agreement with a recent phylogenetic study indicating the origin of the Q80K polymorphism in the United States during the 1940s [42]. Although our estimates date the emergence of clade I approximately 1 decade later, our findings that Q80K is uniquely associated with clade I and that clade I and II segregate independently from the presence of Q80K indicate that the clade segregation antedates the emergence of Q80K, suggesting that this polymorphism emerged in clade I, possibly, based on McCloskey et al [42], in the United States. The prevalence of Q80K among clade I strains was similar in sequences from Europe and the United States, which underscores the fact that its different distribution between the 2 regions is influenced by the distribution of clade I and may either suggest different independent origins of Q80K in the 2 regions or a rapid and efficient transfer of this polymorphism from the United States to Europe. Because Q80K indicates the presence of clade I virus, but only half of the clade I strains carry this mutation, it remains to be established whether the reduced response observed with Q80K to simeprevir is indeed specifically associated with Q80K or can be more accurately detected by determining the viral clade. Contrary to this hypothesis, our data indicate that no other known resistance-associated natural variant is more frequent in clade I versus II. Likewise, our genetic barrier analysis does not support a generally easier resistance-associated mutation development in the NS3 region for clade I compared with clade II. Indeed, although the genetic barrier was significantly lower for the Q80K mutation in clade I, other differences for the genetic barrier at selected resistance codons between the 2 clades were less prominent and occurred in a context of relatively high generic barrier. Moreover, the selective pressure analysis showed that, in the absence of drugs, no resistance-associated codon was under positive selective pressure, suggesting that NS3 natural resistance variants are not the result of selective pressure by the host immune system but are rather resulting from random evolution of the virus.
Global tracing of subtype 1a is of importance given the diversity of virological response to different DAA. Indeed, subtype 1a, compared with 1b, is associated with lower response rates to different generations of NS3i, also in combination with DAA of different classes [11]. Moreover, subtype 1a virus shows a higher propensity in selecting resistance after NS3i treatment failure compared with 1b [11, 43], mostly due to different genetic barriers to evolution to the most common drug-resistant variants [44]. In addition, a reduced response to subtype 1a compared with 1b has been observed also for other classes, such as nonnucleoside polymerase inhibitors [45, 46] or even some NS5A inhibitors [47]. The in vivo response to some combinations of different classes of DAA is also weaker in subtype 1a compared with 1b, particularly in more difficult-to-treat categories such as cirrhotics [48]. It will be interesting to establish whether the 2 subtype 1a clades are associated with different prevalence of natural variants in the NS5A and NS5B region and whether they act as determinants of in vivo treatment response to other drug classes.
CONCLUSIONS
In conclusion, we demonstrate that HCV subtype 1a NS3 sequences clearly segregate into 2 separate clades worldwide, with different temporal origin and spread and distinct geographic distribution. The natural resistance mutant Q80K, which is associated with reduced response to the NS3i simeprevir, is exclusively associated with clade I. Whether these different clades influence the response to other DAA-inhibiting HCV at different steps of its life cycle deserves further investigations.
Acknowledgments
Financial support. This study was supported by Bundesminster für Bildung und Forschung (grant Deutsches Zentrum für Infektionsforschung-TTU05.805-PEPSI) and from Bundesminister für Gesundheit (HIV/HEP-MASTER) (to R. K. and S. S.).
Potential conflicts of interest. S. D. reports grants, personal fees, and nonfinancial support from Janssen; personal fees from Bristol-Myers Squibb, Merck Sharp and Dohme, Gilead Sciences, ViiV, and Abbvie, outside the submitted work. A. D. reports grants and personal fees from ViiV Healthcare, personal fees from Gilead Sciences, Abbvie, Merck Sharp and Dohme, Janssen, and Teva Pharmaceuticals, outside the submitted work. C. T. reports grants from Gilead, Bristol-Myers Squibb, ViiV Healthcare, outside the submitted work. P. G. reports personal fees from Gilead, Janssen, and ViiV, outside the submitted work. P. B. reports personal fees from Roche, Boehringer, Bristol-Myers Squibb, Gilead, outside the submitted work. M. F. reports personal fees from Merck Sharp and Dohme, Janssen-Cilag, Bristol-Myers Squibb, outside the submitted work. M. Z. reports grants and personal fees from ViiV Healthcare, personal fees from Janssen, Merck Sharp and Dohme, Gilead Sciences, Abbott Molecular, outside the submitted work.
All authors have submitted the ICMJE Form for Disclosure of Potential Conflicts of Interest. Conflicts that the editors consider relevant to the content of the manuscript have been disclosed.
References
- 1.Lavanchy D. Evolving epidemiology of hepatitis C virus. Clin Microbiol Infect 2011; 17:107–15. [DOI] [PubMed] [Google Scholar]
- 2.Shepard CW, Finelli L, Alter MJ. Global epidemiology of hepatitis C virus infection. Lancet Infect Dis 2005; 5:558–67. [DOI] [PubMed] [Google Scholar]
- 3.Chen SL, Morgan TR. The natural history of hepatitis C virus (HCV) infection. Int J Med Sci 2006; 3:47–52. [DOI] [PMC free article] [PubMed] [Google Scholar]
- 4.Zignego AL, Gragnani L, Di Pietro E, et al. HCV infection, malignancy, and liver transplantation. Transplant Proc 2003; 35:1032–3. [DOI] [PubMed] [Google Scholar]
- 5.Pawlotsky JM. New hepatitis C therapies: the toolbox, strategies, and challenges. Gastroenterology 2014; 146:1176–92. [DOI] [PubMed] [Google Scholar]
- 6.Smith DB, Bukh J, Kuiken C, et al. Expanded classification of hepatitis C virus into 7 genotypes and 67 subtypes: updated criteria and genotype assignment web resource. Hepatology 2014; 59:318–27. [DOI] [PMC free article] [PubMed] [Google Scholar]
- 7.Messina JP, Humphreys I, Flaxman A, et al. Global distribution and prevalence of hepatitis C virus genotypes. Hepatology 2015; 61:77–87. [DOI] [PMC free article] [PubMed] [Google Scholar]
- 8.Li YP, Ramirez S, Humes D, et al. Differential sensitivity of 5′UTR-NS5A recombinants of hepatitis C virus genotypes 1–6 to protease and NS5A inhibitors. Gastroenterology 2014; 146:812–21.e4. [DOI] [PubMed] [Google Scholar]
- 9.Ng T, Reisch T, Middleton T, et al. ABT-493, a potent HCV NS3/4A protease inhibitor with broad genotype coverage. In: 21st Conference on Retroviruses and Opportunistic Infections Boston, MA, March 3–6, 2014 (Abstract 636). [Google Scholar]
- 10.deLemos AS, Chung RT. Hepatitis C treatment: an incipient therapeutic revolution. Trends Mol Med 2014; 20:315–21. [DOI] [PubMed] [Google Scholar]
- 11.Wyles DL, Gutierrez JA. Importance of HCV genotype 1 subtypes for drug resistance and response to therapy. J Viral Hepat 2014; 21:229–40. [DOI] [PubMed] [Google Scholar]
- 12.Alves R, Queiroz AT, Pessoa MG, et al. The presence of resistance mutations to protease and polymerase inhibitors in hepatitis C virus sequences from the Los Alamos databank. J Viral Hepat 2013; 20:414–21. [DOI] [PubMed] [Google Scholar]
- 13.Bae A, Sun SC, Qi X, et al. Susceptibility of treatment-naive hepatitis C virus (HCV) clinical isolates to HCV protease inhibitors. Antimicrob Agents Chemother 2010; 54:5288–97. [DOI] [PMC free article] [PubMed] [Google Scholar]
- 14.Asselah T, Marcellin P. Second-wave IFN-based triple therapy for HCV genotype 1 infection: simeprevir, faldaprevir and sofosbuvir. Liver Int 2014; 34(Suppl 1):60–8. [DOI] [PubMed] [Google Scholar]
- 15.Lawitz E, Sulkowski MS, Ghalib R, et al. Simeprevir plus sofosbuvir, with or without ribavirin, to treat chronic infection with hepatitis C virus genotype 1 in non-responders to pegylated interferon and ribavirin and treatment-naive patients: the COSMOS randomised study. Lancet 2014; 384:1756–65. [DOI] [PubMed] [Google Scholar]
- 16.Olysio. EMA/CHMP/137969/2014 Committee for Medicinal Products for Human Use (CHMP), 2014. Available at: http://www.ema.europa.eu/docs/en_GB/document_library/Summary_of_opinion_Initial_authorisation/human/002777/WC500163524.pdf. Accessed 21 April, 2015.
- 17.Olysio. U.S. Food and Drug Administration. Reference ID: 3417522, 2013. Available at: http://www.accessdata.fda.gov/drugsatfda_docs/label/2013/205123s001lbl.pdf. Accessed 21 April, 2015.
- 18.AASLD/IDSA/IAS-USA. Recommendations for testing, managing, and treating hepatitis C. Available at: http://www.hcvguidelines.org. Accessed 30 November 2014.
- 19.European Association for Study of Liver. EASL Clinical Practice Guidelines: management of hepatitis C virus infection. J Hepatol 2014; 60:392–420. [DOI] [PubMed] [Google Scholar]
- 20.Schneider MD, Sarrazin C. Antiviral therapy of hepatitis C in 2014: do we need resistance testing? Antiviral Res 2014; 105:64–71. [DOI] [PubMed] [Google Scholar]
- 21.Pickett BE, Striker R, Lefkowitz EJ. Evidence for separation of HCV subtype 1a into two distinct clades. J Viral Hepat 2011; 18:608–18. [DOI] [PMC free article] [PubMed] [Google Scholar]
- 22.Vicenti I, Rosi A, Saladini F, et al. Naturally occurring hepatitis C virus (HCV) NS3/4A protease inhibitor resistance-related mutations in HCV genotype 1-infected subjects in Italy. J Antimicrob Chemother 2012; 67:984–7. [DOI] [PubMed] [Google Scholar]
- 23.Peres-da-Silva A, Almeida AJ, Lampe E. Genetic diversity of NS3 protease from Brazilian HCV isolates and possible implications for therapy with direct-acting antiviral drugs. Mem Inst Oswaldo Cruz 2012; 107:254–61. [DOI] [PubMed] [Google Scholar]
- 24.Wyles DL. Beyond telaprevir and boceprevir: resistance and new agents for hepatitis C virus infection. Top Antivir Med 2012; 20:139–45. [PMC free article] [PubMed] [Google Scholar]
- 25.Ciccozzi M, Vujošević D, Lo Presti A, et al. Genetic diversity of HIV type 1 in Montenegro. AIDS Res Hum Retroviruses 2011; 27:921–4. [DOI] [PubMed] [Google Scholar]
- 26.Posada D, Buckley TR. Model selection and model averaging in phylogenetics: advantages of Akaike information criterion and bayesian approaches over likelihood ratio tests. Syst Biol 2004; 53:793–808. [DOI] [PubMed] [Google Scholar]
- 27.Lo Presti A, Ciccozzi M, Cella E, et al. Origin, evolution, and phylogeography of recent epidemic CHIKV strains. Infect Genet Evol 2012; 12:392–8. [DOI] [PubMed] [Google Scholar]
- 28.Sierra S, Kaiser R, Lübke N, et al. Prediction of HIV-1 coreceptor usage (tropism) by sequence analysis using a genotypic approach. J Vis Exp 2011; 58:3264. [DOI] [PMC free article] [PubMed] [Google Scholar]
- 29.Van de Vijver DA, Wensing AM, Angarano G, et al. The calculated genetic barrier for antiretroviral drug resistance substitutions is largely similar for different HIV-1 subtypes. J Acquir Immune Defic Syndr 2006; 41:352–60. [DOI] [PubMed] [Google Scholar]
- 30.Holmes EC, Nee S, Rambaut A, et al. Revealing the history of infectious disease epidemics through phylogenetic trees. Philos Trans R Soc Lond B Biol Sci 1995; 349:33–40. [DOI] [PubMed] [Google Scholar]
- 31.Drummond AJ, Rambaut A, Shapiro B, et al. Bayesian coalescent inference of past population dynamics from molecular sequences. Mol Biol Evol 2005; 22:1185–92. [DOI] [PubMed] [Google Scholar]
- 32.Drummond AJ, Rambaut A. BEAST: Bayesian evolutionary analysis by sampling trees. BMC Evol Biol 2007; 7:214. [DOI] [PMC free article] [PubMed] [Google Scholar]
- 33.Kass RE, Raftery AE. Bayes factors. J Am Stat Assoc 1995; 90:773–95. [Google Scholar]
- 34.Pond SK, Muse SV. Site-to-site variation of synonymous substitution rates. Mol Biol Evol 2005; 22:2375–85. [DOI] [PubMed] [Google Scholar]
- 35.Nielsen R, Yang Z. Likelihood models for detecting positively selected amino acid sites and applications to the HIV-1 envelope gene. Genetics 1998; 148:929–36. [DOI] [PMC free article] [PubMed] [Google Scholar]
- 36.Pond SL, Frost SD. A simple hierarchical approach to modelling distributions of substitution rates. Mol Biol Evol 2005; 22:223–34. [DOI] [PubMed] [Google Scholar]
- 37.Magiorkinis G, Magiorkinis E, Paraskevis D, et al. The global spread of hepatitis C virus 1a and 1b: a phylodynamic and phylogeographic analysis. PLoS Med 2009; 6:e1000198. [DOI] [PMC free article] [PubMed] [Google Scholar]
- 38.Lenz O, Verbinnen T, Lin TI, et al. In vitro resistance profile of the hepatitis C virus NS3/4A protease inhibitor TMC435. Antimicrob Agents Chemother 2010; 54:1878–87. [DOI] [PMC free article] [PubMed] [Google Scholar]
- 39.Fried MW, Buti M, Dore GJ, et al. Once-daily simeprevir (TMC435) with pegylated interferon and ribavirin in treatment-naïve genotype 1 hepatitis C: the randomized PILLAR study. Hepatology 2013; 58:1918–29. [DOI] [PMC free article] [PubMed] [Google Scholar]
- 40.Manns M, Marcellin P, Poordad F, et al. Simeprevir with pegylated interferon alfa 2a or 2b plus ribavirin in treatment-naive patients with chronic hepatitis C virus genotype 1 infection (QUEST-2): a randomised, double-blind, placebo-controlled phase 3 trial. Lancet 2014; 384:414–26. [DOI] [PubMed] [Google Scholar]
- 41.Zeuzem S, Berg T, Gane E, et al. Simeprevir increases rate of sustained virologic response among treatment-experienced patients with HCV genotype-1 infection: a phase IIb trial. Gastroenterology 2014; 146:430–41.e6. [DOI] [PubMed] [Google Scholar]
- 42.McCloskey RM, Liang RH, Joy JB, et al. Global origin and transmission of hepatitis C virus nonstructural protein 3 Q80K polymorphism. J Infect Dis 2014; 211:1288–95. [DOI] [PubMed] [Google Scholar]
- 43.De Luca A, Bianco C, Rossetti B. Treatment of HCV infection with the novel NS3/4A protease inhibitors. Curr Opin Pharmacol 2014; 18C:9–17. [DOI] [PubMed] [Google Scholar]
- 44.Cento V, Mirabelli C, Salpini R, et al. HCV genotypes are differently prone to the development of resistance to linear and macrocyclic protease inhibitors. PLoS One 2012; 7:e39652. [DOI] [PMC free article] [PubMed] [Google Scholar]
- 45.Larrey D, Lohse AW, de Ledinghen V, et al. Rapid and strong antiviral activity of the non-nucleosidic NS5B polymerase inhibitor BI 207127 in combination with peginterferon alfa 2a and ribavirin. J Hepatol 2012; 57:39–46. [DOI] [PubMed] [Google Scholar]
- 46.Zeuzem S, Asselah T, Angus P. Efficacy of the protease inhibitor BI 201335, polymerase inhibitor BI 207127, and ribavirin in patients with chronic HCV infection. Gastroenterology 2011; 141:2047–55. [DOI] [PubMed] [Google Scholar]
- 47.Lambert SM, Langley DR, Garnett JA, et al. The crystal structure of NS5A domain 1 from genotype 1a reveals new clues to the mechanism of action for dimeric HCV inhibitors. Protein Sci 2014; 23:723–34. [DOI] [PMC free article] [PubMed] [Google Scholar]
- 48.Everson GT, Dusheiko G, Coakley E, et al. Integrated efficacy analysis of four phase 3 studies in HCV genotype 1a-infected patients treated with ABT 450/r/ombitasvir and dasabuvir with or without ribavirin. 65th Annual Meeting of the American Association for the Study of Liver Diseases, United States of America, Boston, 7–11 November 2014, (Abstract 83).