Abstract
In this study, we report a series of novel flavone-based sensors that exhibit superior fluorescence response when interacting with serum albumin in real serum samples and in acrylamide gel. The detection limit of probe 4 for serum albumin solution is 0.09 μg/mL, and the detectable volume for monkey serum reaches as low as 0.03 μL.
The Detection and discrimination of different proteins with high sensitivity and selectivity are very important for biological studies and clinical diagnosis.1–5 For decades, sodium dodecyl sulfate-polyacrylamide gel electrophoresis (SDS-PAGE) followed by western blotting has formed the core technology for protein analysis.6–9 Western blotting method has been widely used to separate, detect, and identify specific proteins in a complex mixture. In order to achieve the selective detection of a specific protein, the process is time consuming and often involves the use of expensive reagents and complicated multistep processes, which include the protein transfer, blocking, reacting with the primary and secondary antibodies followed by fluorescent detection of the bound antibodies.8 An essential step in Western blotting is to stain the proteins following the separation by SDS-PAGE, where the post-stain washing is often necessary to remove the excess dyes. Therefore, it is highly desirable to develop new strategies that can facilitate protein visualization on a gel without going through a multiple steps process.
Among the known protein sensors,10–20 only few are capable of detecting proteins in gels.21–24 In addition, these dyes either exhibit low selectivity4a in responding to different proteins, or suffer from strong interference from SDS.4b,4c The requirement and demand for improved staining can be clearly seen from SYPRO Ruby, which is widely used for staining the proteins in SDS-PAGE. 25 The standard process using SYPRO Ruby requires washing out the SDS (prior to staining), long time staining (overnight), and removing the excess dye (30 min).26, 27 It is thus highly desirable to develop a simplified procedure that allows direct staining without the need of the protein fixing (prior to staining) and washing out the non-bound staining reagent. It should be noted that the current staining methods are displaying all proteins without discrimination.
Serum albumin is the most abundant protein in blood plasma and plays a key role in the disposition and transport of various endogenous ligands, fatty acids, and drugs.28–31 Some biological functions of serum albumin are associated with its natural hydrophobic pocket, which can be used to bind flavone dyes.32–34 Our recent study shows that a large fluorescence turn-on can be induced when a weakly fluorescent flavone derivative in water is moved to the hydrophobic pocket of mitochondrial cells, thereby allowing the wash-free mitochondrial imaging.35 Reasoning that a similar effect could be generated when a properly tailored flavone dye enters a hydrophobic pocket of other biomacromolecules, we decide to examine the flavone dyes 1–6. Remarkably, the sensors exhibited a dramatic fluorescence turn-on upon selectively binding to serum albumin. Since the non-bound flavone dye is non-fluorescent in a hydrophilic environment, the dramatic fluorescence turn-on enabled direct coloration of serum albumin on the polyacrylamide gel without the need of “washing off” the free dye. The finding thus provides an attractive approach to achieve selective protein staining for the technologically important SDS-PAGE.
Flavone dyes 1–6 with different substituent (Fig. 1) were prepared, in order to examine the impact of the fine structures on their response properties. The full synthesis details of the compounds 1–6 are shown in the experimental section and Fig. S1–S17 in the electronic supplementary information (ESI†). The absorbance and fluorescence spectra of compounds 1–6 in dimethyl sulfoxide (DMSO) were investigated and the results were summarized in Table S1 and Fig. S18–S19 (ESI†).
Fig. 1.
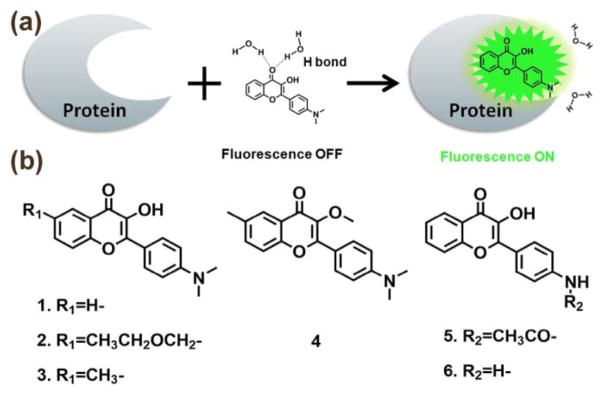
(a) Illustration of the fluorescence turn-on for selective protein detection; (b) Chemical structure of flavone dyes 1–6
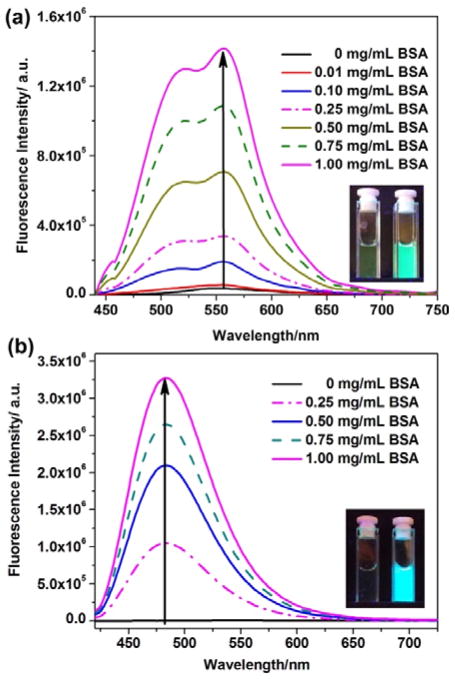
The fluorescence of the compound 1 revealed positive solvatochromism (i.e. emission red-shifted with increasing solvent polarity) (Fig. S20, ESI†). As shown in Fig. 2, the flavone 1 gave two fluorescence bands corresponding to the excited normal form (N*) and the tautomeric form (T*) associated with excited state intramolecular proton transfer (ESIPT, Fig. S21, ESI†). Upon excitation via photon irradiation, the dipole moment increased dramatically because of the charge transfer from D-A structure in 1. An increase in the solvent polarity could relax the excited molecules more efficiently, thus decreasing the energy of the excited state of fluorophore and resulting in a red-shifted emission.36 Fig. 2c showed that both N* and T* emission wavelengths of 1 correlated well with the relative solvent polarity. Interestingly, the fluorescence of 1 was nearly 100% quenched by water due to intermolecular electron or proton transfer.37 Non-fluorescence in water raises the possibility of eliminating the washing process in the protein detection procedure,38 since the free dye molecules gives negligible background signal in water.
Fig. 2.
Fluorescence spectra changes of flavone derivatives 1(a) and 4(b) (10 μM, 10 mM of PBS buffered, containing 0.5% DMSO as a cosolvent) upon addition of different concentration of BSA (0~1.0 mg/ml). Fluorescence spectra of flavone derivatives were excited at 400 nm. Inset: the photographs of dye solutions in the absence (left) and the presence of BSA (right) were all excited by handheld UV lamp (365 nm).
The fluorescence of flavone 1 was found to exhibit remarkable fluorescence enhancement upon addition of bovine serum albumin (BSA) (Fig. 2), showing a great potential for sensor applications. In the aqueous buffer (0.5% DMSO, 10 mM of PBS, pH =7.4), the BSA binding-induced fluorescence turn-on was so large that it could be easily seen by naked eye. Improved response was observed from flavone derivatives 2, 3, and 4, as they gave almost no fluorescence in the absence of BSA (Fig. 2, Fig. 3 & Fig. S22 in ESI†). Higher fluorescence response from 2–4 indicated that the alkyl substituent at the 6-position of flavone derivatives could have a large impact on the flavone-water and flavone-protein interactions. Higher fluorescence response from 2–4, in comparison with 6, also indicated that the amino group should be covered with the alkyl groups. The intramolecular charge transfer along the D-A conjugated backbone plays very important role in the environment-sensitivity of flavone. All the evidences consistently pointed to that the flavone dye was entering the hydrophobic site of BSA. In addition, the fluorescence intensities of flavone dyes revealed good linear correlation with BSA concentration ranging from 0 to 1.0 mg/mL (Fig. S23, ESI†).
Fig. 3.
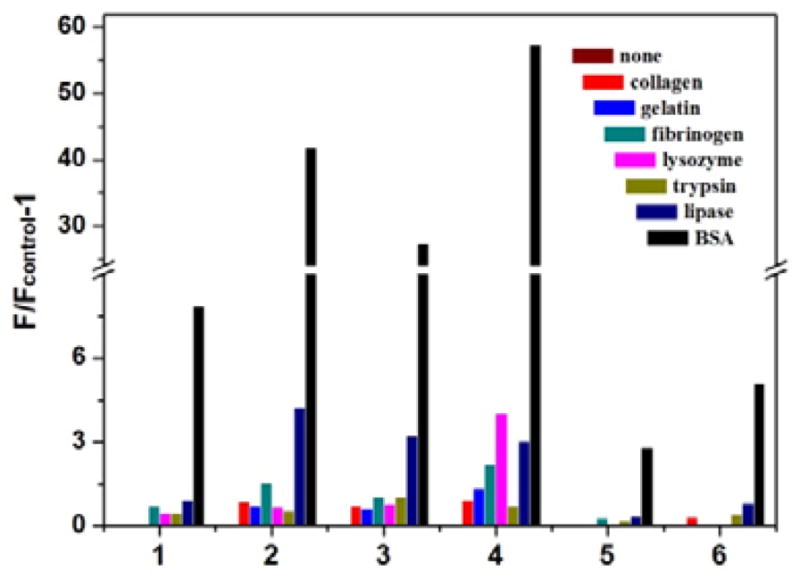
Fluorescence enhancements (F/Fcontrol-1) of compounds 1–6 (10 μM, 10 mM PBS buffer containing 0.5% DMSO, pH=7.4) in the absence and the presence of 0.1 mg/ml of various proteins. Analytes from left to right in each group: none, collagen, gelatin, fibrinogen, lysozyme, trypsin, lipase, and BSA. F: Fluorescence intensity of dye in the presence of analytes; Fcontrol: fluorescent intensity of free dye in water
Generally, the detection limit can be defined as the analyte concentration at which a 10% increase in fluorescence emission can be measured.39 In this case, the fluorescence enhancement of compounds 1–6 in the presence of 1.0 mg/ml of BSA was 7 ~ 1100 fold (Table S2, ESI†). Therefore, the detection limits of compounds 1–6 were 2.6, 0.14, 0.59, 0.09, 14, and 3.4 μg/ml, respectively. For Off/On type fluorescent sensor, the Signal-to-Noise (S/N) ratio above 3:1 is considered reliable for visual evaluation. The visual recognizable detection limits of compounds 1–6 were calculated as 78, 4.2, 17.7, 2.7, 420, and 102 μg/mL, respectively. The reference range for serum albumin concentration in human blood plasma is approximately 35–50 mg/ml,40 even in fish, the concentration of serum albumins can reach 0.5–5 mg/mL.41 The detection limits of our compounds were much lower than serum albumin concentration, indicating its capability for actual blood sample testing.
The photostability of flavone dyes 1–6 in the presence of BSA was also examined to evaluate its application for long-term imaging. The dye-BSA complexes (10 μM of compounds 1–6, 1.0 mg/ml of BSA in 10 mM PBS buffer containing 0.5% DMSO, pH=7.4) were placed in cuvette cells, then were continuously irradiated under a hand-held UV lamp (λ=365 nm, 500μW/cm2). As shown in Fig. S24 (ESI†), although the obvious fluorescence quenching of compound 5 and 6 was observed, the fluorescence intensities of compounds 1–4 could retain above 80% of their original intensities after one hour continuous UV excitation.
In real blood sample or proteins extraction from tissues,42 there are many different proteins which will cause serious interference with the detection result. Thus, the high selectivity towards the target protein over the other competitive proteins is of great importance for fluorescence probes. 43 The fluorescence response of compounds 1–6 to various proteins in PBS buffer was investigated and the results were shown in Fig. 3. Under the same conditions, the fluorescence enhancement in the presence of BSA was much larger than that in the presence of other proteins: collagen, gelatin, fibrinogen, lysozyme, trypsin and lipase (Fig. 3). For all these flavone dyes, the fluorescence response to other proteins was lower than 20% of that to BSA. The high selectivity could be attributed to the specific binding of flavone dyes to the hydrophobic pockets in the BSA structure. (0~0.025 mL). Fluorescence spectra of flavone derivatives were excited at 400 nm.
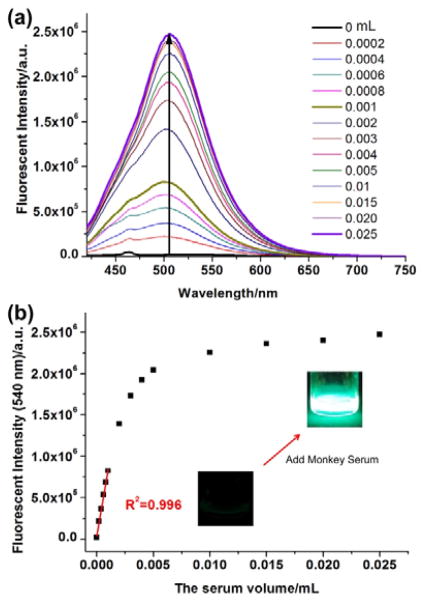
Serum albumin is known as the most abundant protein in blood serum. The probe’s fluorescence response to serum albumin in real blood samples would be considered as an ideal sensing tool. In this study, we prepared 10 μM of 4 dissolved in 1 mL of PBS buffer as a test solution. Upon addition of initial monkey serum to the test solution, the fluorescence of 4 was rapidly increased (Fig. 4), then gradually reached equilibrium with the 5 μL of serum, and eventually became very intense blue-green emission. The fluorescence intensity of 4 at 505 nm was enhanced up to 135-fold in the presence of 25 μL of serum sample and showed linear response to monkey serum concentration ranging from 0 to 1 μL/mL. The detection limit (S/N>3) for monkey serum was calculated as 0.03 μL. The result demonstrated that the probe was capable of estimating the albumin concentration in monkey serum samples.
Fig. 4.
(a) The fluorescence spectra changes and (b) fluorescent intensities (λ = 505 nm) of compound 4 (10 μM, in 1 mL of PBS buffer solution) upon addition of different volume of monkey serum
To demonstrate the feasibility of a wash-free method for protein imaging in polyacrylamide gels, compound 4 was directly used to stain the electrophoresis gel. Various proteins were run on the 1-D SDS-PAGE minigels with running buffer (25 mM Tris, 192 mM glycine, 0.1% SDS pH 8.3) under 100 volts for 1.5 hrs. The minigels were then placed in the dye solution (10 mM of compound 4, 0.3% SDS, and AcOH/DMSO/H2O = 5:10:85). Fig. 5 showed the fluorescent images of the gel containing BSA (0.1 μg, 1 μg, 10 μg, and 100 μg), 10 μg of human serum albumin (HSA), fibrinogen, lysozyme, and trypsin after 2 hours staining by 4. It was found BSA was efficiently stained and clearly observed at very low concentration (~1 μg) under a UV lamp. The serum albumin proteins were selectively stained because HSA had similar folding structure as BSA (seen in Fig. S25–S26 ESI†).44 Interestingly, the fluorescence pattern of proteins in the gel exhibited acceptable contrast ratio without washing process. Although the fluorescence background could be reduced by washing, the free dyes showed much weaker fluorescence in an aqueous medium and in gels, in comparison with commercial SYPRO Ruby. Therefore, the discovered protein-staining reagent had the following advantages: (1) low interference of SDS to fluorescence, thereby eliminating the pretreatment; (2) very weak fluorescent in water and gels to eliminate the need for the washing process; (3) strong interaction with the proteins (serum albumin) to reduce the staining time; (4) a high signal-to-noise (S/N) ratio for the high contrast ratio of images.
Fig. 5.
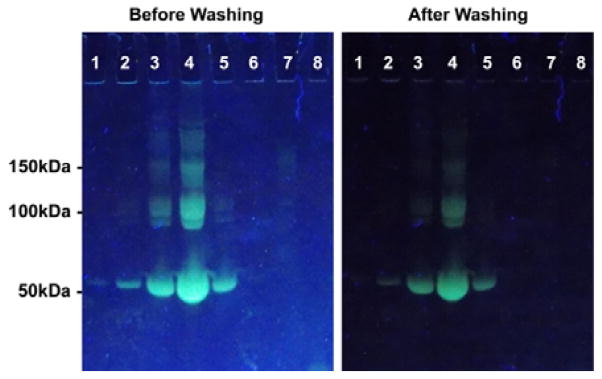
Fluorescence images of several proteins in electrophoresis gel stained by compound 4 before and after washing. 1. BSA at 0.1 μg; 2. BSA at 1 μg; 3. BSA at 10 μg; 4. BSA at 100 μg; 5. HSA at 10 μg; 6. Fibrinogen at 10 μg; 7. Lysozyme at 10 μg; 8. Trypsin at 10 μg.
Conclusions
In summary, we have developed a series of novel fluorescent probes for protein detection. Excellent protein response can be achieved by tuning the polarity of the dye structure, which optimized interaction with the protein’s hydrophobic pocket. A suitable donor-acceptor interaction might also play an important role in attenuating the fluorescence turn on. The results showed that the flavone sensor 4 exhibited superior sensitivity and selectivity to serum albumin. The detection limit for serum albumin in solution could reach as low as 0.09 μg/mL. The probe 4 could also be directly used for protein staining in polyacrylamide gels without the post-stain washing process. The selective detection of serum albumin from a blood sample, in addition to its simplified SDS-PAGE process, makes the probe a potentially useful tool for the clinical diagnosis of serum albumin-related disease.
Supplementary Material
Acknowledgments
We thank the National Institutes of Health for financial support (Grant No. 1R15EB014546-01A1) and.the Coleman endowment from the University of Akron for partial support. We also thank Dr. Yannian Li and Prof. Quan Li for the CD spectra.
Footnotes
Electronic Supplementary Information (ESI) available: Synthesis and characterization of compounds, experimental methods and procedures, supporting figures. See DOI:10.1039/x0xx00000x
Notes and references
- 1.Kobayashi H, Ogawa M, Alford R, Choyke PL, Urano Y. Chem Rev. 2010;110:2620–2640. doi: 10.1021/cr900263j. [DOI] [PMC free article] [PubMed] [Google Scholar]
- 2.Whitcombe MJ, Chianella I, Larcombe L, Piletsky SA, Noble J, Porter R, Horgan A. Chemical Society reviews. 2011;40:1547–1571. doi: 10.1039/c0cs00049c. [DOI] [PubMed] [Google Scholar]
- 3.Chan J, Dodani SC, Chang CJ. Nat Chem. 2012;4:973–984. doi: 10.1038/nchem.1500. [DOI] [PMC free article] [PubMed] [Google Scholar]
- 4.Mizukami S, Hori Y, Kikuchi K. Accounts Chem Res. 2014;47:247–256. doi: 10.1021/ar400135f. [DOI] [PubMed] [Google Scholar]
- 5.Vendrell M, Zhai DT, Er JC, Chang YT. Chem Rev. 2012;112:4391–4420. doi: 10.1021/cr200355j. [DOI] [PubMed] [Google Scholar]
- 6.Towbin H, Staehelin T, Gordon J. P Natl Acad Sci USA. 1979;76:4350–4354. doi: 10.1073/pnas.76.9.4350. [DOI] [PMC free article] [PubMed] [Google Scholar]
- 7.Renart J, Reiser J, Stark GR. P Natl Acad Sci USA. 1979;76:3116–3120. doi: 10.1073/pnas.76.7.3116. [DOI] [PMC free article] [PubMed] [Google Scholar]
- 8.Burnette WN. Cc/Life Sci. 1991:8–8. [Google Scholar]
- 9.Burnette WN. Anal Biochem. 1981;112:195–203. doi: 10.1016/0003-2697(81)90281-5. [DOI] [PubMed] [Google Scholar]
- 10.Borisov SM, Wolfbeis OS. Chem Rev. 2008;108:423–461. doi: 10.1021/cr068105t. [DOI] [PubMed] [Google Scholar]
- 11.Yang Y, Zhao Q, Feng W, Li F. Chem Rev. 2013;113:192–270. doi: 10.1021/cr2004103. [DOI] [PubMed] [Google Scholar]
- 12.Swierczewska M, Liu G, Lee S, Chen XY. Chemical Society reviews. 2012;41:2641–2655. doi: 10.1039/c1cs15238f. [DOI] [PMC free article] [PubMed] [Google Scholar]
- 13.Basu S, Sachidanandan C. Chem Rev. 2013;113:7952–7980. doi: 10.1021/cr4000013. [DOI] [PubMed] [Google Scholar]
- 14.Jisha VS, Arun KT, Hariharan M, Ramaiah D. J Phys Chem B. 2010;114:5912–5919. doi: 10.1021/jp100369x. [DOI] [PubMed] [Google Scholar]
- 15.Jisha VS, Arun KT, Hariharan M, Ramaiah D. J Am Chem Soc. 2006;128:6024–6025. doi: 10.1021/ja061301x. [DOI] [PubMed] [Google Scholar]
- 16.Ercelen S, Klymchenko AS, Mely Y, Demchenko AP. Int J Biol Macromol. 2005;35:231–242. doi: 10.1016/j.ijbiomac.2005.02.002. [DOI] [PubMed] [Google Scholar]
- 17.Volkova KD, Kovalska VB, Tatarets AL, Patsenker LD, Kryvorotenko DV, Yarmoluk SM. Dyes Pigments. 2007;72:285–292. [Google Scholar]
- 18.Xiong XQ, Song FL, Sun SG, Fan JL, Peng XJ. Asian J Org Chem. 2013;2:145–149. [Google Scholar]
- 19.Lee JS, Kim HK, Feng SH, Vendrell M, Chang YT. Chem Commun. 2011;47:2339–2341. doi: 10.1039/c0cc04495d. [DOI] [PubMed] [Google Scholar]
- 20.Wang ZL, Ma K, Xu B, Li X, Tian WJ. Sci China Chem. 2013;56:1234–1238. [Google Scholar]
- 21.Suzuki Y, Yokoyama K. J Am Chem Soc. 2005;127:17799–17802. doi: 10.1021/ja054739q. [DOI] [PubMed] [Google Scholar]
- 22.Peixoto PA, Boulange A, Ball M, Naudin B, Alle T, Cosette P, Karuso P, Franck X. J Am Chem Soc. 2014;136:15248–15256. doi: 10.1021/ja506914p. [DOI] [PubMed] [Google Scholar]
- 23.Xu YQ, Li ZY, Malkovskiy A, Sun SG, Pang Y. J Phys Chem B. 2010;114:8574–8580. doi: 10.1021/jp1029536. [DOI] [PubMed] [Google Scholar]
- 24.Zhuang YD, Chiang PY, Wang CW, Tan KT. Angew Chem Int Ed Engl. 2013;52:8124–8128. doi: 10.1002/anie.201302884. [DOI] [PubMed] [Google Scholar]
- 25.Yan JX, Harry RA, Spibey C, Dunn MJ. Electrophoresis. 2000;21:3657–3665. doi: 10.1002/1522-2683(200011)21:17<3657::AID-ELPS3657>3.0.CO;2-2. [DOI] [PubMed] [Google Scholar]
- 26.Berggren KN, Schulenberg B, Lopez MF, Steinberg TH, Bogdanova A, Smejkal G, Wang A, Patton WF. Proteomics. 2002;2:486–498. doi: 10.1002/1615-9861(200205)2:5<486::AID-PROT486>3.0.CO;2-X. [DOI] [PubMed] [Google Scholar]
- 27.Berggren K, Chernokalskaya E, Steinberg TH, Kemper C, Lopez MF, Diwu Z, Haugland RP, Patton WF. Electrophoresis. 2000;21:2509–2521. doi: 10.1002/1522-2683(20000701)21:12<2509::AID-ELPS2509>3.0.CO;2-9. [DOI] [PubMed] [Google Scholar]
- 28.Kumar CV, Buranaprapuk A, Opiteck GJ, Moyer MB, Jockusch S, Turro NJ. P Natl Acad Sci USA. 1998;95:10361–10366. doi: 10.1073/pnas.95.18.10361. [DOI] [PMC free article] [PubMed] [Google Scholar]
- 29.Burton RM, Westphal U. Metabolism. 1972;21:253. doi: 10.1016/0026-0495(72)90048-0. [DOI] [PubMed] [Google Scholar]
- 30.Curry S, Mandelkow H, Brick P, Franks N. Nat Struct Biol. 1998;5:827–835. doi: 10.1038/1869. [DOI] [PubMed] [Google Scholar]
- 31.Petitpas I, Bhattacharya AA, Twine S, East M, Curry S. J Biol Chem. 2001;276:22804–22809. doi: 10.1074/jbc.M100575200. [DOI] [PubMed] [Google Scholar]
- 32.Dufour C, Dangles O. Bba-Gen Subjects. 2005;1721:164–173. doi: 10.1016/j.bbagen.2004.10.013. [DOI] [PubMed] [Google Scholar]
- 33.Pal S, Saha C. J Biomol Struct Dyn. 2014;32:1132–1147. doi: 10.1080/07391102.2013.811700. [DOI] [PubMed] [Google Scholar]
- 34.Banerjee A, Basu K, Sengupta PK. J Photoch Photobio B. 2008;90:33–40. doi: 10.1016/j.jphotobiol.2007.10.005. [DOI] [PubMed] [Google Scholar]
- 35.Liu B, Shah M, Zhang G, Liu Q, Pang Y. ACS Appl Mater Interfaces. 2014;6:21638–21644. doi: 10.1021/am506698f. [DOI] [PMC free article] [PubMed] [Google Scholar]
- 36.Klymchenko AS. Actual Chimique. 2012;20–26 [Google Scholar]
- 37.Arnsdorf MF, Lal R. Imaging Technologies and Applications. 1992;1778:112–116. [Google Scholar]
- 38.Zhang XF, Wang C, Jin LJ, Han Z, Xiao Y. Acs Appl Mater Inter. 2014;6:12372–12379. doi: 10.1021/am503849c. [DOI] [PubMed] [Google Scholar]
- 39.Jin T. Sensors-Basel. 2010;10:2438–2449. doi: 10.3390/s100302438. [DOI] [PMC free article] [PubMed] [Google Scholar]
- 40.Klee GG. Clin Chem Lab Med. 2004;42:752–757. doi: 10.1515/CCLM.2004.127. [DOI] [PubMed] [Google Scholar]
- 41.Andreeva AM. J Evol Biochem Phys+ 2010;46:135–144. [Google Scholar]
- 42.Infusino I, Braga F, Mozzi R, Valente C, Panteghini M. Clinica chimica acta; international journal of clinical chemistry. 2011;412:791–792. doi: 10.1016/j.cca.2011.01.008. [DOI] [PubMed] [Google Scholar]
- 43.Basabe-Desmonts L, Reinhoudt DN, Crego-Calama M. Chemical Society reviews. 2007;36:993–1017. doi: 10.1039/b609548h. [DOI] [PubMed] [Google Scholar]
- 44.Gelamo EL, Tabak M. Spectrochim Acta A. 2000;56:2255–2271. doi: 10.1016/s1386-1425(00)00313-9. [DOI] [PubMed] [Google Scholar]
Associated Data
This section collects any data citations, data availability statements, or supplementary materials included in this article.


