

Abstract
Successful weight loss is variable for reasons not fully elucidated. Whether effective weight loss results from smaller reductions in energy expenditure during caloric restriction is not known. We analyzed whether obese individuals with a “thrifty” phenotype, that is, greater reductions in 24-h energy expenditure during fasting and smaller increases with overfeeding, lose less weight during caloric restriction than those with a “spendthrift” phenotype. During a weight-maintaining period, 24-h energy expenditure responses to fasting and 200% overfeeding were measured in a whole-room indirect calorimeter. Volunteers then underwent 6 weeks of 50% caloric restriction. We calculated the daily energy deficit (kilocalories per day) during caloric restriction, incorporating energy intake and waste, energy expenditure, and daily activity. We found that a smaller reduction in 24-h energy expenditure during fasting and a larger response to overfeeding predicted more weight loss over 6 weeks, even after accounting for age, sex, race, and baseline weight, as well as a greater rate of energy deficit accumulation. The success of dietary weight loss efforts is influenced by the energy expenditure response to caloric restriction. Greater decreases in energy expenditure during caloric restriction predict less weight loss, indicating the presence of thrifty and spendthrift phenotypes in obese humans.
Introduction
Whether greater weight loss is the result of a smaller reduction in energy expenditure with caloric restriction (CR) is not known. Resting energy expenditure and 24-h energy expenditure (24h-EE) vary substantially between individuals (1,2), and relatively reduced rates of 24h-EE predict weight gain in some populations (3,4). Obese individuals that lose at least 10% of their weight experience a decrease in 24h-EE and resting energy expenditure that is lower than predicted based on changes in body composition (5). Most weight loss and overfeeding studies have found large individual variation in the amount of weight change (6–9), and whether an individual’s response to an intervention can be predicted is not clear. Measurements of 24h-EE response to fasting and overfeeding may help predict weight loss.
“Thrift” refers generically to the efficiency with which energy is used (10). Some humans with a smaller increase in 24h-EE in response to short-term overfeeding have a correspondingly larger decrease in 24h-EE in response to fasting (thrifty) and vice versa (spendthrift) (11) (Fig. 1). This is true in lean and obese individuals and indicates an interindividual variability in the energy expenditure response to CR that might influence the ability to lose weight. The aim of this study was to define whether this variability in energy expenditure response to 24 h of fasting and overfeeding predicts weight changes during 6 weeks of controlled CR.
Figure 1.
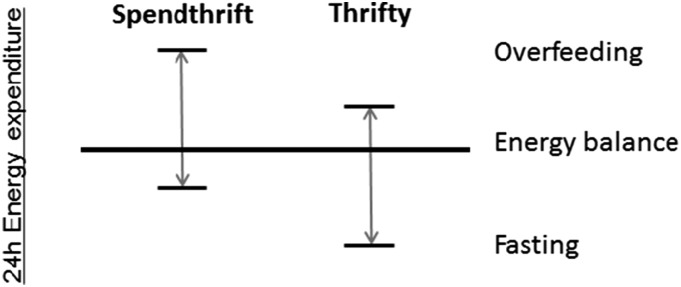
Illustration of the concept of spendthrift and thrifty phenotypes, characterized by their individual 24h-EE response to overfeeding and fasting.
Research Design and Methods
Subjects
We screened 47 individuals between 2008 and 2013 for this study; 15 healthy (based on physical examination and laboratory analysis, electrocardiography, and psychological assessment) but obese volunteers were admitted to our inpatient unit. Use of nicotine and illicit drugs was excluded by screening tests at admission, and none of the subjects were taking any medication. Three volunteers did not complete the study because of a family emergency, cellulitis of the right toe, and inability to continue CR; 12 volunteers were included in this analysis. General, anthropometric, and energy expenditure characteristics of the study population are provided in Table 1. Subjects were admitted for 77 ± 4 days to the inpatient unit of the Obesity and Diabetes Clinical Research Section of the National Institute of Diabetes and Digestive and Kidney Diseases in Phoenix, AZ (Fig. 2), where they were limited to primarily sedentary activity for the duration of the study. The research unit was kept at room temperature. Minor variability in days spent on the metabolic ward was the result of scheduling individual study procedures during baseline or after CR. Subjects were weighed in the same light clothes daily upon first awakening and were asked not to exercise for the duration of their stay. Volunteers were fully informed of the nature and purpose of the study, and written informed consent was obtained before admission. The experimental protocol was approved by the institutional review board of the National Institute of Diabetes and Digestive and Kidney Diseases.
Table 1.
General, anthropometric, and energy expenditure characteristics of the study population
| All (n = 12) | Men (n = 7) | Women (n = 5) | |
|---|---|---|---|
| Race, n | |||
| Caucasian | 6 | 4 | 2 |
| Hispanic | 3 | 1 | 2 |
| Native American | 3 | 2 | 1 |
| Age (years) | 33.7 ± 8.6 | 32.4 ± 10.3 | 35.4 ± 6.1 |
| Height (cm) | 169.4 ± 10.8 | 173.4 ± 11.0 | 162.0 ± 6.5 |
| Body weight (kg) | 107.5 ± 15.6 | 116.4 ± 8.1 | 95.1 ± 15.6* |
| Waist (cm) | 118.2 ± 18.0 | 121.0 ± 6.9 | 114.3 ± 8.5 |
| BMI (kg/m2) | 38.0 ± 6.3 | 39.2 ± 6.8 | 36.2 ± 5.8 |
| Body fat (%) | 42.1 ± 8.2 | 36.6 ± 4.8 | 49.7 ± 4.9** |
| FM (kg) | 44.9 ± 9.5 | 42.9 ± 8.6 | 47.6 ± 11.0 |
| FFM (kg) | 62.6 ± 14.0 | 73.5 ± 2.2 | 47.5 ± 6.1** |
| 24h-EE (kcal/day) | 2,344 ± 363 | 2,591 ± 174 | 2,000 ± 250** |
| Daily intake during CR (kcal) | 1,536 ± 149 | 1,646 ± 79 | 1,404 ± 97** |
| 24-h respiratory quotient | 0.85 ± 0.04 | 0.85 ± 0.04 | 0.86 ± 0.03 |
| Fasting glucose (mg/dL) | 93.1 ± 5.0 | 92.0 ± 5.6 | 94.7 ± 3.9 |
| 2-h glucose (mg/dL) | 141.8 ± 39.1 | 142.0 ± 35.8 | 141.6 ± 47.7 |
| Fasting insulin (μIU/mL) | 19.7 ± 10.8 | 20.0 ± 6.0 | 19.3 ± 16.3 |
| 2-h insulin (μIU/mL) | 184.0 ± 172.9 | 172.4 ± 170.0 | 200.2 ± 195.6 |
Values are presented as mean ± SD unless otherwise indicated. Intake during CR are values from bomb calorimetry measurements. Differences between men and women were assessed using the Student t test:
*P < 0.05;
**P < 0.01.
Figure 2.

Study design. Bomb refers to the bomb calorimetry of intake (food) and output (urine and feces). CR, 24h-EE assessment during caloric restriction; EB 1, 24h-EE assessment to determine weight-maintaining energy needs; EB 2, 24h-EE assessment in energy balance; EB 3, 24h-EE assessment in energy balance at new weight; FST, 24h-EE assessment during fasting; OF, 24h-EE assessment during overfeeding chamber; OGTT, oral glucose tolerance test; **At least 48 h at 100% WMD between the two 24h-EE assessments.
Study Protocol
Study Overview
Baseline Metabolic Stabilization Period
Upon admission volunteers were provided a standard weight-maintaining diet (WMD) with 50%, 30%, 20% carbohydrate, fat, and protein content, respectively. Individual weight-maintaining energy needs were determined based on weight and sex (12). The WMD was provided throughout the baseline period (22 ± 4 days), except for four 24-h periods, which volunteers spent in the whole-room indirect calorimeter (details below). Bomb calorimetry (details below) of a duplicate WMD meal was performed 3 days/week to accurately determine energy intake. If needed, daily caloric intake was adjusted to maintain a stable body weight (±1%). Urine and stool were collected 3 days/week and the energy content lost through excretion was determined by combustion. Average daily urine and stool calories were extrapolated to the rest of the associated week. Diabetes was ruled out by a 2-h, 75-g oral glucose tolerance test (after a 12-h overnight fast) according to the American Diabetes Association diagnostic criteria (13). Body composition (fat mass [FM] and fat-free mass [FFM]) was estimated by total body dual-energy X-ray absorptiometry (DXA) (DPX-L; Lunar Radiation, Madison, WI). Percentage body fat, FM, and FFM were estimated as previously described (14).
CR (42 Days)
Volunteers consumed a 50% calorie-reduced liquid diet (Ensure; Abbott Laboratories, Columbus, OH) based on their calculated weight-maintaining energy needs. Bomb calorimetry of duplicate meals was performed daily. Urine and stool were collected 3 days/week and the energy content was determined by combustion; 24h-EE was measured weekly, and spontaneous physical activity (details below) was assessed daily during the entire 6-week CR period. DXA scans were performed biweekly.
After CR
For 12 ± 2 days following CR, volunteers were fed a standard 100% WMD, based on their new weight. 24h-EE measurements, total-body DXA, and oral glucose tolerance tests were repeated. Duplicate bomb calorimetry was performed on WMD meals, urine, and stool 3 days/week.
Measurements
Energy Expenditure
24h-EE was assessed in a large, open-circuit indirect calorimeter (respiratory chamber), as previously described (15). Sleeping energy expenditure was calculated from 24h-EE as an approximate surrogate for resting metabolic rate between 11:00 p.m. and 5:30 a.m.
To closely achieve energy balance during the 24h-EE assessment and allow more precise calculation of the caloric requirements during overfeeding, 24h-EE was measured twice during eucaloric conditions in the baseline period. Energy intake during the first measurement in the eucaloric respiratory chamber was based on unit-specific calculations (2). The caloric amount of the meals eaten during the second eucaloric measurement was equal to the 24h-EE calculated from the first assessment. For all analyses, the results from the second eucaloric measurement were considered the baseline 24h-EE. The 24h-EE response during fasting and overfeeding (200% of the standard WMD during baseline) was determined. During CR, energy intake during the 24h-EE assessment was the same 50% calorie-reduced liquid diet eaten when not in the calorimeter. Because of the availability of the calorimeter, not every weekly 24h-EE assessment during weight loss was completed by all 12 subjects (24h-EE assessment in week 1 was completed by 11 individuals, by 5 in week 2, by 11 in week 3, by 2 in week 4, by 3 in week 5, and by 12 in week 6).
Bomb Calorimetry and Energy Intake and Waste
To measure accurately the energy content of provided food, urine, and stool, samples were combusted using the Isoperibol Calorimeter 6200 with a model 1108 oxygen bomb; details about this method are described elsewhere (Parr Manual no. 483 M, 6200 Calorimeter Operating Instruction Manual; Parr Instrument Co., Moline, IL). The meals provided during weight-maintenance periods were prepared in a metabolic kitchen using The Food Processor Software (ESHA Research 10.0.0; Salem, OR). On days of bomb calorimetry of the provided foods (Fig. 1), two identical meals were prepared; one meal was selected at random and given to the volunteer and the other meal was combusted to determine actual caloric content. Unconsumed food during the baseline period and the periods after CR was returned to the metabolic kitchen and its caloric content was measured by bomb calorimetry. The resulting calories (<5% of overall calories) were subtracted from those measured for the day’s meals.
We used nonabsorbable dye markers (FD&C blue) to determine the exact beginning and end of each 3-day stool transition period. Stool samples were collected from the appearance of the first marker until the appearance of the second marker. Stool samples for calorimetry were stored at −20°C, and after the 3-day collection period, the sample was weighed and distilled water equal to the weight of the stool was added. Samples were subsequently homogenized and followed by lyophilization (freeze-drying) of the feces–water slurry. Urine was collected from administration of the initial dye marker through administration of the second marker (i.e., for three consecutive 24-h periods). Daily urine collections underwent direct lyophilization, which was performed at −77°C with a Freezemobile 12XL instrument (Virtis, Gardiner, NY). After completion of the drying process, the sample was weighed and ∼1-g pellets of dried feces or urine were produced with a pellet press (Parr Instrument Co.). Thereafter, the energy content of stool and urine samples was analyzed using bomb calorimetry.
Activity Level
Physical activity was measured at all times during CR, including days spent in the calorimeter, using five omnidirectional accelerometers (Actical; Philips Respironics, Bend, OR) that were attached to each volunteer’s wrists, ankles, and waist, as previously described (16). Because of technical difficulties, complete activity-level data from all 42 days of CR was available from only 11 volunteers.
Using the Actical data, a daily activity factor was determined for each subject. First, the daily activity counts of all five activity monitors were combined into a single measure, that is, weighted average sedentary time (AST), using the FFM values of the related body parts from the DXA closest in time to the day in question as weighting factors in the following equation:
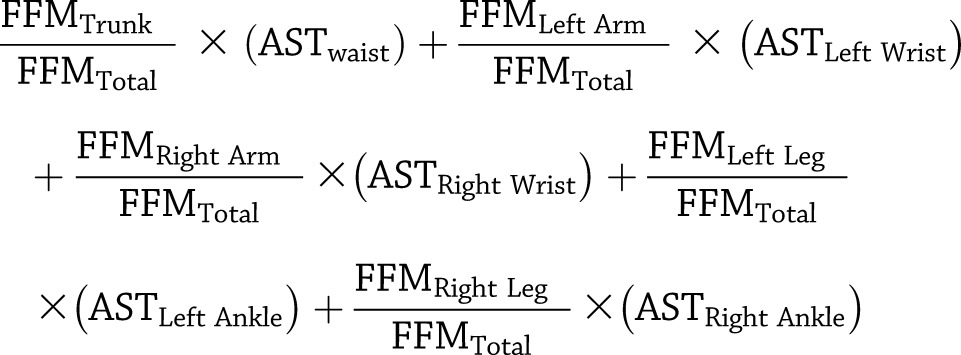 |
This weighted AST then was used to calculate a daily activity factor expressed as the ratio of daily active time to the active time within the chamber during the closest energy expenditure assessment:
 |
Calculations
To investigate the accuracy of measurements of energy intake and expenditure, we calculated the daily energy deficit during CR:
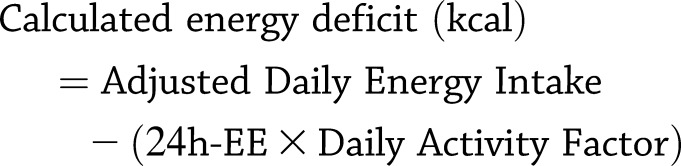 |
Adjusted daily energy intake was calculated as directly measured food calories minus measured calories excreted in urine and stool. The 24h-EE values from the corresponding weekly respiratory chamber measurement were used. In the case of missing 24h-EE assessment values, the values from the closest respiratory chamber measurement were used. The estimated 24h-EE for days without a measured assessment of 24h-EE was multiplied by the daily activity factor to account for differences in activity while within the respiratory chamber versus while on the clinical research unit.
Each individual’s assumed total-body energy deficit resulting from the 6 weeks of CR was estimated from the absolute change in body mass (ΔFM and ΔFFM in kilograms) using the DXA values from the baseline period and the last week of CR. The calories were extrapolated to 42 days. We applied previously published values of energy contents of FM (9,293.5 kcal/kg) and FFM (1,019.9 kcal/kg) (17):
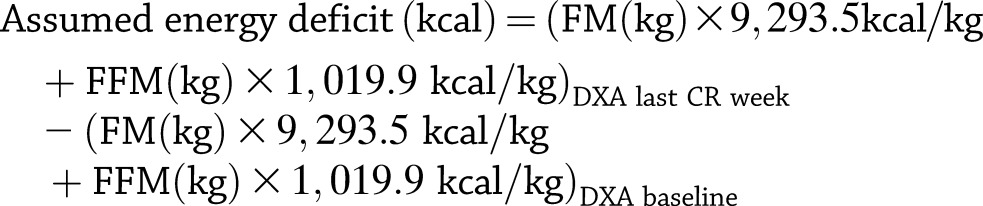 |
Finally, we calculated the difference between the sum of the daily calculated energy deficit and the assumed energy deficit (based on the ΔFM and ΔFFM) after 6 weeks of CR.
 |
The energy deficit required to lose 1 kg of body weight was calculated by dividing the calculated energy deficits by the absolute weight changes.
Statistical Analysis
Statistical analysis was performed using the SAS statistical software package (SAS E-guide 4.2 and SAS version 9.2; SAS Institute, Cary, NC). Unless otherwise specified, data are expressed as means ± SDs. Pearson correlation coefficients were used to examine associations between variables, unless otherwise specified. Sex differences were assessed using the Student t test. Anthropometric and metabolic characteristics before and after CR were compared using paired t tests. The impact of baseline predictors on weight change over 42 days was assessed in a mixed model (18,19) to account for both repeated measures using a first-order autoregressive covariance structure and the quadratic relationship of weight change with time. Race, baseline weight, sex, and age were included as covariates in all mixed models. Similar models were used to understand predictors of the accumulation of the calculated energy deficit but using a linear relationship with time. For illustrative purposes, we categorized spendthrift and thrifty subjects as those with 24h-EE responses to fasting above and below the median value, respectively, and differences between groups were compared using the Student t test. For analyses involving weight changes, we compared weights measured at the end of the baseline metabolic stabilization period to weights on the last day of CR. All reported weight and 24h-EE changes are expressed as percentage changes from the baseline values to account for differences in baseline body size between subjects.
Results
Predictors of Weight Loss
In response to fasting and overfeeding 24h-EE decreased by 9.4% ± 1.8% (range −12.1 to −5.3%; 218 ± 43 kcal/day; P < 0.001) and increased by 7.6% ± 4.6% (range −0.1 to 13.6; 188 ± 123 kcal/day; P < 0.001), respectively. Subjects with the smallest reduction in 24h-EE in response to fasting lost the most weight (r = −0.84; P < 0.001 [Fig. 3B]; changes in sleeping energy expenditure during fasting: r = 0.07; P = 0.83). This relationship was still true after adjusting for age, sex, and race in a mixed model (β = −0.66 kg; P = 0.001). Subjects with the greatest 24h-EE increases with overfeeding tended to lose the most weight (r = −0.38; P = 0.22, Spearman rank correlation), and this became significant in a mixed model using all data points and adjusting for age, sex, and race (β = −0.43 kg; P = 0.01). There was no association of baseline weight with percentage of weight lost (r = −0.38; P = 0.22, Spearman rank correlation). Dichotomizing our obese population by the 24h-EE response to fasting, individuals below the median (thrifty phenotype) weighed less at baseline (98.0 ± 15.8 vs. 119.1 ± 7.3 kg; P = 0.02). Weighted AST did not differ between days spent inside and outside of the calorimeter (P = 0.87, paired t test). Weighted AST was positively related to weight change; more sedentary subjects lost less weight (r = 0.62; P = 0.04, Spearman rank correlation [n = 11]; Fig. 3C). After adjusting for age, sex, and race in a mixed model, weighted AST had a small influence on the daily rate of weight loss (β = 0.000096 kg/day; P = 0.02), and each 10% increase in sedentary time resulted in 0.001 kg less weight loss per day (0.04 kg less weight loss over 42 days). In a full model adjusting for age, sex, race, and baseline weight and accounting for repeated measures, weighted AST (β = 0.000059 kg/day; P = 0.02) and 24h-EE response to fasting (β = −0.55 kg; P < 0.001) and overfeeding (β = −0.083 kg; P = 0.02) were independent predictors of weight loss. Anthropometric and metabolic characteristics at baseline and changes after CR are given in Tables 1 and 2, respectively.
Figure 3.

A: Individual percent weight loss curves. Baseline weight (Day 0) was set as the weight from the initial DXA scan during the weight stabilization period, and final weight was from the last day of CR (Day 42). Weight increases in 3 individuals between Day 0 and Day 1 are due to weight variations during the stabilization period. C, Caucasian; H, Hispanic; NA, Native American. B: Correlation between 24h-EE response to fasting and percent weight change during CR (r = −0.84; P ≤ 0.001; n = 12). C: Correlation between percent sedentary time during CR and percent weight loss (r = 0.63; P = 0.04; n = 11). ○, Female volunteer; ▲, male volunteer.
Table 2.
Changes in body composition and energy expenditure between baseline and the end of CR
| All | Men | Women | |
|---|---|---|---|
| Body weight (kg) | −8.6 ± 1.9 (−9.3 ± 2.8) | −9.5 ± 1.5*** (−11.0 ± 1.9) | −7.3 ± 1.8** (−7.0 ± 1.8) |
| Waist (cm) | −5.2 ± 3.1 (−2.4 ± 1.4) | −4.4 ± 3.5* (−2.1 ± 1.6) | −6.2 ± 2.4** (−2.8 ± 1.0) |
| BMI (kg/m2) | −5.7 ± 2.9 (−3.3 ± 1.0) | −6.1 ± 3.7*** (−3.8 ± 1.1) | −5.2 ± 1.5** (−2.6 ± 0.6) |
| FM (kg) | −7.1 ± 4.0 (−3.2 ± 1.9) | −7.6 ± 3.6** (−3.3 ± 1.7) | −6.3 ± 4.7* (−3.0 ± 2.3) |
| FFM (kg) | −7.1 ± 4.1 (−4.5 ± 3.0) | −8.0 ± 4.3** (−5.8 ± 3.1) | −5.7 ± 4.0* (−2.6 ± 1.7) |
| 24h-EE (kcal) | −13.2 ± 3.0 (−314 ± 101) | −14.0 ± 2.7*** (−363 ± 87) | −12.2 ± 3.3** (−245 ± 83) |
Values are presented as mean percentage changes ± SD (mean absolute changes ± SD). Differences between men and women were assessed using the Student t test:
*P < 0.05;
**P < 0.01;
***P < 0.001.
Calculated Energy Deficit
There was a positive association between weight loss and the calculated energy deficit (summed over 42 days; r = 0.75; P = 0.009, Spearman rank correlation) (Fig. 4A). That is, individuals with the greatest weight loss had the greatest calculated energy deficit. The 24h-EE reduction in response to fasting and the calculated energy deficit were negatively associated (r = −0.73; P = 0.01, Spearman rank correlation; Fig. 4C); those with the smallest reduction in 24h-EE in response to fasting had the greatest calculated energy deficit. In the multivariate mixed models adjusted for age, sex, race, and baseline weight, 24h-EE responses to fasting (β = −124 kcal/day; P < 0.0001) and overfeeding (β = −37 kcal/day; P < 0.0001) predicted a greater daily cumulative energy deficit over time (Fig. 4B). The mean energy deficit required to lose 1 kg of body weight was 4,935 kcal (2,239 kcal/lb; range 3,434–6,600 kcal/kg and 1,558–2,993 kcal/lb).
Figure 4.

A: Correlation between summed calculated energy deficit over 42 days and percent weight loss during CR (r = 0.7; P = 0.02; n = 11). B: Daily cumulative (42 days) calculated energy deficit by categorization of thrifty (gray line) and spendthrift (black line) phenotypes, based on the median of 24h-EE response to fasting; thrifty phenotype n = 6; spendthrift phenotype n = 5. Error bars represent standard deviations. C: Correlation between percent decrease in 24h-EE in response to fasting and summed calculated energy deficit over 42 days (r = −0.66; P = 0.03; n = 11). D: Daily cumulative calculated energy deficit over 42 days with assumed energy deficit data points superimposed. The upper and lower dashed lines represent the 95% CI of the means of the calculated energy deficit. Vertical error bars associated to the closed squares represent the standard deviation of the assumed energy deficit. ○, Female volunteer; ▲, male volunteer.
Assumed Energy Deficit From DXA
There were no significant associations between percentage weight loss (r = 0.45; P = 0.16), percentage of 24h-EE in response to fasting (r = −0.38; P = 0.3) or overfeeding (r = −0.018; P = 0.96), and the assumed energy deficit from DXA measurements. When comparing the calculated and assumed energy deficits, we found a mean difference of 571 ± 19,002 kcal over 6 weeks, or 14 ± 452 kcal/day, between methods (P = 0.3; Fig. 4D). There was a moderate association between the assumed and calculated energy deficit (r = 0.49; P = 0.13, Spearman rank correlation).
Discussion
In the setting of carefully controlled CR in an inpatient setting we found evidence of a thrifty phenotype among obese individuals. This phenotype was defined by a relatively larger decrease in 24h-EE with fasting and a smaller increase in 24h-EE with overfeeding. These characteristics were associated with smaller weight loss during CR, and a more spendthrift phenotype was related to a greater weight loss and rate of calculated energy deficit accumulated over 42 days.
Wide interindividual variability in the amount and rate of weight loss during CR is common and has been repeatedly demonstrated in underfeeding studies (5,20–22). Our aim was to identify and quantify possible physiologic causes of this variability. To date, differences in the physiology of energy expenditure have not been able to explain why some people lose weight with less difficulty than others when dieting. Despite the lack of reliable methods to measure food intake (both in a metabolic ward and more so under free-living conditions), excess caloric intake is suspected to be the main cause of obesity (1,23). The variability and reproducibility of the energy expenditure changes during CR and overfeeding make these physiological measurements interesting candidates when trying to understand individual differences in success during dietary weight loss interventions (15).
The mean 24h-EE response to short-term fasting and overfeeding in our subjects confirmed previously reported values from human studies (11,15,24–26). Weyer et al. (11) reported a correlation between the metabolic responses to short-term fasting and overfeeding in humans, such that individuals with the smallest decrease in 24h-EE in response to fasting had the greatest increase in 24h-EE in response to overfeeding. Importantly, this was shown in a mixed group of both lean and obese individuals, indicating that, despite weight gain, certain obese individuals retain a more spendthrift energy expenditure phenotype. We have described for the first time that obese individuals with a spendthrift phenotype lost the most weight during 6 weeks of CR. A 1% smaller 24h-EE decrease during fasting (range −5.3% to −12.1%) led to a larger energy deficit of 124 kcal/day, or a greater cumulative energy loss of more than 5,000 kcal over the 6-week time period. A 124-kcal/day smaller energy deficit in the thrifty phenotype is equivalent to the amount of energy expenditure reduction caused by a melanocortin 4 receptor (MC4R) gene mutation in Pima Indians (∼110–140 kcal/day) (26), which predisposes these individuals to obesity (27).
The data indicate that only 24h-EE changes in response to fasting, not changes in sleeping energy expenditure (an approximate surrogate for resting metabolic rate) during fasting, were associated with the observed weight changes over 42 days of CR, indicating that resting energy expenditure is unlikely to be involved in the observed difference between individuals the thrifty and spendthrift phenotypes. Thus the differences are likely the result of variation in the energy expenditure response to CR. This may be related to diet-induced thermogenesis, which may convey resistance to weight gain during overfeeding.
The identification of the two phenotypes before the caloric deficit–induced weight loss differentiates our findings from those of previous work (28,29), where the concurrent occurrence of changes in energy expenditure and weight loss/gain was observed during or after caloric deficit/excess interventions. As noted above, because we are demonstrating a metabolic adaptation to CR that is measurable before and during weight loss under CR, it is plausible that this adaptation has an influence on diet-related energy metabolism. The accelerated accumulation of the calculated energy deficit is important because calculated energy deficit was positively correlated with weight loss. This indicates as well that further understanding of these phenotypes requires meticulous measurement of both energy intake (accounting for waste) and energy expenditure.
Even though there was no continuous association between baseline weight and percentage weight loss, when we dichotomized our study population by the energy expenditure response to fasting, the thrifty phenotype had a lower body weight at baseline. One possible explanation for their greater 24h-EE response to fasting might be that effects of prior dieting lead to the more preservative thrifty phenotype. In general, mechanisms that might lead to the thrifty versus spendthrift phenotype are not clear. Individual responses of the sympathetic nervous system (30–32), thyroid hormones (32–34), and leptin and ghrelin (35), among others, are likely to have a major influence. It is possible that our subjects had variable volumes of brown adipose tissue, which influences human energy expenditure (36). The variability in weight loss after the same relative CR over 6 weeks is a result of changes in diet-related energy metabolism and especially the interindividual variability of those changes during CR. Variation in the amount of brown adipose tissue might (at least in part) account for the observed weight loss variability via its effect on diet-related energy metabolism. However, brown adipose tissue activation was not measured in our study. While the relationship of the predictors of weight loss during CR was dominated by the metabolic response to fasting, the statistically significant response to overfeeding might have an even more important role in preventing or limiting weight gain. Although sedentary time was a statistically independent negative predictor of weight loss, even after adjusting for 24h-EE response to fasting and overfeeding, age, sex, race, and baseline weight, it was physiologically less relevant.
Our finding that only the calculated energy deficit (kilocalories), not values based on the caloric contents of body composition changes (measured by DXA), accurately represent the weight loss percentage indicates the importance of energy balance measuring techniques when examining metabolic changes during CR. One of the underlying assumptions of DXA—a constant hydration of lean body mass—is not provided during the early phase of voluntary weight loss because of glycogen, sodium, protein, and fluid shifts (37) and therefore might explain the diverging results between the two methods, especially with this small number of individuals. In addition, in the calculation of assumed energy deficit, FFM is treated as one value, which is likely not the case given the wide variety of tissue it represents. A comparison of the assumed and measured energy did, however, show a moderate but nonsignificant (because of the small sample size) association between the two methods. In combination with the resulting 14 ± 452 kcal/day measurement difference, the two methods can be considered in fair agreement.
The pervasive rule that an energy deficit of 3,500 kcal is required to lose 1 lb of body weight is based on calculations assuming that dietary weight loss is mostly a result of energy-dense FM loss (38). We found considerably lower values and wide interindividual variation in the caloric cost of losing 1 lb body mass in both thrifty and spendthrift subjects (mean 2,239 kcal/lb, range 1,558–2,993 kcal/lb), with no statistically significant difference between the two groups. However, our DXA measures before and after CR (weight-stable conditions) revealed that both FM and FFM were reduced, confirming earlier findings by Forbes (39,40).
Our study is limited by a few missing 24h-EE assessments during CR, which are missing at random. DXA measurements are complete and were performed in the same week but not always on analogous days during the study. Further, to calculate the energy deficit based on body composition changes measured by DXA, we used estimates of energy content of FM (38.91 MJ/kg) and FFM (4.27 MJ/kg); we acknowledge that these values are population averages and might differ interindividually. In addition, possible differences in the amount of standing versus sitting time and spontaneous muscle contraction (all of which are components of “non exercise activity thermogenesis” [41]), for example, that used for maintaining posture, which cannot be measured as precisely with the accelerometers used in this study (42), might explain at least part of the larger energy deficit in subjects with the spendthrift phenotype. We acknowledge the small sample size as a limitation of this study. Our use of repeated measure analyses, however, thereby increasing measurement precision and statistical power, enabled us to adjust for multiple confounders (18,19).
In conclusion, using detailed measures of actual energy intake (as measured by bomb calorimetry) and energy expenditure (using whole-room indirect calorimetry and activity monitoring) during carefully monitored prolonged inpatient studies, we clearly determined that there is variation in the extent of weight loss in obese humans during 50% CR that is not the result of a lack of adherence but is caused by real biologic interindividual variation in energy expenditure responses to the same energy deficits, that is, thrifty and spendthrift phenotypes. Whether identification of these phenotypes can be harnessed to prevent weight gain in humans remains to be established.
Article Information
Acknowledgments. The authors thank the dietary, nursing, and technical staff of the National Institutes of Health Clinical Unit in Phoenix, AZ, for their assistance. Most of all, the authors thank the volunteers for their participation in the study.
Funding. This research was supported by the Intramural Research Program of the National Institutes of Health, National Institute of Diabetes and Digestive and Kidney Diseases.
Duality of Interest. No potential conflicts of interest relevant to this article were reported.
Authors Contributions. M.R. wrote the manuscript. M.R. and M.S.T. analyzed the data. M.I. analyzed the data and wrote the sections of the manuscript relating to activity measurements. J.K. and S.B.V. designed the study. M.R., M.S.T., M.I., M.G.H., C.B., J.K., and S.B.V. contributed to the interpretations of findings and commented on and edited the drafts. S.B.V. is the guarantor of this work and, as such, had full access to all the data in the study and takes responsibility for the integrity of the data and the accuracy of the data analysis.
Footnotes
See accompanying article, p. 2714.
Clinical trial reg. no. NCT00687115, clinicaltrials.gov.
References
- 1.Bogardus C, Lillioja S, Ravussin E, et al. Familial dependence of the resting metabolic rate. N Engl J Med 1986;315:96–100 [DOI] [PubMed] [Google Scholar]
- 2.Ravussin E, Lillioja S, Anderson TE, Christin L, Bogardus C. Determinants of 24-hour energy expenditure in man. Methods and results using a respiratory chamber. J Clin Invest 1986;78:1568–1578 [DOI] [PMC free article] [PubMed] [Google Scholar]
- 3.Ravussin E, Lillioja S, Knowler WC, et al. Reduced rate of energy expenditure as a risk factor for body-weight gain. N Engl J Med 1988;318:467–472 [DOI] [PubMed] [Google Scholar]
- 4.Ravussin E, Gautier JF. Metabolic predictors of weight gain. Int J Obes Relat Metab Disord 1999;23(Suppl. 1):37–41 [DOI] [PubMed] [Google Scholar]
- 5.Leibel RL, Rosenbaum M, Hirsch J. Changes in energy expenditure resulting from altered body weight. N Engl J Med 1995;332:621–628 [DOI] [PubMed] [Google Scholar]
- 6.Kassirer JP, Angell M. Losing weight—an ill-fated New Year’s resolution. N Engl J Med 1998;338:52–54 [DOI] [PubMed] [Google Scholar]
- 7.Wing RR, Hill JO. Successful weight loss maintenance. Annu Rev Nutr 2001;21:323–341 [DOI] [PubMed] [Google Scholar]
- 8.Holloszy JO, Fontana L. Caloric restriction in humans. Exp Gerontol 2007;42:709–712 [DOI] [PMC free article] [PubMed] [Google Scholar]
- 9.Bouchard C, Tremblay A, Després J-P, et al. The response to long-term overfeeding in identical twins. N Engl J Med 1990;322:1477–1482 [DOI] [PubMed] [Google Scholar]
- 10.Wells JCK. Thrift: a guide to thrifty genes, thrifty phenotypes and thrifty norms. Int J Obes (Lond) 2009;33:1331–1338 [DOI] [PubMed] [Google Scholar]
- 11.Weyer C, Vozarova B, Ravussin E, Tataranni PA. Changes in energy metabolism in response to 48 h of overfeeding and fasting in Caucasians and Pima Indians. Int J Obes Relat Metab Disord 2001;25:593–600 [DOI] [PubMed] [Google Scholar]
- 12.Ferraro R, Boyce VL, Swinburn B, De Gregorio M, Ravussin E. Energy cost of physical activity on a metabolic ward in relationship to obesity. Am J Clin Nutr 1991;53:1368–1371 [DOI] [PubMed] [Google Scholar]
- 13.American Diabetes Association Diagnosis and classification of diabetes mellitus. Diabetes Care 2008;31(Suppl. 1):S55–S60 [DOI] [PubMed] [Google Scholar]
- 14.Tataranni PA, Ravussin E. Use of dual-energy X-ray absorptiometry in obese individuals. Am J Clin Nutr 1995;62:730–734 [DOI] [PubMed] [Google Scholar]
- 15.Thearle MS, Pannacciulli N, Bonfiglio S, Pacak K, Krakoff J. Extent and determinants of thermogenic responses to 24 hours of fasting, energy balance, and five different overfeeding diets in humans. J Clin Endocrinol Metab 2013;98:2791–2799 [DOI] [PMC free article] [PubMed] [Google Scholar]
- 16.He J, Votruba S, Pomeroy J, Bonfiglio S, Krakoff J. Measurement of ad libitum food intake, physical activity, and sedentary time in response to overfeeding. PLoS One 2012;7:e36225. [DOI] [PMC free article] [PubMed] [Google Scholar]
- 17.Bouchard C, Tremblay A. Genetic influences on the response of body fat and fat distribution to positive and negative energy balances in human identical twins. J Nutr 1997;127(Suppl.):943S–947S [DOI] [PubMed] [Google Scholar]
- 18.Ellis MV. Repeated measures designs. Couns Psychol 1999;27:552–578 [Google Scholar]
- 19.Marshall JA, Scarbro S, Shetterly SM, Jones RH. Improving power with repeated measures: diet and serum lipids. Am J Clin Nutr 1998;67:934–939 [DOI] [PubMed] [Google Scholar]
- 20.Keys A, Brožek J, Henschel A, Mickelsen O, Taylor HL. The Biology of Human Starvation. Vol. 1. Minneapolis, MN, University of Minnesota Press, 1950 [Google Scholar]
- 21.Miller DS, Parsonage S. Resistance to slimming: adaptation or illusion? Lancet 1975;1:773–775 [DOI] [PubMed] [Google Scholar]
- 22.Weyer C, Walford RL, Harper IT, et al. Energy metabolism after 2 y of energy restriction: the biosphere 2 experiment. Am J Clin Nutr 2000;72:946–953 [DOI] [PubMed] [Google Scholar]
- 23.Garrow JS, Blaza SE, Warwick PM, Ashwell MA. Predisposition to obesity. Lancet 1980;1:1103–1104 [DOI] [PubMed] [Google Scholar]
- 24.Miller DS, Mumford P, Stock MJ. Gluttony. 2. Thermogenesis in overeating man. Am J Clin Nutr 1967;20:1223–1229 [DOI] [PubMed] [Google Scholar]
- 25.Ravussin E, Schutz Y, Acheson KJ, Dusmet M, Bourquin L, Jéquier E. Short-term, mixed-diet overfeeding in man: no evidence for “luxuskonsumption”. Am J Physiol 1985;249:E470–E477 [DOI] [PubMed] [Google Scholar]
- 26.Krakoff J, Ma L, Kobes S, et al. Lower metabolic rate in individuals heterozygous for either a frameshift or a functional missense MC4R variant. Diabetes 2008;57:3267–3272 [DOI] [PMC free article] [PubMed] [Google Scholar]
- 27.Farooqi IS, Keogh JM, Yeo GSH, Lank EJ, Cheetham T, O’Rahilly S. Clinical spectrum of obesity and mutations in the melanocortin 4 receptor gene. N Engl J Med 2003;348:1085–1095 [DOI] [PubMed] [Google Scholar]
- 28.Schwartz A, Doucet E. Relative changes in resting energy expenditure during weight loss: a systematic review. Obes Rev 2010;11:531–547 [DOI] [PubMed] [Google Scholar]
- 29.Müller MJ, Bosy-Westphal A. Adaptive thermogenesis with weight loss in humans. Obesity (Silver Spring) 2012;21:218–228 [DOI] [PubMed] [Google Scholar]
- 30.Saad MF, Alger SA, Zurlo F, Young JB, Bogardus C, Ravussin E. Ethnic differences in sympathetic nervous system-mediated energy expenditure. Am J Physiol 1991;261:E789–E794 [DOI] [PubMed] [Google Scholar]
- 31.Tataranni PA, Young JB, Bogardus C, Ravussin E. A low sympathoadrenal activity is associated with body weight gain and development of central adiposity in Pima Indian men. Obes Res 1997;5:341–347 [DOI] [PubMed] [Google Scholar]
- 32.Rosenbaum M, Hirsch J, Murphy E, Leibel RL. Effects of changes in body weight on carbohydrate metabolism, catecholamine excretion, and thyroid function. Am J Clin Nutr 2000;71:1421–1432 [DOI] [PubMed] [Google Scholar]
- 33.Danforth E Jr, Horton ES, O’Connell M, et al. Dietary-induced alterations in thyroid hormone metabolism during overnutrition. J Clin Invest 1979;64:1336–1347 [DOI] [PMC free article] [PubMed] [Google Scholar]
- 34.Iwen KA, Schröder E, Brabant G. Thyroid hormones and the metabolic syndrome. Eur Thyroid J 2013;2:83–92 [DOI] [PMC free article] [PubMed] [Google Scholar]
- 35.Klok MD, Jakobsdottir S, Drent ML. The role of leptin and ghrelin in the regulation of food intake and body weight in humans: a review. Obes Rev 2007;8:21–34 [DOI] [PubMed] [Google Scholar]
- 36.Saito M. Brown adipose tissue as a regulator of energy expenditure and body fat in humans. Diabetes Metab J 2013;37:22–29 [DOI] [PMC free article] [PubMed] [Google Scholar]
- 37.Heymsfield SB, Thomas D, Nguyen AM, et al. Voluntary weight loss: systematic review of early phase body composition changes. Obes Rev 2011;12:e348–e361 [DOI] [PubMed] [Google Scholar]
- 38.Wishnofsky M. Caloric equivalents of gained or lost weight. Am J Clin Nutr 1958;6:542–546 [DOI] [PubMed] [Google Scholar]
- 39.Forbes GB. Lean body mass-body fat interrelationships in humans. Nutr Rev 1987;45:225–231 [DOI] [PubMed] [Google Scholar]
- 40.Forbes GB. Body fat content influences the body composition response to nutrition and exercise. Ann N Y Acad Sci 2000;904:359–365 [DOI] [PubMed] [Google Scholar]
- 41.Levine JA, Eberhardt NL, Jensen MD. Role of nonexercise activity thermogenesis in resistance to fat gain in humans. Science 1999;283:212–214 [DOI] [PubMed] [Google Scholar]
- 42.Oliver M, Schofield GM, Badland HM, Shepherd J. Utility of accelerometer thresholds for classifying sitting in office workers. Prev Med 2010;51:357–360 [DOI] [PubMed] [Google Scholar]