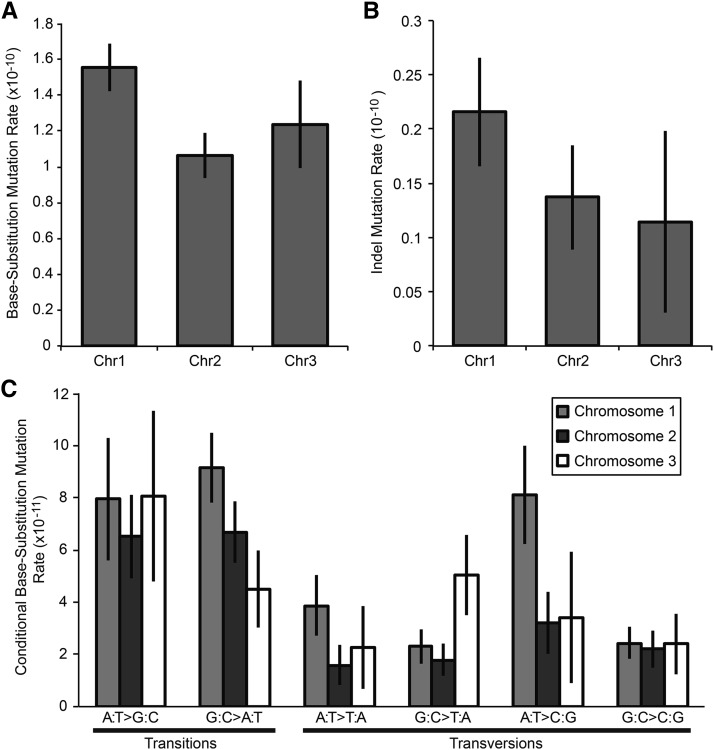
Figure 3.
Substitution and indel mutation rates for the three chromosomes of B. cenocepacia; error bars indicate one standard error of the mean. (A and B) Overall base-substitution and indel mutation rates. (C) Conditional base-substitution mutation rates for each chromosome of B. cenocepacia estimated as described in Figure 2, based on the analyzed nucleotide content of each chromosome.

