

Abstract
Plasma viral load has been shown to be a meaningful prognostic marker for disease progression in untreated, HIV-1 subtype B-infected subjects in US and Western Europe and therefore used as a prognostic marker for disease progression in HIV-1 subtype B-infected subjects. Because of high expenses of commercially available viral load assays, the role of viral load in disease progression has not been evaluated in HIV-1 subtype C infected patients in India. We developed an inexpensive realtime RTPCR assay to quantify viral load in plasma of HIV-1 subtype C-infected subjects from India and used it in a longitudinal analysis of viral load and CD4 cell number in HIV infected subjects from Calcutta, India. The realtime assay can quantify plasma viral
Keywords: Plasma HIV load, CD4 decline, Indian subjects, real-time RTPCR
Introduction
It is estimated that approximately 2.6 million HIV-1-infected people are living in India (UNAIDS report 2007). Much of HIV-1 infection in India is heterosexually transmitted. HIV-1 seroprevalence in India has been estimated to be 1.4–40 % among the patients attending sexually transmitted disease (STD) clinics and among commercial sex workers. Annual sero-incidence rate of 7–8% has been reported in high-risk populations1–3. Genetic analyses of HIV-1 sequences circulating in different parts of India have shown that the predominant proportion of HIV-1 circulating in India is of subtype C origin with a small fraction of subtypes A and B 4–10. Furthermore, genetic analysis of HIV-1 circulating in India indicates that subtype C sequences from different parts of India were more closely related to each other than to subtype C sequences from Botswana, Burundi, South Africa, Tanzania and Zimbabwe, indicating that the subtype C in India is different from the subtype C circulating in other parts of the world9. In addition, co-receptor switch from CCR5 to CXCR4 observed with disease progression in subtype B infected subjects has never been observed in subtype C-infected subjects in India 11. These differences in biologic and genetic properties between subtype B in Western Countries and subtype C in India raise the possibility that viral dynamics and hence disease progression might be different in India.
In subtype B infected subjects in US and Western Europe plasma viral load has been correlated with CD4 cell number and therefore used as a prognostic marker for disease progression12–14. However, there is very little information on the role of viral load in disease development in HIV-1-infected subjects in India. In one report by Mehendale et al15 investigators examined viral load set points and CD4 decline among Indian seroconverters during the first two years of infection. They found a loss of 120 cells per year which is lower than that found in Multicenter AIDS Cohort Study (MACS)16. One of the problems of measuring plasma viral load in Indian subjects is that most of the commercially available viral load assays, except Roche Amplicor 1.5, are mostly not optimized to accurately quantitate subtype C HIV-1 that are circulating among Indian subjects. In addition, these commercially available assays are extremely expensive to use for any long term study in India. In this report we have standardized an inexpensive real time RTPCR which can accurately measure plasma viral load in Indian subjects. Using this assay we have determined the relationship between viral load and CD4 cell number and estimated rates of CD4 depletion relative to current CD4 cell counts and HIV-1 RNA levles.
Materials and Methods
Study population and sample collection
Samples were collected for a period of 5.75 years from 39 HIV-1-infected subjects enrolled in this study at the Virology Department of the School of Tropical Medicine (STM), Calcutta, India, from December 2000 to June 2005 2. Informed consent for HIV-1 testing and questionnaire were obtained from all the subjects. Physical examination, specimen collection and interviews were conducted only after the consent forms were either signed or thumb printed by the subjects. Sexual behavior, STD history, other risk factors, knowledge of AIDS and demographic data of the patients were obtained by administering a questionnaire. All subjects were examined for genital ulceration or urethritis or for other obvious illnesses by a physician and were offered therapy for STDs according to Centers for Disease Control and Prevention (CDC) and World Health Organization guidelines. However, none of these subjects were treated with any antiretroviral drugs.
HIV-1 serological status of the subjects was determined by a sensitive ELISA (Organon Technika, Durham, NC, USA), and subsequently confirmed by Western blot (DuPont, DE)2.
Plasma samples were obtained from whole blood collected in EDTA-treated blood collection tubes at 2–3 times a year and stored frozen until assayed for viral load. CD4 T lymphocytes numbers were measured at designated visits by a commercial company (Ranbaxy, Bombay, India) using a standard flow cytometer.
Viral load measurement using Real time RTPCR
Total RNA was isolated from 200μl blood plasma by RNA-Bee™ method (TEL-TEST, INC, Friendwood, TX). 20–200μl plasma equivalent RNA was applied for reverse transcription using TaqMan® Reverse Transcription Reagents (Applied Biosystems) according to the manufacture’s protocol. A 30μl TaqMan® PCR was performed by mixing 5μl cDNA with 20x TaqMan® Universal PCR Master Mix (Applied Biosystems), 900nM each of forward and reverse primer (Forward: 5′-GGAATTCCCTACAATCCCCAAA, HXB2 location: 4647–4668; Reverse: 5′-ACCTGCCCTATGATTTTCTTTAATTCTT, 4696–4723) and 250nM FAM/ MGB labeled probe (5′-TTCATGGATTCTACTACTCCCT, 4672–4693). ABI Prism 7000 Sequence Detection System was used to carry out Real-Time PCR using the following cycling condition: 50 ºC for 2 min, 95 ºC for 10 min, 45 cycles of 95 ºC for 15 sec and 60 ºC for 1 min. The primers and probe designed for the Real-Time PCR were based on HIV-1 Indian C consensus sequence encoding the pol region17 and producing a 77 bp amplicon. No Template Control was included in each assay as well to guard against cross contamination. Each sample was run in triplicate. To generate a standard curve the PCR product amplified from pIndC1 (a cloned full length Indian subtype C DNA) was cloned into a plasmid vector using TOPO TA Cloning® kit (Invitrogen). The purified plasmid DNA containing the 77 bp specific insert was then in vitro transcribed into HIV-1pol cRNA by Riboprobe® in Vitro Transcription Systems (Promega). Synthesized cRNA was further treated by DNA-free™ DNase Treatment & Removal Reagents (Ambion) to remove any contaminating DNA template. Serial diluted cRNA ranging from 10 to 107 were applied to each RT-PCR assay for constructing a standard curve. ABS Prism 7000 SDS Software (Applied Biosystems) was used for PCR data analysis and HIV-1 copy number estimation.
Roche Amplicor 1.5 assay and Nuclisens assay
These assays were performed as described by the manufacturers.
Virus Isolation
Virus was isolated from cryopreserved PBMC obtained from HIV-1-infected subjects recruited at STM in India as described previously1, 18, except that it was done in micro format because of a limitation of the number of PBMC available. Briefly, one to three million PBMC were co-cultured with half the amount of PHA-stimulated CD8 depleted PBMC from a normal donor in RPMI 1640 containing 20% FCS and 5ug/ml of natural IL-2. Once a week half of the medium was replaced with fresh medium containing the same amount of PHA-stimulated CD8 depleted PBMC from a normal donor. Virus production was monitored by measuring HIV-1 p24 in culture supernatant by using an antigen capture assay (Perkin Elmer).
Co-receptor Usage and Syncytia Induction Assay
The co-receptor usages of virus isolates were determined by measuring their growth in U87.CD4 cells expressing either CXCR4 or CCR5 chemokine receptor as described previously18. Syncytia induction assay was performed in MT2 cells as described previously18, 19. Virus isolates were considered syncytia inducing if 2 out of 3 wells contained at least 3 syncytia for 2 out of the 3 days that the assay was performed. HIV-1 IIIB and HIV-1 BAL were used as syncytia positive and negative control virus, respectively.
Statistical Analyses
The measure of inter-rater agreement between the two assays was calculated as a kappa statistic with associated p-value for the test of the estimate being different from zero (i.e., agreement expected to be observed by chance).
The analysis of change in CD4 cell count over time utilized a linear regression model of observed CD4 cell counts versus time in years to produce an expected value of CD4 at study entry (i.e., y-intercept) and an expected average rate of change per year (i.e., slope). The model used repeated measures methods to correctly adjust standard error estimates to account for the correlation inherent among measurements collected repeatedly over time on the same subject(s). The analysis was repeated to include strata based on tertiles of entry CD4 cell count to demonstrate differences in rates of disease progression, if any, based level of disease severity at study entry.
The analysis of correlation between concurrent values of HIV RNA and CD4 cell count is presented in three ways (1) a scatter plot with Spearman’s correlation coefficient, (2) means of CD4 cell count for strata of HIV RNA levels, and (3) a regression estimate of the association. A Spearman correlation is a non-parametric measure analogous to Pearson’s correlation but without any distributional requirements for the data. The regression model, called a time dependent covariate model, again used methods to account for the repeated measures and return adjusted estimates of standard errors. It produced an estimate of the magnitude of change in CD4 cell count associated with a change in concurrent log 10 HIV RNA levels.
The final statistical analysis was conducted to estimate the predictive value of HIV RNA, measured at any time, on the subsequent percent change in CD4 cell count. The regression model was similar to the previously described time dependent covariate model with the exception that the outcome was not concurrent CD4 cell count but rather the difference between the subsequent CD4 and the concurrent CD4 divided by the concurrent CD4 (i.e., [(CD4i+1 – CD4i) / CD4i ]) to create subsequent percent change in CD4. As stated, repeated measures methods were used.
Since there were more HIV RNA measurements than CD4 cell counts among the subjects, simple linear interpolation was used to create (i.e., impute) a CD4 cell count to be “concurrent” for all HIV RNA measurements without one. If no subsequent CD4 cell counts were available for simple linear interpolation then the last observed CD4 cell count was used, thus creating a constant CD4 rate for that subject. The use of constant rate at the end for some subjects is a conservative approach to imputation and thus if any effect on the estimates occurs it would be to lessen the rate of decline as opposed to increase the rate of decline. Also, categories for HIV RNA were based on below or near lower limit of detection (<500 copies/ml) and the median value for remaining, detectable levels (500–50, 000 and >50,000, respectively).
Results
Development of a real time RT PCR to measure viral load in HIV-1-infected Indian subjects
Although HIV-1 in India is genetically different from other subtype C from Africa, Indian Subtype C HIV-1 isolated at different parts of India are closely related to each other9. This provides the rationale for using Indian consensus C sequence for designing primers and probes in the pol region. We determined the assay limit of detection by using a known copy number of in vitro transcribed target viral RNA. Figure 1 shows input response and threshold cycle profiles of the in vitro synthesized standard subtype C (pIndie C1) RNA of known copy numbers conducted in ten different experiments. The real-time RTPCR assay had a linear range of detection between 1× 10 2 to 1× 10 9 per input with a correlation coefficient of 0.99 between expected log copy number and observed threshold cycle values. The inter assay variation between 10 assays was very low as shown by low variation at each viral RNA input. The intra assay variation is within approximately 2 fold within the range of detection from 1× 10 2 to 1× 10 9 per input (data not shown).
Figure 1.
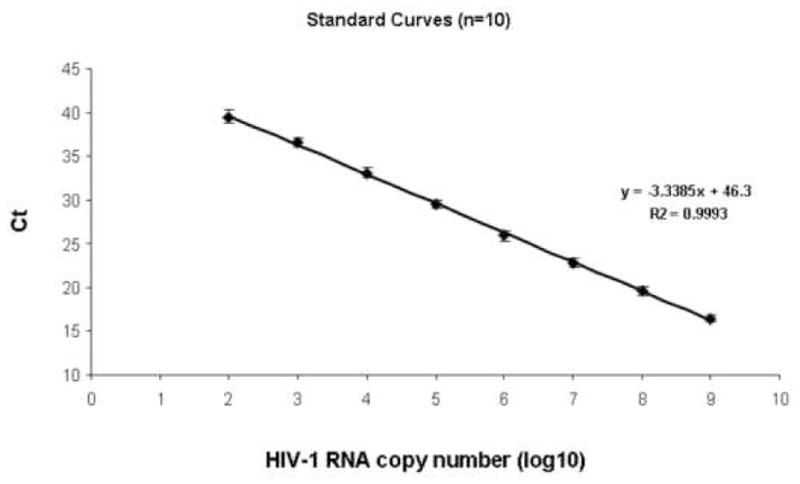
Input response and threshold cycle profiles of the in vitro synthesized standard subtype C (pIndie C1) HIV-1 RNA of known copy numbers.
The Realtime PCR assay was then compared with Roche Amplicor 1.5 HIV-1 RNA quantitation assays, in 40 plasma samples from HIV-1-infected Indian subjects with varying viral load (1000 to > 100,000 copies/ml). As shown in Figure 2, in plasma with low viral load (<400 to 1,000 copies /ml) the Realtime was comparable with Roche Amplicor 1.5 assay. However, in plasma samples with mid viral load (10,000 to 100, 000 copies/ml) and high viral load (>100,000 copies/ml), realtime showed higher level of viral load than Roche Amplicor 1.5 assay. A comparison between the two assays shown in Table 1, demonstrates that the two assays have 85% agreement (kappa = 0.54, p<.001).
Figure 2.
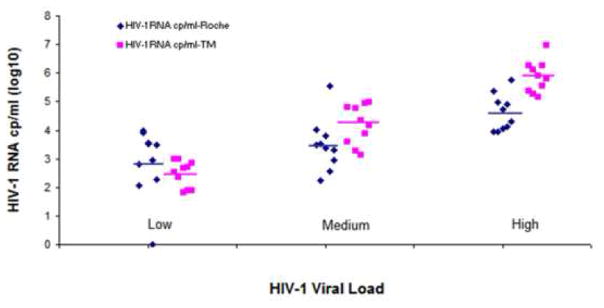
Comparison of realtime RTPCR and Roche Amplicor 1.5 assays for quantitating HIV-1 RNA in plasma from infected Indian subjects.
Table 1.
Comparison of Real Time RTPCR and Roche Amplicor 1.5 Assay
| TM
|
||||
|---|---|---|---|---|
| Roche | + | − | ||
| + | 29 | 5 | ||
| − | 1 | 5 | ||
| Toatal | 30 | 10 | ||
TM : Realtime RTPCR
The Realtime RTPCR was used to quantitate HIV-1 RNA in plasma from 39 HIV-1-infected subjects from India. As shown in Figure 3 the Realtime RTPCR detected HIV-1 RNA in plasma of all subjects of varying CD4 cell numbers. Plasma HIV-1 RNA levels were significantly higher in subjects with lower CD4 cell number (Spearman coefficient −0.55, p< 0.001)
Figure 3.
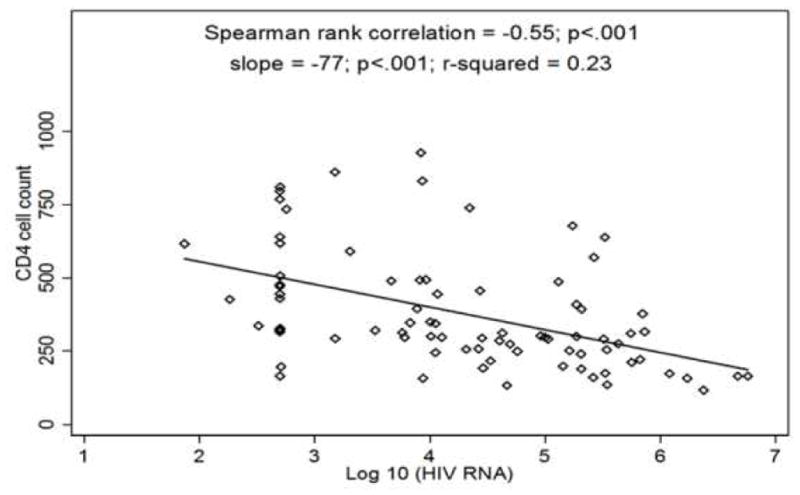
Quantitation of HIV-1 RNA from infected Indian subjects with varying CD4 cell number.
Disease progression as determined by the rate of CD4 cell count depletion
Thirty-nine subjects contributed 143 CD4 cell counts and 238 HIV-1 RNA level measurements over an average of 2.8 years (min=0.7, max=4.5) of follow-up. Table 2 presents the mean change in CD4 per year of follow up. For all subjects, the average rate of CD4 depletion was 97.1 cells per year (95% CI: −119.4, −74.8). It is shown that disease severity, based on baseline CD4 cell count, modified the effect of time on CD4 depletion whereby higher CD4 cell count at entry was associated with greater average rate of depletion (CD4<301, slope=−5.7; CD4 301–450, slope=−69.9; CD4>450, slope=− 127.9; p<.001). In measuring mean duration of disease development we used a decline in CD4 cell count as a surrogate marker for disease development. From Table 2, the estimated average time for a subject to progress from CD4 cell count=1000 to CD4 cell count=200 cells is approximately 8.2 years (95% CI: 6.7 to 10.7 years).
Table 2.
Mean change in CD4 cells for every subsequent year of observation as estimated from linear regression model with robust standard error estimates.
| Model | Number of individuals | Number of observations | Mean CD4 cells at 1st observed HIV RNA | Mean change in CD4cells for every subsequent year of observation |
|---|---|---|---|---|
| Crude | 39 | 143 | 527.3±47.2 | −97.1±11.4 (<.001) |
| Stratified by Baseline CD4 | ||||
| Less than 301 | 13 | 31 | 238.4±22.8 | −5.7±18.3 (0.754) |
| 301–450 | 13 | 51 | 457.4±28.7 | −69.6±10.6 (<.001) |
| Greater than 450 | 13 | 61 | 826.1±73.2 | −127.9±19.0 (<.001) |
Correlation of Viral Load and CD4
Figure 3 presents all concurrent CD4 cell counts and HIV RNA levels for all subjects. The Spearman correlation (r=−0.55, p<.001) showed a statistically significant negative association. Analysis of categorical HIV-1 RNA levels (<500 copies per ml, between 500 and 50,000 copies per ml, and >50,000 copies per ml) with concurrent CD4 cell counts demonstrated that average CD4 cell counts were higher for those observations of lower HIV RNA. We found an average of 482 cells for those with HIV-1 RNA<500 copies per ml, 411 cells for those with HIV-1 RNA levels between 500 and 50, 000 copies per ml, and 309 cells for those with HIV-1 RNA levels above 50,000 copies per ml. Lastly, using a linear regression model we found a one log increase in HIV-1 RNA level was associated with a 67 cell depletion in CD4 cell count (p<0.001).
Predictive value of viral load on the decline of CD4
Viral load has been shown to be predictive of disease progression in subtype B HIV-1-infected subjects from US and Western Europe. Therefore, we analyzed our longitudinal viral load data to determine whether the plasma viral load measurement can also be used in predicting disease development as determined by the decline in CD4 cell number. The analysis of HIV-1 RNA level as a predictor of disease progression as measured by subsequent percent change in CD4 cell count is displayed in Table 3. Person visits with HIV-1 RNA levels below 500 copies per ml were not shown to have a percent change in CD4 count per year different from zero (p=0.284). However, those visits with HIV-1 RNA level between 500 and 50,000 copies per ml were observed to have approximately 12.9% decrease in CD4 cell count per year (p=0.047) and HIV-1 RNA levels above 50,000 copies per ml had a 25.3% decrease in CD4 cells per year (p=0.002).
Table 3.
Analysis of updated HIV RNA levels as predictors for disease progression as measured by subsequent percent change in CD4 cell count per year. Average percent changes in CD4 cell count per year are presented with 95% confidence intervals (CI).
| HIV RNA level (copies/ml) | Total cohort | Restricted cohort* | ||
|---|---|---|---|---|
|
| ||||
| Number of observations | Average subsequent percent change in CD4 cell count per year (95% CI) | Number of observations | Average subsequent percent change in CD4 cell count per year (95% CI) | |
| < 500 | 47 | −22.0 (−56.0, 12.0) | 34 | −0.4 (−14.7, 14.0) |
| 500 – 50,000 | 75 | −12.9 (−25.6, −0.2) | 74 | −14.0 (−26.6, −1.4) |
| >50,000 | 76 | −25.3 (−41.4, −9.1) | 76 | −25.6 (−41.6, −9.6) |
Three persons removed to identify influence on point estimates
Since the point estimate for the lowest HIV-1 RNA level group was high we investigated the presence of outliers. We identified three persons with consistently low HIV-1 RNA (all but one observation below 500 copies per ml) and large concurrent decreases in CD4 cell count over length of follow up. As a post hoc analysis we re-analyzed the previous association without these three subjects. We found the inference from the full analysis doesn’t change (i.e., not different from zero, because 95% CI includes zero) but the point estimate for HIV-1 RNA level less than 500 copies per ml dropped from −22.0 to −0.4.
Characterization of Virus isolates from Indian Subjects
HIV-1 was isolated from PBMC of 29 out of 39 (74%) subjects at varying stages of the disease. Majority of HIV-1 was isolated from subjects with CD4 less than 400. All viruses, except one have been classified as subtype C as determined by a heteroduplex mobility assay (HMA) kit obtained through the NIH repository 5, 20. One non-subtype C has been characterized as subtype A and is of R5 tropic. As shown in Table 4 all subtype C viruses showed CCR5 tropism and showed non-syncytia inducing phenotypes regardless whether they are isolated from subjects with high or low viral load, and with high or low CD4, even from patients with CD4 below 200.
Table 4.
Characteristics of HIV-1 Isolates from Infected Indian Subjects
| Number of Isolates | CD4 Cell Number | Viral Load Range (Mean) | Co-Receptor Usage | Syncytia Inducing |
|---|---|---|---|---|
| 7 | <200 | 93,210–9,294,700 (1,676,095) | CCR5 | NSI |
| 24 | 200–400 | 5,760–1,760,118 (198,687) | CCR5 | NSI |
| 8 | 401–799 | 500–328,231 (104,757) | CCR5 | NSI |
| 4 | >=800 | 500–4,708 (1,798) | CCR5 | NSI |
Discussion
Viral load measurements are becoming a routine tool for the pathogenesis study as well as monitoring the efficacy of antiviral therapy. Unfortunately, most of the current commercial HIV-1 RNA assays are not optimized for quantifying subtype C in India and are too expensive to use in developing countries, like India21–23. Therefore, it is important to develop a relatively inexpensive assay which can reliably quantify plasma HIV-1 RNA level in HIV-1-infected Indian subjects. This report describes a quantitative Realtime RTPCR assay to measure viral load in plasma of HIV-1- infected subjects from India. Starting with 200 ul plasma the assay has a linear range of detection from 200 copies/ml to 109 copies per input. The intraassay variation is approximately 2 fold which is similar to that reported for Roche Amplicor 1.5 assay (Amplicor assay insert report). Inter assay variation is also very low. In forty plasma samples with varying viral load from HIV -1-infected subjects that we tested, the realtime assay either showed similar or higher viral load than the Roche Amplicor 1.5 assay. Thus the realtime assay has the similar sensitivity as the Roche Amplicor 1.5 assay, except in samples with less 200 copies/ml. However, the detection limit in the realtime assay can be lowered to less than 50 copies/ml, if one starts with 1.0 ml of plasma in the realtime RTPCR assay. The cost of the realtime assay is approximately $12.00 per test which is much lower than $ 60-$120 per test for a commercial HIV-1 RNA assay, and is therefore highly suitable for India. Recently a similar real time RTPCR assay has been reported for Indian subtype C virus24.
The relationship between viral load and disease progression has important implications for therapeutic intervention and clinical care. In a number of landmark publication Mellors et al 12, 13 have shown that disease progression is directly related to viral load and viral load could be a predictor of disease development. We, therefore, used the Realtime RTPCR to evaluate the role of viral load on the disease progression as defined by the decline in CD4. Our analysis of viral load in the longitudinal seroprevalent samples of 39 subjects that have been followed for an average of 33 months indicates a significant association of viral load increase with the depletion of CD4 cell number. We found that one log increase in HIV-1 RNA level was associated with a decline of 67 CD4 cell count. This is different than that was reported by Mehendale et al15 during the acute phase of infection in an Indian cohort. They reported an annual median increase of 8,274 RNA copies/ml with an annual median decrease of CD4 cell number of 120. Higher viral load increase and different decline in CD4 cell number is in the report by Mehendale is probably due to measurements done during acute phase, and therefore cannot be interpolated during the chronic stages of the disease, like that of our group. We next extended our analysis to determine whether the HIV-1 RNA level could be used as a predictor of subsequent percent change in CD4 cell count. Our analysis indicates that HIV-1 RNA above 500 copies/ml has two kinds of distinct but significant predictive values of future decline in CD4 cell number. At visits with HIV-1 RNA level between 500 and 50,000 copies per ml there were 12.9% decrease in CD4 cell count per year, whereas at visits with HIV-1 RNA levels above 50,000 copies per ml a 25.3% decrease in CD4 cells per year was noticed. At visits with viral load less than 500, the predictive value of viral load is not significant.
The evaluation of HIV RNA levels as predictive marker of CD4 cell count depletion (Table 3) showed the level of RNA was not strongly associated with subsequent change in CD4 cell count using repeated values of both markers across follow-up. This result has been described in a similar manner by Rodriguez et al 18 who showed a small negative association between the markers. We presented the information differently with regards to method of analysis by using percent change in CD4 as opposed to simple difference and we categorized levels of HIV RNA into three groups for hopefully a clearer presentation and understanding. In a post hoc analysis removing three unusual subjects we did see a trend in the direction of a negative association, however our primary analysis did not show such a trend.
From the longitudinal analysis of the CD4 in our seroprevalent group over the same period we estimated that mean period of disease development, as defined by the loss of CD4 below 200, is 8.2 years which is slightly lower than the approximate 10 years estimated from the HIV-1 seroconverters in the Multicenter AIDS Cohort Study at US16. In addition, we calculated an overall loss of 97 cells per year which is slightly lower than an annual loss 120 CD4 cells/year reported in HIV-1 seroconverters from Pune in India, but is similar to a loss of 89 cells/year reported in US seroconverters who progressed to AIDS within 3–7 years. Our estimated mean period of disease development of 8.2 years is similar to 7.6 and 7.9 years reported by two previous studies at Mumbai using the Weibull method25. Given the sero-prevalent nature of our group, we needed to use the average time for 800 cell depletion to estimate the duration period of diseae progression. To that end, we used a linear regression model that accounted for repeated measures within each subject to calculate an average rate of CD4 depletion. As a result our estimation of the incubation period of HIV-1 is different in nature of the estimate than the previously mentioned studies. The slight difference of CD4 cell loss and incubation period between Indian subjects and those in US subjects reported by MACS could be due to genetic differences in immunity among these two subpopulations. The differences in incubation period could also be due to resources and socioeconomic conditions among these groups. Lower socioeconomic status and limited access to care have been associated with poor survival of HIV-1-infected subjects around the world 26, 27.
Although a number of genetic analysis of HIV-1 isolates from India have been reported4–10, there is only one report about the phenotypic analysis of HIV-1 isolates from India11. Our report with 29 isolates obtained from subjects with varying viral load (more than 9 million to as low as 500 copies per ml) and with CD4 cell number as high as 800 and as low as less than 200 extends the previous finding 11 and confirms that that Indian HIV-1s are of CCR5 tropic and of NSI type regardless when they are isolated during the progression of the disease. These results suggest that a shift from R5 to X4 tropism, a hallmark of disease development in subtype B infected subjects from US and Western Europe may not occur in subtype C infected subjects from India.
Two years ago the Indian government has launched a limited antiretroviral therapy program for HIV-1 infected subjects. With decreasing drug prices and less number of medications that one has to take, future drug therapy is expected to be available for all HIV-1-infected subjects in India. As therapy becomes more available to infected subjects, monitoring the patients for viral load will be extremely important because of potential emergence of drug resistant HIV-1 variants. Therefore, availability of an inexpensive real time RTPCR assay as described in this report will be extremely useful for a physician to use it as a standard test for treating HIV-1-infected subjects. Finally, important issues are arising about when to initiate antiretroviral therapy, because it will depend on the patients’ predictive course of disease progression. Viral load and CD4 cell number have been used to stage the HIV-1 disease12, 13. Our report on the predictive power of the viral load on CD4 decline in Indian subjects will provide an additional important tool to physicians for treating and planning therapeutic strategies to control potential explosive HIV-1 epidemics in India.
Acknowledgments
We thank Dr. Raj Shankrappa for helpful discussion in designing the primers for amplification, Mary White and Kathy Kulka for their technical assistance. This work has been supported by AIDS-FIRCA grant R03 TH0091 and R21 AI065392A. MR is supported by a minority supplement to the grant A151661 (Sharon Hillier)
References
- 1.Bollinger RC, Tripathy SP, Quinn TC. The human immunodeficiency virus epidemic in India. Current magnitude and future projections. Medicine (Baltimore) 1995;74(2):97–106. doi: 10.1097/00005792-199503000-00005. [DOI] [PubMed] [Google Scholar]
- 2.Gupta P, Kingsley L, Sheppard HW, et al. High incidence and prevalence of HIV-1 infection in high risk population in Calcutta, India. Int J STD AIDS. 2003;14(7):463–468. doi: 10.1258/095646203322025768. [DOI] [PubMed] [Google Scholar]
- 3.Mehendale SM, Rodrigues JJ, Brookmeyer RS, et al. Incidence and predictors of human immunodeficiency virus type 1 seroconversion in patients attending sexually transmitted disease clinics in India. J Infect Dis. 1995;172(6):1486–1491. doi: 10.1093/infdis/172.6.1486. [DOI] [PubMed] [Google Scholar]
- 4.Baskar PV, Ray SC, Rao R, Quinn TC, Hildreth JE, Bollinger RC. Presence in India of HIV type 1 similar to North American strains. AIDS Res Hum Retroviruses. 1994;10(8):1039–1041. doi: 10.1089/aid.1994.10.1039. [DOI] [PubMed] [Google Scholar]
- 5.Delwart EL, Shpaer EG, Louwagie J, et al. Genetic relationships determined by a DNA heteroduplex mobility assay: analysis of HIV-1 env genes. Science. 1993;262(5137):1257–1261. doi: 10.1126/science.8235655. [DOI] [PubMed] [Google Scholar]
- 6.Jameel S, Zafrullah M, Ahmad M, Kapoor GS, Sehgal S. A genetic analysis of HIV-1 from Punjab, India reveals the presence of multiple variants. Aids. 1995;9(7):685–690. doi: 10.1097/00002030-199507000-00003. [DOI] [PubMed] [Google Scholar]
- 7.Maitra A, Singh B, Banu S, et al. Subtypes of HIV type 1 circulating in India: partial envelope sequences. AIDS Res Hum Retroviruses. 1999;15(10):941–944. doi: 10.1089/088922299310656. [DOI] [PubMed] [Google Scholar]
- 8.Sengupta S, Jana S, Sarkar K, Bhattacharya SK, Chakrabarti S. Determination of gag subtypes of HIV type 1 detected among female sex workers in Calcutta, India. AIDS Res Hum Retroviruses. 2005;21(9):806–809. doi: 10.1089/aid.2005.21.806. [DOI] [PubMed] [Google Scholar]
- 9.Shankarappa R, Chatterjee R, Learn GH, et al. Human immunodeficiency virus type 1 env sequences from Calcutta in eastern India: identification of features that distinguish subtype C sequences in India from other subtype C sequences. J Virol. 2001;75(21):10479–10487. doi: 10.1128/JVI.75.21.10479-10487.2001. [DOI] [PMC free article] [PubMed] [Google Scholar]
- 10.Tripathy S, Renjifo B, Wang WK, et al. Envelope glycoprotein 120 sequences of primary HIV type 1 isolates from Pune and New Delhi, India. AIDS Res Hum Retroviruses. 1996;12(12):1199–1202. doi: 10.1089/aid.1996.12.1199. [DOI] [PubMed] [Google Scholar]
- 11.Cecilia D, Kulkarni SS, Tripathy SP, Gangakhedkar RR, Paranjape RS, Gadkari DA. Absence of coreceptor switch with disease progression in human immunodeficiency virus infections in India. Virology. 2000;271(2):253–258. doi: 10.1006/viro.2000.0297. [DOI] [PubMed] [Google Scholar]
- 12.Mellors JW, Munoz A, Giorgi JV, et al. Plasma viral load and CD4+ lymphocytes as prognostic markers of HIV-1 infection. Ann Intern Med. 1997;126(12):946–954. doi: 10.7326/0003-4819-126-12-199706150-00003. [DOI] [PubMed] [Google Scholar]
- 13.Mellors JW, Rinaldo CR, Jr, Gupta P, White RM, Todd JA, Kingsley LA. Prognosis in HIV-1 infection predicted by the quantity of virus in plasma. Science. 1996;272(5265):1167–1170. doi: 10.1126/science.272.5265.1167. [DOI] [PubMed] [Google Scholar]
- 14.Vlahov D, Graham N, Hoover D, et al. Prognostic indicators for AIDS and infectious disease death in HIV-infected injection drug users: plasma viral load and CD4+ cell count. Jama. 1998;279(1):35–40. doi: 10.1001/jama.279.1.35. [DOI] [PubMed] [Google Scholar]
- 15.Mehendale SM, Bollinger RC, Kulkarni SS, et al. Rapid disease progression in human immunodeficiency virus type 1-infected seroconverters in India. AIDS Res Hum Retroviruses. 2002;18(16):1175–1179. doi: 10.1089/08892220260387913. [DOI] [PubMed] [Google Scholar]
- 16.Lyles RH, Munoz A, Yamashita TE, et al. Natural history of human immunodeficiency virus type 1 viremia after seroconversion and proximal to AIDS in a large cohort of homosexual men. Multicenter AIDS Cohort Study. J Infect Dis. 2000;181(3):872–880. doi: 10.1086/315339. [DOI] [PubMed] [Google Scholar]
- 17.Mochizuki N, Otsuka N, Matsuo K, et al. An infectious DNA clone of HIV type 1 subtype C. AIDS Res Hum Retroviruses. 1999 Sep 20;15(14):1321–1324. doi: 10.1089/088922299310223. [DOI] [PubMed] [Google Scholar]
- 18.Rodriguez MA, Chen Y, Craigo JK, et al. Construction and characterization of an infectious molecular clone of HIV-1 subtype A of Indian origin. Virology. 2006;345(2):328–336. doi: 10.1016/j.virol.2005.09.053. [DOI] [PubMed] [Google Scholar]
- 19.O’Marro SD, Armstrong JA, Asuncion C, Gueverra L, Ho M. The effect of combinations of ampligen and zidovudine or dideoxyinosine against human immunodeficiency viruses in vitro. Antiviral Res. 1992;17(2):169–177. doi: 10.1016/0166-3542(92)90050-f. [DOI] [PubMed] [Google Scholar]
- 20.Bachmann MH, Delwart EL, Shpaer EG, Lingenfelter P, Singal R, Mullins JI. Rapid genetic characterization of HIV type 1 strains from four World Health Organization-sponsored vaccine evaluation sites using a heteroduplex mobility assay. WHO Network for HIV Isolation and Characterization. AIDS Res Hum Retroviruses. 1994;10(11):1345–1353. doi: 10.1089/aid.1994.10.1345. [DOI] [PubMed] [Google Scholar]
- 21.Gottesman BS, Grosman Z, Lorber M, et al. Measurement of HIV RNA in patients infected by subtype C by assays optimized for subtype B results in an underestimation of the viral load. J Med Virol. 2004;73(2):167–171. doi: 10.1002/jmv.20071. [DOI] [PubMed] [Google Scholar]
- 22.Calmy A, Pascual F, Ford N. HIV drug resistance. N Engl J Med. 2004;350(26):2720–2721. doi: 10.1056/NEJM200406243502621. [DOI] [PubMed] [Google Scholar]
- 23.Katzenstein D, Laga M, Moatti JP. The evaluation of the HIV/AIDS drug access initiatives in Cote d’Ivoire, Senegal and Uganda: how access to antiretroviral treatment can become feasible in Africa. Aids. 2003;17 (Suppl 3):S1–4. [PubMed] [Google Scholar]
- 24.Kamat A, Ravi V, Desai A, et al. Quantitation of HIV-1 RNA levels in plasma and CSF of asymptomatic HIV-1 infected patients from South India using a TaqMan real time PCR assay. J Clin Virol. 2007;39(1):9–15. doi: 10.1016/j.jcv.2006.12.026. [DOI] [PubMed] [Google Scholar]
- 25.Hira SK, Shroff HJ, Lanjewar DN, Dholkia YN, Bhatia VP, Dupont HL. The natural history of human immunodeficiency virus infection among adults in Mumbai. Natl Med J India. 2003;16(3):126–131. [PubMed] [Google Scholar]
- 26.Del Amo J, Petruckevitch A, Phillips A, et al. Disease progression and survival in HIV-1-infected Africans in London. Aids. 1998;12(10):1203–1209. doi: 10.1097/00002030-199810000-00013. [DOI] [PubMed] [Google Scholar]
- 27.Hogg RS, Strathdee SA, Craib KJ, O’Shaughnessy MV, Montaner JS, Schechter MT. Lower socioeconomic status and shorter survival following HIV infection. Lancet. 1994;344(8930):1120–1124. doi: 10.1016/s0140-6736(94)90631-9. [DOI] [PubMed] [Google Scholar]