

Abstract
Background
Clinical prediction models (CPMs) estimate the probability of clinical outcomes and hold the potential to improve decision making and individualize care. For patients with cardiovascular disease (CVD) there are numerous CPMs available though the extent of this literature is not well described.
Methods and Results
We conducted a systematic review for articles containing CPMs for CVD published between January 1990 through May 2012. CVD includes coronary heart disease (CHD), heart failure (HF), arrhythmias, stroke, venous thromboembolism (VTE) and peripheral vascular disease (PVD). We created a novel database and characterized CPMs based on the stage of development, population under study, performance, covariates, and predicted outcomes. There are 796 models included in this database. The number of CPMs published each year is increasing steadily over time. 717 (90%) are de novo CPMs, 21 (3%) are CPM recalibrations, and 58 (7%) are CPM adaptations. This database contains CPMs for 31 index conditions including 215 CPMs for patients with CAD, 168 CPMs for population samples, and 79 models for patients with HF. There are 77 distinct index/ outcome (I/O) pairings. Of the de novo models in this database 450 (63%) report a c-statistic and 259 (36%) report some information on calibration.
Conclusions
There is an abundance of CPMs available for a wide assortment of CVD conditions, with substantial redundancy in the literature. The comparative performance of these models, the consistency of effects and risk estimates across models and the actual and potential clinical impact of this body of literature is poorly understood.
Keywords: prediction, cardiovascular disease risk factors, cerebrovascular disease/stroke, modeling, prognostic factor
Clinical predictive models (CPMs) use multiple patient characteristics to estimate the probability of important outcomes over a given period of time (prognostic models), or the probability of a specific diagnosis (diagnostic models). By providing these probabilities, they enable clinicians to ‘personalize’ medical decisions for individual patients.1
While the potential importance of making decisions more “patient centered” is broadly recognized, implementation of predictive models in clinical practice has remained meager, even while CPM development has been robust.1 Despite many attempts, application is limited by poor statistical performance with respect to discrimination and (especially) calibration on new populations; examples where no clear decision is influenced by the CPM output (or performance poorly fit to the appropriate decision threshold); limits related to usability; and the inability to incorporate a dynamic set of clinical variables.2–5 Several developments in health care, however, may create a more favorable environment for the dissemination and application of CPMs, such that these tools may play an increasingly important role in health care decision making over the next decade. These include (but are not limited to): an increasing appreciation of the limitations of using group-derived averages for informing practice guidelines for the care of individuals; recent efforts to formalize methodological and reporting principles for prediction models6,7; the investment of more resources in patient-centered outcomes research (particularly through PCORI), the methodological emphasis of PCORI on heterogeneity of treatment effect (HTE)8,9; and the incorporation of risk models within some evidence based guidelines.10–13
To better understand the extent of CPM development and to help researchers in this emerging field, we performed a systematic review and field synopsis to describe the CPMs that predict measures of morbidity and mortality for patients at risk for and with known cardiovascular disease (CVD). Here we describe the Tufts Predictive Analytics and Comparative Effectiveness (PACE) CPM database.
Methods
Study Search and Selection
Our search was designed to capture CPMs developed using data from contemporary cohorts of patients. We performed a PubMed search for English-language articles containing CPMs for CVD published from January 1990 through May 2012. To supplement this search we reviewed reference lists of published reports using an iterative process to ensure completeness of the database (Figure 1). CVD include coronary heart disease (CHD), heart failure (HF), arrhythmias, stroke, venous thromboemobolism (VTE) and peripheral vascular disease (PVD). To construct a comprehensive set of search terms we generated a list of MeSH terms with the input of experienced methodologists (Appendix).
Figure 1.

PubMed was searched for relevant articles from 1990 to 2012.
For this registry, a CPM is defined as a model that provides a method to calculate or categorize an individual patient’s absolute risk for a binary outcome. We include articles that describe newly developed CPMs that predict the risk of developing an outcome (prognostic models) or the probability of a specific diagnosis (diagnostic models). We include articles describing CPMs of patients at risk for developing incident CVD and also CPMs for patients with known CVD that predict the likelihood of developing a binary outcome (e.g. MI, stroke, death, or composite endpoint). Articles met the following inclusion criteria: (1) the primary aim was to develop a CPM as indicated in an objective statement; (2) the model predicts binary clinical endpoints; (3) the model contains at least two independent (i.e. predictor) variables, and (4) the model provides a way of calculating a probability for an individual patient. Articles were excluded if they did not provide enough information to estimate a patient’s risk, reported models predicting surrogate outcomes, or reported models derived from pediatric or adolescent populations. Articles with the primary aim to validate, update, or compare already established models without an effort to develop and report a new model were excluded. The recalibration models included in this database include only those presented as part of articles with the primary goal of reporting a de novo model. We also excluded pharmacology reports, cost-effectiveness models, decision-analysis models, non-English reports, models evaluating a biomarker or surrogate outcome, narrative and systematic reviews, and editorials.
Data extraction
Typically, models in the form of online calculators, nomograms, simplified equations or point scores met our inclusion criterion. We placed CPMs into one of the following stages of development 1) de novo, 2) recalibration, or 3) adaptation CPM (Table 1).14De novo CPMs are defined as newly derived CPMs that report a method to calculate an individual’s absolute risk for a binary outcome. Recalibration CPMs report previously described models with a revised intercept or slope to better fit a new population. While some authors have included less conservative approaches as model updates, we classified models with re-estimated β-coefficients or the addition of new predictor variables to a previously developed CPM as de novo CPMs. Adaptation CPMs are reports of previously described CPMs revised to predict a different outcome—ie the prior risk equation is evaluated to predict an outcome for which it was not originally developed. CPMs stratified on the basis of sex were reported separately for this analysis.
Table 1.
Model Classification and Discrimination
| Model Stage | Description | N | C-statistic (median) |
25th to 75th
% |
|---|---|---|---|---|
| Newly developed model | ||||
| De novo | Previously developed model + extension with additional predictors (re-estimated covariates) |
450 | 0.78 | 0.73 to 0.82 |
| Recalibration | Previously developed model with a change of intercept and or slope |
21 | 0.78 | 0.74 to 0.79 |
| Adaptation | Previously developed model used to calculate probability of an alternative outcome |
58 | 0.81 | 0.77 to 0.84 |
Classification of Model Stage for the Tufts CPM Database. This framework is an adaptation of the classification scheme presented by Steyerberg.14 N is the number of models that report a C-statistic for each stage. The median C-statistic for each stage of development is noted along with the interquartile range (25% to 75th%).
We extracted CPM information and entered data directly into a newly developed database using Microsoft Access 2007. Blinded double extractions of CPM stage of development were performed for all included articles to ensure consistency of extracted data; discrepancies were discussed to arrive at a consensus. Full blinded double extractions were done of a random 10% sample of articles as a quality check. For each model, we extracted: author names and affiliations, year of publication, journal name, study design, methods for model development, sample size, enrollment period, and information on the patient population and the predicted outcomes. Study design was categorized as either observational studies (cohort, case-control, cross sectional, surveys, claims data) or experimental studies (RCTs). Methods for model derivation were characterized. Populations were grouped based on index condition. Populations ‘at risk’ for developing incident CVD were classified with the index condition of ‘population sample’. Outcomes were categorized as mortality, morbidity, or morbidity and mortality. The latter two groupings most often represented composite outcomes. The follow up period was categorized as short (< 3 months), moderate (≥3 to < 6 months), or long (≥ 6 months). We identified covariates and extracted beta coefficients, hazard ratios, odds ratios, relative risk ratios, p-values, and intercepts.
Assessment of model performance
CPM performance is frequently evaluated through measures of discrimination and calibration.15 Discrimination represents how effectively a CPM can separate those who develop the outcome of interest from those who do not, while calibration measures how well predicted probabilities match observed probabilities. For each model, we characterized measures of discrimination (areas under the curve (AUC), equivalent to c-statistic for logistic regression models) as well as calibration performance (e.g. calibration plot and Hosmer-Lemeshow statistic).16,17
Results
Model descriptions
We identified 506 articles describing 796 CPMs (Figure 1). For the quality check, blinded double extractions for model designation demonstrated excellent agreement (κ = 0.90). At the article level there was 97% agreement for identification of both a C-statistic and presence or absence of a calibration plot. Of the CPMs included in this database 717 (90.1%) are de novo CPMs, 21 (2.6%) are recalibration CPMs, and 58 (7.3%) are adaptation CPMs. During the time period 1990 to 2012 the number of articles reporting CPMs published each year has increased steadily over time (Figure 2). There are only 3 models from 1990 included in this database while in 2011, 53 models were published. This represents a 17-fold increase in the number of models for CVD published annually over this time period. CPMs for CVD are published in a wide variety of journals and most commonly published in specialty journals (Table 2). Circulation published 42 (8.3%) and Journal of American College of Cardiology published 31 (6.1%) of the articles included in this database. CPMs were most likely to be published using United States health care data (35.5%). The next most common data sources were British (5.3%) and Canadian (4.5%) health care data.
Figure 2.

Cumulative growth in published CPM articles included in the Tufts CPM database over time. Our search ended in May 2012.
Table 2.
Journals Ranked by number of CPMs Published 1990-2012
| Journal Title | N | Rank |
|---|---|---|
| Circulation | 42 | 1 |
| Journal of the American College of Cardiology | 31 | 2 |
| American Journal of Cardiology | 24 | 3 |
| Stroke | 23 | 4 |
| European Heart Journal | 19 | 5 |
| American Heart Journal | 16 | 6 |
| Annals of Thoracic Surgery | 14 | 7 |
| Journal of American Medical Association | 14 | 8 |
| European Journal of Cardiothoracic Surgery | 9 | 9 |
| Heart | 8 | 10 |
| Journal of Vascular Surgery | 8 | 10 |
| Misc | 298 | |
| Total | 506 |
Journals ranked according to number of published CPM articles from 1990- May 2012. Misc includes all other journals publishing CPM reports. CPM clinical predictive model
CPMs exist for a wide spectrum of cardiovascular diseases. There are 31 index conditions represented in this database and 77 distinct index condition/ outcome pairings. The 10 most frequently studied index conditions are shown in Figure 3. There are 215 CPMs for patients with known coronary artery disease (CAD) followed by 168 CPM for population samples and 79 models for HF. For the entire database sample sizes ranged from 17 patients for a CPM predicting mortality in patients with aortic diseases18 to 2.8 million patients for a CPM predicting morbidity of a population sample.19 Mean age ranged from 27 to 88 years old. Length of follow up ranged from less than one week to 28 years.20 Models were roughly evenly split between those predicting short term outcomes (< 3 months) and those predicting long term outcome (> 6 months). There are 41 diagnostic CPMs included in this database, most commonly predicting diagnoses of CAD (11 models), venous thromboembolic disease (10 models), and acute coronary syndrome (5 models).
Figure 3.
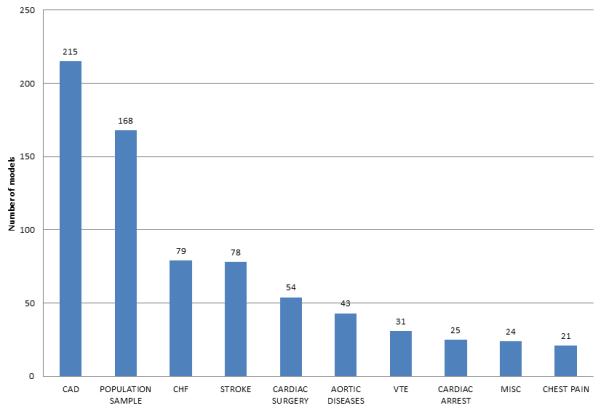
Total CPM count (de novo, adaptation, and recalibration stages) by index condition in the Tufts PACE CPM database. CAD indicates coronary artery disease, CHF indicates congestive heart failure, VTE indicates venous thromboembolism, misc indicates a variety of other index conditions no otherwise characterized. CPM clinical prediction model, CAD coronary artery disease, CHF congestive heart failure, VTE venous thromboembolism.
CPMs were derived from a variety of data sources. 321 of the articles (63%) derived CPMs from cohort studies, 98 (19%) used registry data and 49 (10%) used RCT data. All studies reported a point score, equation, decision tree, nomogram or online calculator that could be used to calculate risk (since this was an inclusion criteria for the database). 399 (50%) of models reported their beta coefficients. The most commonly predicted outcome was mortality (37%) followed by the outcome classifications of morbidity (32%) and composite outcomes representing morbidity and mortality (27%).
The de novo CPMs provide an opportunity to evaluate newly developed models. 421 (58%) of the de novo CPMs were derived using logistic regression methods and 246 (34%) were created using Cox regression. The remainder of the de novo CPMs in this database were created using a variety of other statistical techniques (Table 3). De novo CPMs predicting mortality were most commonly published for patients with known CAD (98 models) followed by HF (63 models) and stroke (24 models) (Table 4). CPMs predicting composite outcomes representing morbidity and mortality were most frequently developed for population samples (68 models) followed by patients with CAD (43 models) and stroke (13 models) (Table 5). For the 10 I/O pairings most frequently studied, 84 (17%) did not report the number of events in the derivation cohort (Table 6). For the de novo CPMs that did report the number of events, there was a wide range of events per variable (EPV).
Table 3.
Methods used to derive De novo Clinical Predictive Models
| De novo CPMs | Total |
|---|---|
|
| |
| Logistic regression | 421 |
| Cox regression | 246 |
| Weibull accelerated failure time model | 17 |
| Classification and regression tree analysis | 15 |
| Others | 15 |
|
| |
| Total | 714 |
Methods used to derive de novo models as reported by the authors. 3 de novo CPMs included in this database did not describe the methods used. Other methods include ensemble classification using machine learning, discriminant analysis, cluster algorithms, clinical judgement/ consensus, neural network, and poisson regression techniques.
Table 4.
De novo Prognosis Models with Mortality as Outcome
| Index condition | N | Short time frame |
Moderate time frame |
Long time frame |
Published Date range |
|---|---|---|---|---|---|
| Coronary artery disease | 98 | 58 | 7 | 33 | 1990-2012 |
| CHF | 62 | 17 | 3 | 42 | 1992-2012 |
| Stroke | 27 | 16 | 5 | 6 | 1991-2011 |
| Cardiac Surgery | 24 | 24 | 0 | 0 | 1995-2011 |
| Aortic diseases | 19 | 15 | 1 | 3 | 1994-2011 |
| Population Sample | 15 | 0 | 0 | 15 | 1991-2009 |
| Cardiac Arrest | 5 | 3 | 1 | 1 | 1991-2011 |
| VTE | 4 | 4 | 0 | 0 | 2005-2009 |
| Chest pain | 3 | 1 | 0 | 2 | 1991-2000 |
| Miscellaneous | 4 | 1 | 0 | 3 | 2002-2011 |
De novo Prognosis Models with Mortality as Outcome. Top 10 index conditions are included. N indicates total count of models, outcomes are predicted over short time frame (< 3 months), moderate time frame (3- 6 months), long time frame (> 6 months). CHF congestive heart failure, VTE venous thromboembolism. Miscellaneous represents a variety of other conditions.
Table 5.
De novo Prognosis Models with Composite Outcome (Morbidity and Mortality)
| Index condition | N | Short time frame |
Moderate time frame |
Long time frame |
Published Date range |
|---|---|---|---|---|---|
| Population Sample | 66 | 0 | 0 | 66 | 1991-2012 |
| Coronary artery disease | 44 | 28 | 1 | 15 | 1991-2012 |
| Stroke | 35 | 14 | 12 | 9 | 1991-2011 |
| CHF | 8 | 2 | 0 | 6 | 1996-2012 |
| Miscellaneous | 8 | 7 | 0 | 1 | 1999-2011 |
| Carotid disease | 7 | 6 | 0 | 1 | 2001-2012 |
| VTE | 7 | 4 | 1 | 2 | 1991-2011 |
| Chest pain | 6 | 2 | 1 | 3 | 1997-2010 |
| PVD | 4 | 4 | 0 | 0 | 1996-2010 |
| Pregnancy | 3 | 2 | 0 | 1 | 1997-2010 |
De novo Prognosis Models predicting probability of a composite outcome. Top 10 index conditions are included. N indicates total count of models, outcomes are predicted over short timeframe (< 3 months), moderate timeframe (3- 6 months), long timeframe (> 6 months). CHF congestive heart failure, VTE venous thromboembolism, PVD peripheral vascular disease, Miscellaneous represents a variety of other conditions.
Table 6.
Index condition/ Outcome (I/O) Pairings of De novo Models
| Index/ Outcome pairing | Models reporting events (N) |
median # of variables/ model* |
IQR variables/ model |
median # of events/ model |
IQR events/model |
median model #events/ variable (EPV) |
IQR EPV |
|---|---|---|---|---|---|---|---|
| CAD and Mortality | 78 | 11 | 7-17 | 217 | 120-562 | 20 | 17-33 |
| Population Sample and Morbidity and Mortality |
52 | 8 | 6-11 | 234 | 137-546 | 29 | 23-49 |
| CHF and Mortality | 49 | 8 | 6-10 | 132 | 75-267 | 17 | 13-27 |
| CAD and Morbidity | 47 | 9 | 7-16 | 254 | 115-461 | 28 | 16-30 |
| Population Sample and Morbidity | 45 | 7 | 6-10 | 240 | 152-457 | 34 | 25-46 |
| CAD and Morbidity and Mortality | 35 | 6 | 5-11 | 101 | 60-226 | 17 | 12-22 |
| Stroke and Morbidity and Mortality | 33 | 7 | 5-8 | 118 | 51-187 | 17 | 10-23 |
| Stroke and Mortality | 26 | 6 | 4-11 | 70 | 42-169 | 12 | 11-15 |
| Cardiac Surgery and Mortality | 23 | 16 | 7-21 | 171 | 95-328 | 11 | 14-16 |
| Venous thromboembolism and morbidity | 20 | 7 | 5-10 | 131 | 65-194 | 19 | 13-20 |
Top 10 I/O pairings.
We report here variables included in the model (as opposed to candidate variables). CAD coronary artery disease, CHF congestive heart failure.
The most common covariates stratified based on I/O pairings are shown in Table 7. For 9 of the 10 pairings (all except VTE), age is among the most common variables used for risk prediction, while sex is among the most common in 7 of 10 of the pairings. Other common risk factors for developing atherosclerotic cardiovascular disease, such as diabetes and smoking status, are also frequently seen across multiple index conditions.
Table 7.
De novo Models: Most common Index Condition/ Outcome Pairings and Predictor variables
| Index/ Outcome pairing | N (models) | Most common covariate variables (top 5) |
|---|---|---|
| CAD and Mortality | 98 | EKG findings, Age, LVEF, DM, HR & Sex* |
| Population Sample and Morbidity and Mortality | 67 | HDL, Smoking, Age, DM, SBP |
| CHF and Mortality | 62 | BUN, Age, NHYA, HR, LVEF |
| Population Sample and Morbidity | 62 | Age, DM, Smoking, SBP, BMI |
| CAD and Morbidity | 51 | DM, Sex, Age, Smoking, EKG findings |
| CAD and Morbidity and Mortality | 44 | Age, EKG findings, DM, Sex, LVEF |
| Stroke and Morbidity and Mortality | 36 | Age, GCS score, NIHSS, Previous stroke, Sex |
| Stroke and Mortality | 27 | Age, NIHSS, GCS score, Intracerebral hemorrhage volume, Sex |
| Cardiac Surgery and Mortality | 24 | Age, Sex, Creatinine, LVEF, Endocarditis |
| Venous thromboembolism and morbidity | 20 | EKG findings, Cancer, Sex, Previous VTE, Alternative diagnosis |
De novo Models according to index condition/ outcome paring. CAD coronary artery disease, CHF congestive heart failure, LVEF left ventricular ejection fraction, DM diabetes mellitus, HDL high density lipoprotein, SBP systolic blood pressure, BUN blood urea nitrogen, GCS glascow coma scale, NIHSS National Institutes of Health Stroke Severity Scale, VTE venous thromboembolism.
HR and sex appear with the same frequency for CAD and Mortality CPMs
Model Performance Measures
Of the 717 de novo CPMs, 450 (63%) report a c-statistic. 280 (70.5%) of CPMs derived using logistic regression techniques report a c-statistic and 130 (55.3%) of the CPMs derived using Cox regression methods report a c-statistic.
259 (36%) of the de novo CPMs report either the Hosmer-Lemeshow statistic or show a calibration plot, 68 (26%) report both these measures of calibration.
Though this database focuses on articles with the primary goal of developing CPMs, 176 (22%) of the included CPMs describe an internal validation exercise (including testing on random and non-random subset of the same overall cohort) and 135 (17%) report validation on a population sample separate from the derivation sample. We identified 27 (3%) CPMs that present model to model comparisons.
Discussion
Here we describe the newly created Tufts Predictive Analytics and Comparative Effectiveness (PACE) Center CPM registry. Our database is the first broad systematic review and field synopsis of CPMs for CVD. The goals of this registry are 1) describe the growth and characteristics of published CPMs for CVD, 2) identify gaps in CPM development, 3) examine the changes in reporting following publication of reporting standards, and 4) create a resource for researchers in the emerging field of CPM creation, evaluation, and application. We document an abundance of CPMs for virtually every major disease category and most important clinical outcomes. The field of CPMs for CVD has grown rapidly; the number of new CPMs published annually has approximately doubled over each of the last two decades. Continued growth over the same trajectory would clearly produce an overwhelming number of models.
While the clinical emphasis of the CPMs identified in this database follows reasonably from the overall prevalence of the component diseases and models for ‘at risk’ populations hold promise to raise awareness and focus prevention towards at risk groups,17,21–23 there seems little justification for the abundance of CPMs. Our database shows that published CPMs for CVD have been incompletely evaluated. In many areas, there is already tremendous redundancy of predictive models (there are over 200 CPMs predicting clinical outcomes for patients with CAD and more than 160 models predicting incident CVD), with little apparent effort for independent comparison of extant models to provide guidance on which models work best in which context. A recent systematic review found 20 studies examining the comparative performance of population based CVD prognostic models, but emphasized the limitations of this literature.24 Thus, substantial work is needed to understand how these competing CPMs compare and how they can best be applied to individualize care. We agree with prior calls for comparative studies carried out in independent samples, ideally by investigators independent from those who proposed or developed the models.24
Consistent with what has been reported by others looking at different clinical fields, measures of model performance are variably reported in this database. Although evaluation of model reporting was not a primary focus of this field synopsis, the overall picture for predictive modeling for CVD appears not dissimilar from prognosis research in a number of other disciplines where there has been little standardization, variable reporting, and as a result little impact on personalizing care.25–27 We note a wide range of EPV for the CPMs in this database raising the possibility that a substantial number of models are at risk of model overfitting. Fortunately recent efforts are underway to improve how this research is performed and reported.
There are two groups that have come together to organize and standardize the reporting of clinical predictive models.7,28 These efforts emerge from the current state of modeling research, where the impact of this work falls far short of the promise of these tools. The Prognosis research strategy (PROGRESS) group has outlined the methods that are used with predictive research in general and predictive models in particular. This group has identified a number of the ways to improve the impact of this work. More recently the Transparent Reporting of a Multivariable Model for Individual Prognosis Or Diagnosis (TRIPOD) statement was published, providing a checklist of 22 items that are considered crucial to effectively reporting CPMs. These groups and their reports take important steps toward focusing the research community and outlining ways that the results of this research can be effectively evaluated so that these tools might improve decision-making. Moving forward the major cardiovascular journals should require that CPMs conform to the standards outlined in the TRIPOD statement prior to publication.
Another cause for optimism is the wider availability of large data sets and the changing culture of data sharing.29 These efforts hold the promise not only for the development of CPMs but also for their independent testing. While data sharing is in its infancy, there is significant potential for informational return on previous research investments and these efforts will surely increase the quality and testing of CPMs. By centralizing efforts and becoming more transparent (and rigorous) about CPM assessment we can minimize duplicative research that has little effect on patient-centered outcomes.30
Our review has several limitations. Our summary presumably substantially under-estimates the number of developed CPMs. Models were excluded, for example, when they did not predict a clinical outcome measure (e.g. prediction of infarct artery location, positive biomarker status, etc, ) or provide an intercept which would permit calculation of a probability. We also do not capture articles that report exclusively on model validation. Finally, we did not formally assess reporting of all items in the recent TRIPOD statement, since this was developed well after the database was created and the focus of this review was describing the extent of the literature, not assessing reporting quality.
Nevertheless, our review underscores the disparity between the wide availability of CPMs in the literature and their limited diffusion into real world practice. Barriers including poor statistical performance for new populations; lack of a clear decision to be influenced by the CPM output; poor usability; and the reality of a dynamic sets of clinical variables all limit implementation.2–5 Model development should begin with a formal understanding of the clinical decision that might be supported by prediction; from this the population and outcome selection should follow. Additionally, investigators tend to focus on optimizing statistical performance, in particular model discrimination, an emphasis that may be misguided. The result is the landscape presented in this review, where models have proliferated without attention to the key efficacy question: what clinical decision can be supported with the probabilistic risk information provided by the CPM. We should remember that some models with relatively modest discrimination, but that nonetheless help inform critical therapeutic decisions, are among the most successful and have the highest potential for impact.10,31–33 New utility-based measures of model performance (such as decision curve analysis34) hold promise for focusing more attention on the decisional context in which models will be applied at an earlier stage of model development, but these measures are infrequently employed and not widely understood.
The ultimate measure of CPMs is whether their use can improve clinical outcomes. Important though less significant goals might be to improve decision making as measured by appropriateness criteria, patient satisfaction or decrease costs. The occasional examples of where CPMs help direct interventions toward patients most likely to benefit,35–39 all describe an essential feature of CPMs – that of informing actionable clinical decisions. Without this key focus CPMs will remain as tools on the sideline, able to inform prognosis but failing to live up to their potential.
Conclusion
We report here the methods and initial description of the Tufts PACE CPM database. We describe a rapidly growing body of CPMs for CVD. While there are a number of models available for the most common disease processes, these models are incompletely evaluated and reported. Significant work is needed to best understand how these CPMs can be used to improve and individualize research and clinical care.
Supplementary Material
Acknowledgments
Funding Sources: This work was partially supported through a Patient-Centered Outcomes Research Institute (PCORI) Pilot Project Program Award (IP2PI000722), as well as by the National Institutes of Health (U01NS086294, T32HL069770, UL1 TR001064).
Footnotes
Disclosures: None.
References
- 1.Moons KGM, Altman DG, Vergouwe Y, Royston P. Prognosis and prognostic research: application and impact of prognostic models in clinical practice. BMJ. 2009;338:b606. doi: 10.1136/bmj.b606. [DOI] [PubMed] [Google Scholar]
- 2.Kent DM, Shah ND. Risk models and patient-centered evidence: should physicians expect one right answer? JAMA. 2012;307:1585–6. doi: 10.1001/jama.2012.469. [DOI] [PubMed] [Google Scholar]
- 3.Alba AC, Agoritsas T, Jankowski M, Courvoisier D, Walter SD, Guyatt GH, Ross HJ. Risk prediction models for mortality in ambulatory patients with heart failure: a systematic review. Circ Heart Fail. 2013;6:881–9. doi: 10.1161/CIRCHEARTFAILURE.112.000043. [DOI] [PubMed] [Google Scholar]
- 4.Allan GM, Nouri F, Korownyk C, Kolber MR, Vandermeer B, McCormack J. Agreement among cardiovascular disease risk calculators. Circulation. 2013;127:1948–56. doi: 10.1161/CIRCULATIONAHA.112.000412. [DOI] [PubMed] [Google Scholar]
- 5.Gabbay E, Calvo-Broce J, Meyer KB, Trikalinos TA, Cohen J, Kent DM. The empirical basis for determinations of medical futility. J Gen Intern Med. 2010;25:1083–9. doi: 10.1007/s11606-010-1445-3. [DOI] [PMC free article] [PubMed] [Google Scholar]
- 6.Steyerberg EW, Moons KGM, van der Windt DA, Hayden JA, Perel P, Schroter S, Riley RD, Hemingway H, Altman DG. Prognosis Research Strategy (PROGRESS) 3: prognostic model research. PLoS Med. 2013;10:e1001381. doi: 10.1371/journal.pmed.1001381. [DOI] [PMC free article] [PubMed] [Google Scholar]
- 7.Collins GS, Reitsma JB, Altman DG, Moons KGM. Transparent Reporting of a Multivariable Prediction Model for Individual Prognosis or Diagnosis (TRIPOD): The TRIPOD Statement. Circulation. 2015;131:211–9. doi: 10.1111/1471-0528.13244. [DOI] [PubMed] [Google Scholar]
- 8.Varadhan R, Segal JB, Boyd CM, Wu AW, Weiss CO. A framework for the analysis of heterogeneity of treatment effect in patient-centered outcomes research. J Clin Epidemiol. 2013;66:818–25. doi: 10.1016/j.jclinepi.2013.02.009. [DOI] [PMC free article] [PubMed] [Google Scholar]
- 9.Kent DM, Rothwell PM, Ioannidis JP a, Altman DG, Hayward R a. Assessing and reporting heterogeneity in treatment effects in clinical trials: a proposal. Trials. 2010;11:85. doi: 10.1186/1745-6215-11-85. [DOI] [PMC free article] [PubMed] [Google Scholar]
- 10.Goff DC, Lloyd-Jones DM, Bennett G, Coady S, D’Agostino RB, Gibbons R, Greenland P, Lackland DT, Levy D, O’Donnell CJ, Robinson JG, Schwartz JS, Shero ST, Smith SC, Sorlie P, Stone NJ, Wilson PWF, Jordan HS, Nevo L, Wnek J, Anderson JL, Halperin JL, Albert NM, Bozkurt B, Brindis RG, Curtis LH, DeMets D, Hochman JS, Kovacs RJ, Ohman EM, Pressler SJ, Sellke FW, Shen W-K, Tomaselli GF. 2013 ACC/AHA guideline on the assessment of cardiovascular risk: a report of the American College of Cardiology/American Heart Association Task Force on Practice Guidelines. Circulation. 2014;129:S49–73. doi: 10.1161/01.cir.0000437741.48606.98. [DOI] [PubMed] [Google Scholar]
- 11.January CT, Wann LS, Alpert JS, Calkins H, Cigarroa JE, Cleveland JC, Conti JB, Ellinor PT, Ezekowitz MD, Field ME, Murray KT, Sacco RL, Stevenson WG, Tchou PJ, Tracy CM, Yancy CW. 2014 AHA/ACC/HRS Guideline for the Management of Patients With Atrial Fibrillation. J Am Coll Cardiol. 2014;64:e1–e76. doi: 10.1016/j.jacc.2014.03.022. [DOI] [PubMed] [Google Scholar]
- 12.Yancy CW, Jessup M, Bozkurt B, Butler J, Casey DE, Drazner MH, Fonarow GC, Geraci SA, Horwich T, Januzzi JL, Johnson MR, Kasper EK, Levy WC, Masoudi FA, McBride PE, McMurray JJV, Mitchell JE, Peterson PN, Riegel B, Sam F, Stevenson LW, Tang WHW, Tsai EJ, Wilkoff BL. 2013 ACCF/AHA guideline for the management of heart failure: a report of the American College of Cardiology Foundation/American Heart Association Task Force on practice guidelines. Circulation. 2013;128:e240–327. doi: 10.1161/CIR.0b013e31829e8776. [DOI] [PubMed] [Google Scholar]
- 13.Pearson T a. AHA Guidelines for Primary Prevention of Cardiovascular Disease and Stroke: 2002 Update: Consensus Panel Guide to Comprehensive Risk Reduction for Adult Patients Without Coronary or Other Atherosclerotic Vascular Diseases. Circulation. 2002;106:388–391. doi: 10.1161/01.cir.0000020190.45892.75. [DOI] [PubMed] [Google Scholar]
- 14.Steyerberg EW. Clinical Prediction Models. Springer New York; New York, NY: 2009. [Google Scholar]
- 15.Steyerberg EW, Vickers AJ, Cook NR, Gerds T, Gonen M, Obuchowski N, Pencina MJ, Kattan MW. Assessing the performance of prediction models: a framework for traditional and novel measures. Epidemiology. 2010;21:128–38. doi: 10.1097/EDE.0b013e3181c30fb2. [DOI] [PMC free article] [PubMed] [Google Scholar]
- 16.Hosmer DW, Lemesbow S. Goodness of fit tests for the multiple logistic regression model. Commun Stat - Theory Methods. 1980;9:1043–1069. [Google Scholar]
- 17.Lloyd-Jones DM. Cardiovascular risk prediction: basic concepts, current status, and future directions. Circulation. 2010;121:1768–77. doi: 10.1161/CIRCULATIONAHA.109.849166. [DOI] [PubMed] [Google Scholar]
- 18.Eggebrecht H, Schmermund A, Herold U, Baumgart D, Martini S, Kuhnt O, Lind AY, Kühne C, Kühl H, Kienbaum P, Peters J, Jakob HG, Erbel R. Endovascular stent-graft placement for acute and contained rupture of the descending thoracic aorta. Catheter Cardiovasc Interv. 2005;66:474–82. doi: 10.1002/ccd.20536. [DOI] [PubMed] [Google Scholar]
- 19.Russell MW, Taylor DCA, Cummins G, Huse DM. Use of managed care claims data in the risk assessment of venous thromboembolism in outpatients. Am J Manag Care. 2002;8:S3–9. [PubMed] [Google Scholar]
- 20.Dunder K, Lind L, Zethelius B, Berglund L, Lithell H. Evaluation of a scoring scheme, including proinsulin and the apolipoprotein B/apolipoprotein A1 ratio, for the risk of acute coronary events in middle-aged men: Uppsala Longitudinal Study of Adult Men (ULSAM) Am Heart J. 2004;148:596–601. doi: 10.1016/j.ahj.2004.03.021. [DOI] [PubMed] [Google Scholar]
- 21.Lackland DT, Roccella EJ, Deutsch AF, Fornage M, George MG, Howard G, Kissela BM, Kittner SJ, Lichtman JH, Lisabeth LD, Schwamm LH, Smith EE, Towfighi A. Factors influencing the decline in stroke mortality: a statement from the American Heart Association/American Stroke Association. Stroke. 2014;45:315–53. doi: 10.1161/01.str.0000437068.30550.cf. [DOI] [PMC free article] [PubMed] [Google Scholar]
- 22.Go AS, Mozaffarian D, Roger VL, Benjamin EJ, Berry JD, Blaha MJ, Dai S, Ford ES, Fox CS, Franco S, Fullerton HJ, Gillespie C, Hailpern SM, Heit J a, Howard VJ, Huffman MD, Judd SE, Kissela BM, Kittner SJ, Lackland DT, Lichtman JH, Lisabeth LD, Mackey RH, Magid DJ, Marcus GM, Marelli A, Matchar DB, McGuire DK, Mohler ER, Moy CS, Mussolino ME, Neumar RW, Nichol G, Pandey DK, Paynter NP, Reeves MJ, Sorlie PD, Stein J, Towfighi A, Turan TN, Virani SS, Wong ND, Woo D, Turner MB. Heart Disease and Stroke Statistics - 2014 Update: A report from the American Heart Association. Circulation. 2014;129:e28–e292. doi: 10.1161/01.cir.0000441139.02102.80. [DOI] [PMC free article] [PubMed] [Google Scholar]
- 23.Goff DC, Lloyd-Jones DM, Bennett G, Coady S, D’Agostino RB, Gibbons R, Greenland P, Lackland DT, Levy D, O’Donnell CJ, Robinson JG, Schwartz JS, Shero ST, Smith SC, Sorlie P, Stone NJ, Wilson PWF. 2013 ACC/AHA Guideline on the Assessment of Cardiovascular Risk: A Report of the American College of Cardiology/American Heart Association Task Force on Practice Guidelines. J Am Coll Cardiol. 2014;63:2935–59. doi: 10.1016/j.jacc.2013.11.005. [DOI] [PMC free article] [PubMed] [Google Scholar]
- 24.Siontis GCM, Tzoulaki I, Siontis KC, Ioannidis JPA. Comparisons of established risk prediction models for cardiovascular disease: systematic review. BMJ. 2012;344:e3318–e3318. doi: 10.1136/bmj.e3318. [DOI] [PubMed] [Google Scholar]
- 25.Collins GS, Mallett S, Omar O, Yu L-M. Developing risk prediction models for type 2 diabetes: a systematic review of methodology and reporting. BMC Med. 2011;9:103. doi: 10.1186/1741-7015-9-103. [DOI] [PMC free article] [PubMed] [Google Scholar]
- 26.Collins GS, Omar O, Shanyinde M, Yu L-M. A systematic review finds prediction models for chronic kidney disease were poorly reported and often developed using inappropriate methods. J Clin Epidemiol. 2013;66:268–77. doi: 10.1016/j.jclinepi.2012.06.020. [DOI] [PubMed] [Google Scholar]
- 27.Mallett S, Royston P, Dutton S, Waters R, Altman DG. Reporting methods in studies developing prognostic models in cancer: a review. BMC Med. 2010;8:20. doi: 10.1186/1741-7015-8-20. [DOI] [PMC free article] [PubMed] [Google Scholar]
- 28.Hemingway H, Croft P, Perel P, Hayden JA, Abrams K, Timmis A, Briggs A, Udumyan R, Moons KGM, Steyerberg EW, Roberts I, Schroter S, Altman DG, Riley RD. Prognosis research strategy (PROGRESS) 1: a framework for researching clinical outcomes. BMJ. 2013;346:e5595. doi: 10.1136/bmj.e5595. [DOI] [PMC free article] [PubMed] [Google Scholar]
- 29.Ross JS, Krumholz HM. Ushering in a new era of open science through data sharing: the wall must come down. JAMA. 2013;309:1355–6. doi: 10.1001/jama.2013.1299. [DOI] [PubMed] [Google Scholar]
- 30.Lowrance W. Access to collections of data and materials for health research: a report to the medical research council and the wellcome trust. [Internet]. [cited 2015 May 11];Available from: http://www.wellcome.ac.uk/About-us/Publications/Books/Biomedical-ethics/WTX030843.htm.
- 31.Lip GYH, Nieuwlaat R, Pisters R, Lane D a, Crijns HJGM. Refining clinical risk stratification for predicting stroke and thromboembolism in atrial fibrillation using a novel risk factor-based approach: the euro heart survey on atrial fibrillation. Chest. 2010;137:263–72. doi: 10.1378/chest.09-1584. [DOI] [PubMed] [Google Scholar]
- 32.Antman EM, Cohen M, Bernink PJ, McCabe CH, Horacek T, Papuchis G, Mautner B, Corbalan R, Radley D, Braunwald E. The TIMI risk score for unstable angina/non-ST elevation MI: A method for prognostication and therapeutic decision making. JAMA. 2000;284:835–42. doi: 10.1001/jama.284.7.835. [DOI] [PubMed] [Google Scholar]
- 33.Levy WC, Mozaffarian D, Linker DT, Sutradhar SC, Anker SD, Cropp AB, Anand I, Maggioni A, Burton P, Sullivan MD, Pitt B, Poole-Wilson PA, Mann DL, Packer M. The Seattle Heart Failure Model: prediction of survival in heart failure. Circulation. 2006;113:1424–33. doi: 10.1161/CIRCULATIONAHA.105.584102. [DOI] [PubMed] [Google Scholar]
- 34.Vickers AJ, Elkin EB. Decision curve analysis: a novel method for evaluating prediction models. Med Decis Making. 26:565–74. doi: 10.1177/0272989X06295361. [DOI] [PMC free article] [PubMed] [Google Scholar]
- 35.Gage BF, van Walraven C, Pearce L, Hart RG, Koudstaal PJ, Boode BSP, Petersen P. Selecting patients with atrial fibrillation for anticoagulation: stroke risk stratification in patients taking aspirin. Circulation. 2004;110:2287–92. doi: 10.1161/01.CIR.0000145172.55640.93. [DOI] [PubMed] [Google Scholar]
- 36.Rothwell PM, Warlow CP. Prediction of benefit from carotid endarterectomy in individual patients: a risk-modelling study. European Carotid Surgery Trialists’ Collaborative Group. Lancet. 1999;353:2105–10. doi: 10.1016/s0140-6736(98)11415-0. [DOI] [PubMed] [Google Scholar]
- 37.Yusuf S, Zucker D, Peduzzi P, Fisher LD, Takaro T, Kennedy JW, Davis K, Killip T, Passamani E, Norris R. Effect of coronary artery bypass graft surgery on survival: overview of 10-year results from randomised trials by the Coronary Artery Bypass Graft Surgery Trialists Collaboration. Lancet. 1994;344:563–70. doi: 10.1016/s0140-6736(94)91963-1. [DOI] [PubMed] [Google Scholar]
- 38.Kovalchik SA, Tammemagi M, Berg CD, Caporaso NE, Riley TL, Korch M, Silvestri GA, Chaturvedi AK, Katki HA. Targeting of low-dose CT screening according to the risk of lung-cancer death. N Engl J Med. 2013;369:245–54. doi: 10.1056/NEJMoa1301851. [DOI] [PMC free article] [PubMed] [Google Scholar]
- 39.Rao SC, Chhatriwalla AK, Kennedy KF, Decker CJ, Gialde E, Spertus JA, Marso SP. Pre-procedural estimate of individualized bleeding risk impacts physicians’ utilization of bivalirudin during percutaneous coronary intervention. J Am Coll Cardiol. 2013;61:1847–52. doi: 10.1016/j.jacc.2013.02.017. [DOI] [PubMed] [Google Scholar]
Associated Data
This section collects any data citations, data availability statements, or supplementary materials included in this article.