

Abstract
It has been demonstrated that cancer cells are under high levels of oxidative stress and express high levels of Manganese superoxide dismutase (MnSOD) to protect themselves and support the anabolic metabolism needed for growth and cell motility. The aim of this study was to identify proteins that may have a correlation with invasion and redox regulation by mitochondrial reactive oxygen species (ROS). MnSOD scavenges superoxide anions generated from mitochondria and is an important regulator of cellular redox status. Oxidative posttranslational modification of cysteine residues is a key mechanism that regulates protein structure and function. We hypothesized that MnSOD regulates intracellular reduced thiol status and promotes cancer invasion. A proteomic thiol-labeling approach with 5-iodoacetamidofluorescein was used to identify changes in intracellular reduced thiol-containing proteins. Our results demonstrate that overexpression of MnSOD maintained the major structural protein, actin, in a reduced state, and enhanced the invasion ability in gastric mucosal cancer cells, RGK1. We also found that the expression of Talin and S100A4 were increased in MnSOD-overexpressed RGK1 cells. Moreover, Talin bound not only with actin but also with S100A4, suggesting that the interaction of these proteins may, in part, contribute to the invasive ability of rat gastric cancer.
Keywords: reduced form of actin, actin binding protein, cancer invasion, MnSOD, ROS
Introduction
Reactive oxygen species (ROS) contribute to the development of several human diseases, including cancer. It is well-recognized that tumor cells generate more ROS than normal cells.(1,2) Many tumor cells have mitochondrial DNA mutations and mitochondria dysfunction.(3) Manganese superoxide dismutase (MnSOD), which scavenges superoxide anions generated from mitochondria, is an important enzyme in cellular homeostasis, cellular defense and functional dynamics.(4) The expression and/or the activity of MnSOD affects the antioxidant capacity and overall health of cells by altering mitochondrial metabolic function, leading to the development and progression of numerous diseases.(5) Some studies show that MnSOD expression and/or activity is generally lower in cancer cells than in their normal cell counterparts,(6–8) while other studies demonstrate that cancer tissues possess elevated MnSOD expression compared to normal tissues.(9,10) It has been suggested that regulation of MnSOD may confer differential outcomes in the protection of normal and cancer cells against agents that cause oxidative stress.
Recent studies have shown that peroxidant molecules, such as hydrogen peroxide, work actively as signaling molecules in cancer cells via the oxidative posttranslational modification (Ox-PTM) of cysteine residues, and may be involved in mechanism(s) that regulate protein structure and related functions.(11,12) Cysteine residues are most sensitive to oxidation and S-thiolation, S-nitrosation, disulfide bond, sulfenic, sulfinic, and sulfonic acid formation, which frequently occur as intracellular events, and may regulate the activity and function of many cellular proteins.(13) Thus, it is possible that the conversion of free cysteine residues and disulfide bonded cysteine residues to oxidised products plays a critical role in protein structure and function during oxidative stress if present.
The aim of this study was to identify proteins that may have a correlation with invasion and redox regulation by mitochondrial ROS. We hypothesize that MnSOD levels control intracellular reduced thiol status and regulate redox signaling via modification of cysteine residues. We labeled intracellular protein reduced thiol groups with 5-iodoacetamidofluorescein (5-IAF), and used mass spectrometry to identify changes to proteins in cells with MnSOD overexpression.
Materials and Methods
Cell lines
RGM1 is a normal rat mucosal parent cell line and RGK1 is the N-methyl-N-nitro N-nitrosoguanidine (MNNG)-induced mutant cells of its originated normal cell line, RGM-1.(14) The RGM1 and RGK1 cells were transfected with pCR3.1-Uni plasmid (Life Technologies, Carlsbad, CA) containing a sense human Mn-SOD cDNA insert using the Lipofectamine procedure (Life Technologies) according to the manufacturer’s instructions. Stable clones were selected with Geneticin (Life Technologies) at a final concentration of 500 µg/ml. Both cell lines were cultured with Dulbecco’s modified Eagle medium and Ham’s F-12 medium (DMEM/F12; Cosmo Bio, Isehara, Kanagawa, Japan) supplemented with 10% fetal bovine serum (Bio Source International, Camarillo, CA) and antibiotic G418 sulfate and incubated at 37°C in a humidified incubator with 5% CO2.
Matrigel invasion assay
Matrigel Matrix coating on the BD Biocoat Matrigel Invasion Chamber (BD biosciences, San Jose, CA) was utilized for measuring of cell invasion assay. 1 × 10⁴ cells were plated on the cell culture inserts with no serum media and 24 well plates with complete media including serum. Cells were incubated at 37°C in a 5% CO2 humidified atmosphere for 22 h to allow cells to invade through the membrane. After incubation, the membrane of the inserts were fixed in 100% methanol for 2 min and stained with 1% toluidine blue in 1% borax for 2 min. The removal membrane from the inserts was put on the microscope slide with mineral oil and the cover slide was placed on the membrane. Invading cells were counted in 15 random fields under a light microscope. Control represents control inserts (BD Biosciences), which detect the migrating cells through the non-matrigel basement membrane matrix. Results were expressed as the percent invasion through the matrigel basement membrane matrix relative to the migration through the control membrane. The invasion index was expressed as the ratio of the % invation of MnSOD overexpressed cells over the % invasion of vector alone cells.
5-IAF labeling of intracellular reduced thiols
1 × 10⁶ cells were prepared for staining with 5-iodoacetamidofluorescein (5-IAF; Life Technologies) to label intracellular reduced thiols. The cells were loaded with 10 µM 5-IAF for an incubation time of 6 h at 37°C, 5% CO2. Bioimages of 5-IAF were taken using laser scanning unit (Olympus IX71, model IX71S1F-2, Tokyo, Japan) and then collected cells were measured for the fluorescence intensity of the collected cells was measured using a plate reader capable of λEX 488 nm, λEM 530 nm.
To measure levels of intracellular reduced thiols on proteins separated by 1D gel electrophoresis, the cells were lysed in 125 µl of Lysis/labeling buffer [35 mM Hepes, 0.1 (v/v) Triton X-100, 1X Complete protease inhibiters, and 80 µM 5-IAF] and were incubated for 30 min at RT on a rotary shaker in the dark. Cells were centrifuged at 15,000 g for 10 min at 4°C and then TCA (50% w/v) was added to the supernatant to precipitate the protein, which was pelleted by centrifugation at 15,000 g for 5 min at 4°C. The resulting pellet was washed with 500 µl ice-cold acetone. The pellets were resuspended in gel loading buffer. The lebelled proteins were separated by SDS-PAGE in the dark, prior to scanning the gels using a fluorescence scanner capable of λEX 488 nm, λEM 530 nm to visualise the 5-IAF-proteins labelled. Coomassie Brilliant Blue staining was used to visualise total protein as a loading control.
Liquid chromatography-electrospray ionization-tandem mass spectrometry (LC-ESI-MS/MS) analysis
LC-MS/MS analysis was performed using an LTQ-Orbitrap mass spectrometer (Thermo Fisher Scientific, Waltham, MA) coupled with an Eksigent Nanoflex cHiPLC system (Eksigent, Dublin, CA) through a nano-electrospray ionization source. The peptide samples were separated with a reversed phase cHiPLC column (75 µm × 150 mm) at a flow rate of 300 nl/min. Mobile phase A was water with 0.1% (v/v) formic acid while B was acetonitrile with 0.1% (v/v) formic acid. A 50 min gradient condition was applied: initial 3% mobile phase B was increased linearly to 50% in 24 min and further to 85% and 95% for 5 min each before it was decreased to 3% and re-equilibrated. The mass analysis method consisted of one segment with eight scan events. The 1st scan event was an Orbitrap MS scan (100–1,600 m/z) with 60,000 resolution for parent ions followed by data dependent MS/MS for fragmentation of the 7 most intense ions with collision induced dissociation (CID) method.
MS/MS protein identification
The LC-MS/MS data were submitted to a local mascot server for MS/MS protein identification via Proteome Discoverer (ver. 1.3, Thermo Fisher Scientific, Waltham, MA) against Rattus taxonomy subset of Swissprot database. Parameters used in the MASCOT MS/MS ion search were: trypsin digest with maximum of two miscleavages, cysteine carbamidomethylation, cysteine 5-IAF modification, methionine oxidation, a maximum of 10 ppm MS error tolerance, and a maximum of 0.8 Da MS/MS error tolerance. A decoy database was built and searched. Filter settings that determine false discovery rates (FDR) are used to distribute the confidence indicators for the peptide matches. Peptide matches that pass the filter associated with the strict FDR (with target setting of 0.01) are assigned as high confidence. For MS/MS ion search, proteins with two or more high confidence peptides were considered unambiguous identifications without manual inspection. Proteins identified with one high confidence peptide were manually inspected and confirmed.
Western blotting analysis
The cells were lysed with RIPA buffer containing a protease inhibitor cocktail (Roche, Basel Switzerland) and the protein concentration was measured with the BCA protein assay reagent (Thermo Fisher Scientific). Twenty µg protein lysates were subjected to SDS-PAGE on 7.5, 10, 15% gels and transferred to polyvinylidene difluoride (PVDF) membranes. Membranes were blocked with 4.5% non-fat skim milk dissolved in PBS containing 0.2% Tween 20 for 1 h then incubated with primary antibody overnight at 4°C. Horseradish peroxidase-conjugated secondary antibodies were then applied for 2 h at room temperature. The bands were detected by means of ECL (Thermo Fisher Scientific) and membranes were scanned using by FluorChem FC2 Imaging System (Alpha Innotech, San Leandro, CA).
Immunoprecipitation
The cells were lysed with extraction buffer containing protease inhibitor and dissolved using ultrasonication. After centrifugation at 15,000 g for 10 min, cell lysates were mixed with 0.5 µg mouse immunoglobulin (Thermo Fisher Scientific), 20 µl of protein G sepharose (GE Healthcare UK Ltd., Amersham Place, Little Chalfont, UK) and incubated at 37°C for 1 h as pre-treatment to avoid non-specific binding. Following centrifugation at 10,000 g for 10 min, lysates were mixed with 0.5 µg anti S100A4 or Talin antibodies and incubated at 37°C for 1 h. Twenty µl of protein G sepharose were added to the lysates and incubated again at 37°C for 1 h. After centrifugation at 10,000 g for 10 min, precipitates were washed with 3 times with 20 µl of extraction buffer. Washed precipitates were suspended with 20 µl of gel loading buffer. The binding partners were detected by SDS-PAGE and western blot analysis.
Antibodies
Goat-anti Actin polyclonal antibody (Santa Cruz Biotechnology, Inc., Dallas, TX), rabbit-anti α-Actinin polyclonal antibody (Cell Signaling Technology Japan K.K., Tokyo, Japan), mouse-anti β-tubulin monoclonal antibody (Santa Cruz Biotechnology), mouse-anti E-cadherin monoclonal antibody (BD Biosciences), rabbit-anti N-cadherin polyclonal antibody (Santa Cruz Biotechnology), rabbit-anti S100A4 polyclonal antibody (Merck Millipore, Billerica, MA), rabbit-anti SNAIL polyclonal antibody (Abcam plc, Cambridge, UK), rabbit-anti Talin polyclonal antibody (Santa Cruz Biotechnology), mouse-anti Twist 1 monoclonal antibody (Santa Cruz Biotechnology), rabbit-anti Vinculin monoclonal antibody (Abcam plc), mouse-anti Vimentin monoclonal antibody antibody (Santa Cruz Biotechnology) were used as primary antibodies. Horseradish peroxidase (HRP) linked anti-goat, anti-mouse, and anti-rabbit antibodies (Santa Cruz Biotechnology) were used as secondary antibodies.
Statistical analysis
Statistical analysis was performed by Student t test. Continuous variables were expressed as mean values ± SE or SD. A p value of less than 0.05 was considered to be statistically significant.
Results
Matrigel invasion assay
An invasion assay was performed utilizing Matrigel Matrix coating on the BD Biocoat Matrigel Invasion Chamber. The cells invaded through Matrigel in RGK1 MnSOD-overexpressed cells to a greater extent than that of control cells, indicating the invasiveness was significantly increased in RGK1 MnSOD-overexpressed cells compared with the control RGK cells (Fig. 1A and B).
Fig. 1.
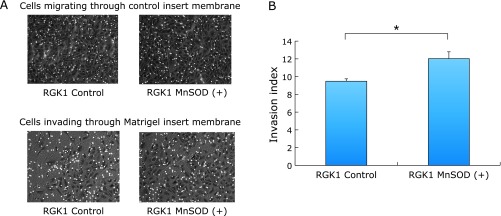
Invasion assay. (A) Matrigel Matrix coating on the BD Biocoat Matrigel Invasion Chamber was utilized for invasion assay. After incubation at 37°C in a 5% CO2 humidified atmosphere for 22 h, the cells invaded through Matrigel were observed. (B) Quantitative assessment of the invasion index. The invasion index is expressed as the ratio of the % of invasion of MnSOD overexpressed cells over the % of invasion of vector alone cells. The invasion index in MnSOD overexpressed cells in RGK1 was significantly increased compared with control cells. Bar: mean ± SE; Student t test. *p<0.05.
Detection of intracellular reduced thiols using 5-IAF labeling
To examine the intracellualr levels of thiols, the 5-IAF labeling assay was performed. 5-IAF is a fluorescent tag with specificity for free sulfhydryl groups.(15) The fluorescence intensity, representing the intracellular reduced thiols levels, was significantly increased in MnSOD overexpressed cells compared with the control cells (Fig. 2A and B). In order to identify proteins containing reduced thiols by 5-IAF labeling, cellular proteins were separated by gel electrophoresis after 5-IAF labeling. A protein near the 45 kDa band of MnSOD overexpressed cells in both normal RGM1 cells and cancer RGK1 cells was increased but was not increased in the control cells (Fig. 2C). Interestingly, the intensity of this band was more dramatically increased in the MnSOD overexpressed cancer cells compared to the normal cells, which were only slightly changed compared with the control cells (Fig. 2C). No significant changes in protein loading was apparent, as assessed by CBB staining (Fig. 2D). Next, the cells were exposed hydrogen peroxide to simulate conditions of oxidative stress. After 0.5 mM hydrogen peroxide treatment for 20 min, the intensity of the 45 kDa band in MnSOD overexpressed RGM1 cells was clearly increased but only a slight change was observed in RGK1 cells (Fig. 3A). Fig. 3B shows a quantitative assessment of the intensity of each band. These data suggest that normal and cancer cells that overexpress MnSOD adapt differently to hydrogen peroxide treatment.
Fig. 2.
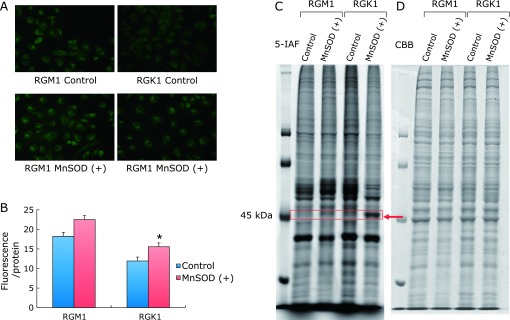
The detection of intracellular reduced thiols by 5-IAF labeling. (A) The cells were stained with 5-IAF in order to detect reduced intracellular thiols, and images were taken by laser microscope. The 5-IAF fluorescence intensity in MnSOD overexpressed cells increased compared with control cells in both RGM1 (rat normal gastric mucosal cell lines) and RGK1 [the N-methyl-N-nitro-N-nitrosoguanidine (MNNG)-induced cancer cells of the original RGM-1]. (B) Quantitative analysis of fluorescence intensity. Significant increase in fluorescence of intracellular reduced thiols in MnSOD overexpressed cells is shown. Bar: mean ± SE; Student t test. *p<0.05. (C) Separation of cellular protein via 1D Gel after 5-IAF labeling. The 45 kDa band of MnSOD overexpressed cells and RGK1 was increased in both RGM and RGK1 compared with control cells. Interestingly, MnSOD overexpressed cancer cells were dramatically increased, but normal cells were not much different than the control and MnSOD overexpressed cells. (D) CBB stain represents the protein loading control.
Fig. 3.
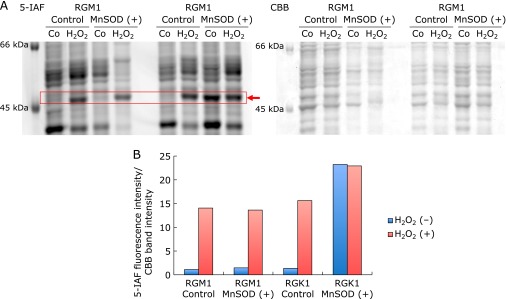
The detection of intracellular reduced thiols by 5-IAF labeling after hydrogen peroxide treatment. (A) After 0.5 mM hydrogen peroxide treatment for 20 min, the 5-IAF fluorescence intensity of the 45 kDa band in MnSOD overexpressed cells increased compared with control cells in RGM1, but a slight change occurred in RGK1 cells. (B) Quantitative assessment of the intensity of each band normalized CBB.
MS/MS protein identification
Table 1 shows the results of mass spectrometry performed to identify the 45 kDa proteins detected by SDS-PAGE and 5-IAF labeling. The data obtained from the mass spectrometry analysis were searched against the predicted peptide fragments from the trypsin digestion of proteins contained in the database Swissplot using Mascot. We then selected the proteins which had a reliability MS score of 500 or more. β-Actin was the major protein found in the 45 kDa protein band extracted from the gels, although several energy metabolism related proteins and mitochondria related proteins were also found. These results suggest that actin is the major protein containing reduced thiols and binding 5-IAF in the 45 kDa band from samples prepared from MnSOD overexpressed cells.
Table 1.
The results of mass spectrometry
| Accession | Description | Function | Score | Coverage | #Unique Peptides | #Peptides | MW (kDa) |
|---|---|---|---|---|---|---|---|
| P60711 | Actin, cytoplasmic 1 OS = Rattus norvegicus, GN = Actb, PE = 1, SV = 1 - [ACTB_RAT] | a globular multi-functional protein | 3863.89 | 89.33 | 0 | 30 | 41.7 |
| P63259 | Actin, cytoplasmic 2 OS = Rattus norvegicus, GN = Actg1, PE = 1, SV = 1 - [ACTG_RAT] | 3863.89 | 89.33 | 0 | 30 | 41.8 | |
| P68035 | Actin, alpha cardiac muscle 1 OS = Rattus norvegicus, GN = Actc1, PE = 1, SV = 1 - [ACTC_RAT] | 1660.14 | 40.85 | 0 | 17 | 42.0 | |
| P62738 | Actin, aortic smooth muscle OS = Rattus norvegicus, GN = Acta2, PE = 1, SV = 1 - [ACTA_RAT] | 1615.92 | 37.93 | 0 | 16 | 42.0 | |
| P68136 | Actin, alpha skeletal muscle OS = Rattus norvegicus, GN = Acta1, PE = 2, SV = 1 - [ACTS_RAT] | 1436.23 | 34.75 | 0 | 15 | 42.0 | |
| P63269 | Actin, gamma-enteric smooth muscle OS = Rattus norvegicus, GN = Actg2, PE = 2, SV = 1 - [ACTH_RAT] | 1391.99 | 31.91 | 0 | 14 | 41.8 | |
| P85968 | 6-phosphogluconate dehydrogenase, decarboxylating OS = Rattus norvegicus, GN = Pgd, PE = 1, SV = 1 - [6PGD_RAT] | an enzyme in the pentose phosphatepathway | 649.91 | 32.09 | 11 | 11 | 53.2 |
| P50399 | Rab GDP dissociation inhibitor beta OS = Rattus norvegicus, GN = Gdi2, PE = 1, SV = 2 - [GDIB_RAT] | a proteins that regulate the GDP-GTP exchange reaction of members of the rab family, small GTP-binding proteins of the ras superfamily | 552.15 | 39.78 | 13 | 14 | 50.5 |
| P41562 | Isocitrate dehydrogenase [NADP] cytoplasmic OS = Rattus norvegicus, GN = Idh1, PE = 1, SV = 1 - [IDHC_RAT] | an enzyme that is used duringthe third step of the citric acid cycle | 523.21 | 40.82 | 13 | 14 | 46.7 |
| P29457 | Serpin H1 OS = Rattus norvegicus, GN = Serpinh1, PE = 1, SV = 1 - [SERPH_RAT] | a protein that member of the serpin superfamily of serine proteinase inhibitors | 502.62 | 44.36 | 11 | 11 | 46.5 |
The data from mass spectrometry were searched to find the predicted fragment from the trypsin digestion of proteins contained in a database Swissplot using Mascot and we selected the proteins with an MS score of 500 or more. Beta-actin is the major protein in the bands of 45 kDa, although some energy metabolism related proteins and mitochondria related proteins were also found.
The expression of epithelial mesenchymal transition (EMT) marker
The expression of Snail1, Twist1, which are transcriptional factors of E-cadherin and N-cadherin, have been examined by western blot analysis. The band of Twist1 in MnSOD overexpressed cells was slightly incresed compared with control cells (Fig. 4A). Fig. 4B shows a quantitative assessment of the intensity of each band. The expressions of Snail1, Twist1, E-cadherin and N-cadherin did not change in either the control or MnSOD overexpressed cells.
Fig. 4.

Expression of EMT markers. (A) Expression of EMT markers were detected by Western blot analysis. Total cell lysates (20 µg/lane) of each sample were subjected to SDS PAGE in 7.5–15% gels for resolution of Snail1, Twist1, E-cadherin, N-cadherin. β-actin was used to standardize loading. (B) Quantitative assessment of the intensity of each band. There were no significant difference in the expression of EMT markers between the control and MnSOD overexpressed cells.
The expression of actin binding proteins
Evaluation of actin binding proteins (Talin, Vinculin, α-actinin and S100A4) were performed by quantitative Western blotting analysis. The bands of Talin and S100A4 in MnSOD overexpressed cells were observed to increase campared with control cells, whereas no change was observed in Vinculin and α-actinin (Fig. 5A and B).
Fig. 5.
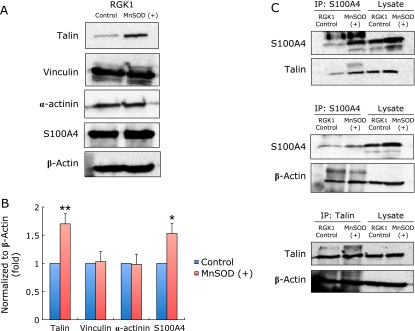
Expression of actin binding proteins and linkage of actin binding proteins. (A) Expression of actin binding proteins was detected by Western blot analysis. Total cell lysates (20 µg/lane) of each sample were subjected to SDS-PAGE in 7.5–15% gels for resolution of Talin, Vinculin, α-actinin, S100A4. β-actin was used to standardize loading. (B) Quantitative assessment of the intensity of each band. Levels of Talin and S100A4 in MnSOD overexpressed cells were higher than those in control cells, but the expression of Vinculin and α-actinin did not change in the control or MnSOD overexpressed cells. Bar: mean ± SE; Student t test. *p<0.05, **p<0.01. (C) Linkage of actin binding proteins was detected by immunoprecipitation. Linkages of S100A4 and Talin, S100A4 and actin, Talin and actin are shown.
Interaction of actin, S100A4 and talin
In order to investigate the interaction of actin and S100A4 and Talin, an immunoprecipitation assay was performed (Fig. 5C). Proteins were precipitated with a S100A4 antibody, followed by Talin and actin detection. Both interactins between S100A4 and Talin, and S100A4 and actin was observed. To examine the interaction between Talin and actin, the cell lysate was immunoprecipitated with a Talin antibody, then the interaction between actin and Talin was observed (Fig. 5C), suggesting a S100A4, actin and Talin complex conjunction.
Discussion
Cancer cells are usually under higher oxidative stress compared to normal cells.(1,2) Consistent with this general feature of cancer cells, RGK1 cells generate more ROS compared with their normal cell counterparts, RGM1 cell (Supplemental Fig. 1A and B*). Furthermore, MnSOD activity and expression are higher in RGK1 cells than in RGM1 cells (Supplemental Fig. 1C and D*). To identify the mechanistic link between increased ROS and cancer invasiveness related to MnSOD levels, we first investigated the role of MnSOD in cancer invasiveness. The invasiveness was significantly increased in RGK1 MnSOD-overexpressed cells compared with the control RGK cells at 22 h after seeding. This result is consistent with our previously reported study, where we used several additional MnSOD overexpressed cell clones (clones MnSOD-2,3,9).(16)
We previously reported that cell movement ability is relatively low in MnSOD overexpressed cells in terms of cellular ruffling frequencies, and a wound healing assay at 24 h, to evaluate horizontal cellular migration, resulted in increased migration in MnSOD overexpressed cells compared to the control vector alone cells.(16) However, opposite effects have been shown in a vertical migration assay after 24 h, which are consistent with our present data at 22 h.(16) Therefore, MnSOD overexpressed cells may result in lower cellular movement ability, but increased in invasion ability.
To examine this hypothesis, we performed 5-IAF labeling to detect intracellular reduced thiols to determine the intracellular redox status in normal and cancer cells. To identify proteins with altered thiol status in MnSOD overexpressed cancer cells, mass spectrometry was performed using the identified band, which showed different levels of the reduced thiols status between the control and MnSOD overexpressed cells.
Our results showed that the level of actin containing reduced thiols in MnSOD overexpressed cancer cells was dramatically increased, but normal cells were only slightly different to the control and MnSOD overexpressed cells. Interestingly, after 0.5 mM hydrogen peroxide treatment for 20 min, the fluorescence intensity of actin in MnSOD overexpressed RGM1 cells was clearly increased but only a slight change occurred in RGK1 cells. These data suggest that normal and cancer cells that overexpress MnSOD adapt differently to oxidative stress. Because cancer cells are under higher oxidative stress conditions compared to normal cells, this result is consistent with the concept that in hydrogen peroxide treated normal cells, the cell can adapt to protect itself. However, in aggressive cancer cells, oxidative conditions are already high and, thus, the cells can no longer adapt to treatment with hydrogen peroxide.
We investigated whether the increase in actin reduced thiols in MnSOD overexpressed RGK1 cells is linked to the increased invasive phenotype of the cells. It is often the case that the cellular structure of cancer cells is not normal and it is often disruptive. Therefore, it is possible that a reduced form of actin results from a dissociation of disulfide bonds that causes the normal structure of actin to be lost. Moreover, the change in structure and function of actin may cause increased cell motility and invasion by cancer cells. Actin has an important role in cell motility and contraction, cell signaling, and establishment and maintenance of cell junctions and cell shapes.(17) Cys-374 is the most sensitive site for oxidative modification of cysteine residues in actin because it is localized at the surface of the protein where it undergoes oxidation, glutathionylation, carbonylation, and nitrosylation.(18) Oxidation of actin inhibits its interaction with profilin and decreases the polymerization of filamentous actin.(19) Recent studies have suggested that the actin cytoskeleton is associated with the migration in the extracellular matrix needed to form invadopodia or podosomes via activating Rac/Rho signaling, leading to cancer migration and invasion.(20–22)
MnSOD expression and/or activity depend on the type of cancer and its stage. Dhar et al.(23) have demonstrated that the balance between Sp1 and p53 plays an important role in regulating MnSOD levels in cancer development. It has also been reported that MnSOD not only promotes metastasis,(24–26) but its overexpression inhibits growth rate and invasiveness.(27–29) The activity and expression of MnSOD are higher in RGK1 cells than in RGM1 cells, which is consistent with RGK1 cells being a more advanced cancer type.
It is well-established that EMT allows the cancer cell to acquire invasive properties.(30) The induction of transcription factors, such as Snail, Twist, Slug, and Zeb, alters gene expression to promote loss of cell-to-cell adhesion, leading to downregulation of E-cadherin and upregulation of metastatic proteins, such as N-cadherin, vimentin, matrix metalloproteinase.(31) However, our results show that the expression of EMT markers did not change in either the control or MnSOD overexpressed cells.
We then investigated the expression of actin binding proteins in order to extend our understanding of how actin exerts its effects on invasiveness. Actin binding proteins, such as Talin, Vinculin, and α-actinin, are well-known for forming integrin-actin linkages and they modulate actin filament assembly and activation of integrin, and also control the interaction between focal adhesions and actin cytoskeletons.(32) Talin directly binds to the tail of the β subunit of integrins, but Vinculin and α-actinin bind to integrin indirectly via actin filaments.(33) It has been reported that the expression of Talin 1 was significantly upregulated in oral squamous cell carcinomas and that its expression level correlates with advanced cancer types.(34) Moreover, high α-actinin 4 expressions were often observed in thyroid cancer.(35) Our results show a significant increase in Talin expression in MnSOD overexpressed cells. However, the expression of Vinculin and α-actinin did not change in either the control or MnSOD overexpressed cells. These results suggest that Talin, which binds directly to integrin, may be more important to cancer invasion than other actin binding proteins. S100A4, which is also known as metastasin or calvasculin, is a member of the S100 calcium-binding protein family, which plays a role in metastasis and invasion in cancer cells.(36) S100A4 is associated with an interaction of cytoskeletal proteins, such as myosin and F-actin, which regulate cell shape and cell motility.(37,38) The expression of S100A4 was significantly increased in MnSOD overexpressed cells compared to the control cells. Thus, overexpression of MnSOD in cancer cells may be consistently related to cancer invasiveness.
Although it is known that S100A4 binds to cytoskeletal proteins, it is not clear whether S100A4 binds to actin binding proteins such as Talin. Our results show that S100A4 binds not only with actin but also with Talin, suggesting that S100A4 is also related to integrin–actin linkages. Our result is consistent with previous reports that S100A4 is associated with integrin, which results in cancer invasion,(39) although further study on the binding mechanism of S100A4 will be needed.
Conclusion
Our results indicate that MnSOD increased intracellular actin reduced thiol levels and led to an increased interaction of actin, Talin and S100A4, consistent with the increased invasion of gastric cancer cells. Thus, an increase in the reduced thiol status of key intracellular proteins, including actin, under oxidative stress conditions, may represent an additional mechanism regulating rat gastric cancer invasion.
Acknowledgments
We wish to thank JSPS (the Japan Society for the Promotion of Science) Core-to-Core Program for supporting research and the Joint Research Laboratory, Kagoshima University Graduate School of Medical and Dental Sciences, for the use of their faculties. We acknowledge the University of Kentucky Proteomics Core, which is partially supported by the National Institute of General Medical Sciences COBRE Grant P20GM103486-09. The Orbitrap mass spectrometer was acquired by High-End Instrumentation Grant S10RR029127 (to H.Z.).
Conflict of Interest
No potential conflicts of interest were disclosed.
Supplementary Material
References
- 1.Toyokuni S, Okamoto K, Yodoi J, Hiai H. Persistent oxidative stress in cancer. FEBS Lett. 1995;358:1–3. doi: 10.1016/0014-5793(94)01368-b. [DOI] [PubMed] [Google Scholar]
- 2.Troll W. Prevention of cancer by agents that suppress oxygen radical formation. Free Radic Res Commun. 1991;12-13 Pt 2:751–757. doi: 10.3109/10715769109145855. [DOI] [PubMed] [Google Scholar]
- 3.Boland ML, Chourasia AH, Macleod KF. Mitochondrial dysfunction in cancer. Front Oncol. 2013;3:292. doi: 10.3389/fonc.2013.00292. [DOI] [PMC free article] [PubMed] [Google Scholar]
- 4.Indo HP, Yen H-C, Nakanishi I, et al. A mitochondrial superoxide theory for oxidative stress diseases and aging. J Clin Biochem Nutr. 2015;56:1–7. doi: 10.3164/jcbn.14-42. [DOI] [PMC free article] [PubMed] [Google Scholar]
- 5.Holley AK, Bakthavatchalu V, Velez-Roman JM, St. Clair DK. Manganese superoxide dismutase: guardian of the powerhouse. Int J Mol Sci. 2011;12:7114–7162. doi: 10.3390/ijms12107114. [DOI] [PMC free article] [PubMed] [Google Scholar]
- 6.Oberley LW, Buettner GR. Role of superoxide dismutase in cancer: a review. Cancer Res. 1979;39:1141–1149. [PubMed] [Google Scholar]
- 7.Van Driel BE, Lyon H, Hoogenraad DC, Anten S, Hansen U, Van Noorden CJ. Expression of CuZn- and Mn-superoxide dismutase in human colorectal neoplasms. Free Radic Biol Med. 1997;23:435–444. doi: 10.1016/s0891-5849(97)00102-0. [DOI] [PubMed] [Google Scholar]
- 8.Sun GG, Wang YD, Chen LQ, et al. Novel cancer suppressor gene for esophageal cancer: manganese superoxide dismutase Dis Esophagus 2010. DOI: 10.1111/j.1442-2050.2010.01149.x [DOI] [PubMed] [Google Scholar]
- 9.Janssen AM, Bosman CB, Sier CF, et al. Superoxide dismutases in relation to the overall survival of colorectal cancer patients. Br J Cancer. 1998;78:1051–1057. doi: 10.1038/bjc.1998.626. [DOI] [PMC free article] [PubMed] [Google Scholar]
- 10.Kahlos K, Anttila S, Asikainen T, et al. Manganese superoxide dismutase in healthy human pleural mesothelium and in malignant pleural mesothelioma. Am J Respir Cell Mol Biol. 1998;18:570–580. doi: 10.1165/ajrcmb.18.4.2943. [DOI] [PubMed] [Google Scholar]
- 11.Martins D, Kathiresan M, English AM. Cytochrome c peroxidase is a mitochondrial heme-based H2O2 sensor that modulates antioxidant defense. Free Radic Biol Med. 2013;65:541–551. doi: 10.1016/j.freeradbiomed.2013.06.037. [DOI] [PubMed] [Google Scholar]
- 12.Connor KM, Subbaram S, Regan KJ, et al. Mitochondrial H2O2 regulates the angiogenic phenotype via PTEN oxidation. J Biol Chem. 2005;280:16916–16924. doi: 10.1074/jbc.M410690200. [DOI] [PubMed] [Google Scholar]
- 13.Chung HS, Wang SB, Venkatraman V, Murray CI, Van Eyk JE. Cysteine oxidative posttranslational modifications: emerging regulation in the cardiovascular system. Circ Res. 2013;112:382–392. doi: 10.1161/CIRCRESAHA.112.268680. [DOI] [PMC free article] [PubMed] [Google Scholar]
- 14.Shimokawa O, Matsui H, Nagano Y, et al. Neoplastic transformation and induction of H+,K+ -adenosine triphosphatase by N-methyl-N'-nitro-N-nitrosoguanidine in the gastric epithelial RGM-1 cell line. In Vitro Cell Dev Biol Anim. 2008;44:26–30. doi: 10.1007/s11626-007-9067-8. [DOI] [PubMed] [Google Scholar]
- 15.Hawkins CL, Morgan PE, Davies MJ. Quantification of protein modification by oxidants. Free Radic Biol Med. 2009;46:965–988. doi: 10.1016/j.freeradbiomed.2009.01.007. [DOI] [PubMed] [Google Scholar]
- 16.Tamura M, Matsui H, Tomita T, et al. Mitochondrial reactive oxygen species accelerate gastric cancer cell invasion. J Clin Biochem Nutr. 2014;54:12–17. doi: 10.3164/jcbn.13-36. [DOI] [PMC free article] [PubMed] [Google Scholar]
- 17.Blanchoin L, Boujemaa-Paterski R, Sykes C, Plastino J. Actin dynamics, architecture, and mechanics in cell motility. Physiol Rev. 2014;94:235–263. doi: 10.1152/physrev.00018.2013. [DOI] [PubMed] [Google Scholar]
- 18.Terman JR, Kashina A. Post-translational modification and regulation of actin. Curr Opin Cell Biol. 2013;25:30–38. doi: 10.1016/j.ceb.2012.10.009. [DOI] [PMC free article] [PubMed] [Google Scholar]
- 19.Lassing I, Schmitzberger F, Björnstedt M, et al. Molecular and structural basis for redox regulation of beta-actin. J Mol Biol. 2007;370:331–348. doi: 10.1016/j.jmb.2007.04.056. [DOI] [PubMed] [Google Scholar]
- 20.Jiang P, Enomoto A, Takahashi M. Cell biology of the movement of breast cancer cells: intracellular signalling and the actin cytoskeleton. Cancer Lett. 2009;284:122–130. doi: 10.1016/j.canlet.2009.02.034. [DOI] [PubMed] [Google Scholar]
- 21.Ouderkirk JL, Krendel M. Non-muscle myosins in tumor progression, cancer cell invasion, and metastasis. Cytoskeleton (Hoboken) 2014;71:447–463. doi: 10.1002/cm.21187. [DOI] [PMC free article] [PubMed] [Google Scholar]
- 22.Yamaguchi H, Condeelis J. Regulation of the actin cytoskeleton in cancer cell migration and invasion. Biochim Biophys Acta. 2007;1773:642–652. doi: 10.1016/j.bbamcr.2006.07.001. [DOI] [PMC free article] [PubMed] [Google Scholar]
- 23.Dhar SK, Tangpong J, Chaiswing L, Oberley TD, St Clair DK. Manganese superoxide dismutase is a p53-regulated gene that switches cancers between early and advanced stages. Cancer Res. 2011;71:6684–6695. doi: 10.1158/0008-5472.CAN-11-1233. [DOI] [PMC free article] [PubMed] [Google Scholar]
- 24.Malafa M, Margenthaler J, Webb B, Neitzel L, Christophersen M. MnSOD expression is increased in metastatic gastric cancer. J Surg Res. 2000;88:130–134. doi: 10.1006/jsre.1999.5773. [DOI] [PubMed] [Google Scholar]
- 25.Salzman R, Kanková K, Pácal L, Tomandl J, Horáková Z, Kostrica R. Increased activity of superoxide dismutase in advanced stages of head and neck squamous cell carcinoma with locoregional metastases. Neoplasma. 2007;54:321–325. [PubMed] [Google Scholar]
- 26.Nozoe T, Honda M, Inutsuka S, Yasuda M, Korenaga D. Significance of immunohistochemical expression of manganese superoxide dismutase as a marker of malignant potential in colorectal carcinoma. Oncol Rep. 2003;10:39–43. [PubMed] [Google Scholar]
- 27.Liu R, Oberley TD, Oberley LW. Transfection and expression of MnSOD cDNA decreases tumor malignancy of human oral sqamous carcinoma SCC-25 cells. Hum Gene Ther. 1997;8:585–595. doi: 10.1089/hum.1997.8.5-585. [DOI] [PubMed] [Google Scholar]
- 28.Venkataraman S, Jiang X, Weydert C, et al. Manganese superoxide dismutase overexpression inhibits the growth of androgen-independent prostate cancer cells. Oncogene. 2005;24:77–89. doi: 10.1038/sj.onc.1208145. [DOI] [PubMed] [Google Scholar]
- 29.Weydert C, Roling B, Liu J, et al. Suppression of the malignant phenotype in human pancreatic cancer cells by the overexpression of manganese superoxide dismutase. Mol Cancer Ther. 2003;2:361–369. [PubMed] [Google Scholar]
- 30.Le Bras GF, Taubenslag KJ, Andl CD. The regulation of cell-cell adhesion during epithelial-mesenchymal transition, motility and tumor progression. Cell Adh Migr. 2012;6:365–373. doi: 10.4161/cam.21326. [DOI] [PMC free article] [PubMed] [Google Scholar]
- 31.Tania M, Khan MA, Fu J. Epithelial to mesenchymal transition inducing transcription factors and metastatic cancer. Tumour Biol. 2014;35:7335–7342. doi: 10.1007/s13277-014-2163-y. [DOI] [PubMed] [Google Scholar]
- 32.Brüggemann D, Frohnmayer JP, Spatz JP. Model systems for studying cell adhesion and actin networks. Beilstein J Nanotechnol. 2014;5:1193–1202. doi: 10.3762/bjnano.5.131. [DOI] [PMC free article] [PubMed] [Google Scholar]
- 33.Ciobanasu C, Faivre B, Le Clainche C. Integrating actin dynamics, mechanotransduction and integrin activation: The multiple functions of actin binding proteins in focal adhesions. Euro J Cell Biol. 2013;92:339–348. doi: 10.1016/j.ejcb.2013.10.009. [DOI] [PubMed] [Google Scholar]
- 34.Lai MT, Hua CH, Tsai MH, et al. Talin-1 overexpression defines high risk for aggressive oral squamous cell carcinoma and promotes cancer metastasis. J Pathol. 2011;224:367–376. doi: 10.1002/path.2867. [DOI] [PubMed] [Google Scholar]
- 35.Tanaka N, Yamashita T, Yamamoto S, et al. Histological growth pattern of and alpha-actinin-4 expression in thyroid cancer. Anticancer Res. 2014;34:3157–3163. [PubMed] [Google Scholar]
- 36.Salama I, Malone PS, Mihaimeed F, Jones JL. A review of the S100 proteins in cancer. Eur J Surg Oncol. 2008;34:357–364. doi: 10.1016/j.ejso.2007.04.009. [DOI] [PubMed] [Google Scholar]
- 37.Chen N, Sato D, Saiki Y, Sunamura M, Fukushige S, Horii A. S100A4 is frequently overexpressed in lung cancer cells and promotes cell growth and cell motility. Biochem Biophys Res Commun. 2014;447:459–464. doi: 10.1016/j.bbrc.2014.04.025. [DOI] [PubMed] [Google Scholar]
- 38.Gonzalez DM, Medici D. Signaling mechanisms of the epithelial-mesenchymal transition. Sci Signal. 2014;7:re8. doi: 10.1126/scisignal.2005189. [DOI] [PMC free article] [PubMed] [Google Scholar]
- 39.Kim TH, Kim HI, Soung YH, Shaw LA, Chung J. Integrin (alpha6beta4) signals through Src to increase expression of S100A4, a metastasis-promoting factor: implications for cancer cell invasion. Mol Cancer Res. 2009;7:1605–1612. doi: 10.1158/1541-7786.MCR-09-0102. [DOI] [PubMed] [Google Scholar]
Associated Data
This section collects any data citations, data availability statements, or supplementary materials included in this article.