

In the article entitled “Ingestion of hyaluronans (molecular weights 800 k and 300 k) improves dry skin conditions: a randomized, double blind, controlled study” by Kawada et al. (Journal of Clinical Biochemistry and Nutrition 2015; 56: 66–73), several errors in Fig. 3 and Table 2 and 5 have been identified. Fig. 3A showed lines of the HA 800k group and the HA 300k group inversely, and legend of Fig. 3 showed Dunnett’s test instead of Steel Dwass test as statistical analysis. Table 2 and 5 showed several erroneous values and missing information: i.e., Table 2 should be showed unit information, and max. and min. amplitude value of Table 5 should be showed standard errors multiplied by 10−1. Corrected sentences, figure and tables are printed below.
Fig. 3.
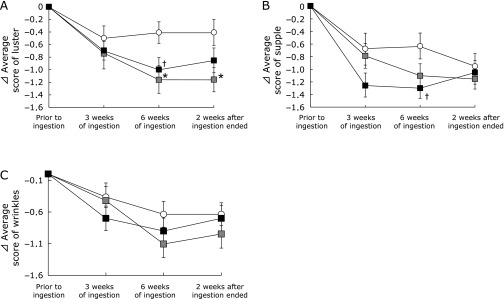
Changes in the subjective skin condition with time following ingestion of hyaluronans and placebo. The subjective skin conditions, i.e., luster, suppleness, and wrinkles, were evaluated using a questionnaire prior to ingestion, 3 and 6 weeks of ingestion, and 2 weeks after ingestion ended. Differences in each questionnaire result relative to the baseline condition (⊿): (A) luster, (B) suppleness, and (C) wrinkles.  indicates the placebo group;
  indicates the HA 800k group;
  indicates the HA 300k group. Steel Dwass test was used to compare the three groups. Data are present as means ± S.E. †p<0.10 and *p<0.05.
Table 2.
Baseline characteristics of the study subjects
| Placebo | HA 800k | HA 300k | Total | |
|---|---|---|---|---|
| Number of subjects | 22 | 19 | 20 | 61 |
| Mean age (Age Range) | 42.73 ± 0.92 (35–60) | 43.68 ± 1.23 (35–60) | 43.90 ± 1.06 (35–60) | 43.41 ± 0.61 |
| Sex | female | |||
| Skin moisture (stratum corneum; a.u.) | 19.49 ± 1.85 | 19.31 ± 1.78 | 21.53 ± 1.61 | 20.10 ± 0.96 |
| Skin viscoelasticity | ||||
| Max. amplitude (mm) | 0.32 ± 0.01 | 0.35 ± 0.01 | 0.32 ± 0.01 | 0.33 ± 0.01 |
| Min. amplitude (mm) | 0.08 ± 0.01 | 0.09 ± 0.01 | 0.09 ± 0.01 | 0.09 ± 0.00 |
| Return rate (%) | 73.84 ± 1.76 | 73.86 ± 1.21 | 72.74 ± 1.50 | 73.48 ± 0.88 |
Table 5.
Changes in skin viscoelasticity following ingestion of hyaluronans and the placebo
| Skin viscoelasticity | Prior to ingestion | 3 weeks of ingestion | 6 weeks of ingestion | 2 weeks after ingestion ended | |
|---|---|---|---|---|---|
| Max. amplitude (10−1 mm) | Placebo | 3.02 ± 0.11 | 2.33 ± 0.11* | 3.00 ± 0.13 | 3.19 ± 0.13 |
| HA 800k | 3.15 ± 0.14 | 2.51 ± 0.16*** | 2.88 ± 0.18 | 3.21 ± 0.18 | |
| HA 300k | 3.23 ± 0.11 | 2.52 ± 0.14*** | 3.08 ± 0.16 | 3.45 ± 0.13 | |
| Min. amplitude (10−1 mm) | Placebo | 0.71 ± 0.05 | 0.24 ± 0.04** | 0.58 ± 0.04* | 0.66 ± 0.04 |
| HA 800k | 0.72 ± 0.05 | 0.24 ± 0.02*** | 0.66 ± 0.05 | 0.70 ± 0.07 | |
| HA 300k | 0.81 ± 0.05 | 0.23 ± 0.03*** | 0.68 ± 0.04** | 0.74 ± 0.04 | |
| Return rate (%) | Placebo | 76.44 ± 1.57 | 89.75 ± 1.32*** | 80.12 ± 1.51* | 79.00 ± 1.53 |
| HA 800k | 76.37 ± 1.81 | 89.94 ± 0.94*** | 76.45 ± 1.66 | 77.05 ± 2.36 | |
| HA 300k | 74.11 ± 1.57 | 90.46 ± 1.10*** | 77.08 ± 1.66 | 77.70 ± 1.72 |
*p<0.05, **p<0.01, and ***p<0.001 vs prior to ingestion according to a paired t test. Means ± SE. HA, hyaluronan.
p. 69, line 3
Furthermore, the significant improvement in skin luster was maintained in the HA 800 k group 2 weeks after consumption ended (p<0.05).