

Abstract
Multiple imaging modalities are often required for in vivo imaging applications that require both high probe sensitivity and excellent spatial and temporal resolution. In particular, MR and optical imaging are an attractive combination that can be used to determine both molecular and anatomical information. Herein, we describe the synthesis and in vivo testing of two multimeric NIR–MR contrast agents that contain three Gd(III) chelates and an IR-783 dye moiety. One agent contains a PEG linker and the other a short alkyl linker. These agents label cells with extraordinary efficacy and can be detected in vivo using both imaging modalities. Biodistribution of the PEGylated agent shows observable fluorescence in xenograft MCF7 tumors and renal clearance by MR imaging.
Introduction
Magnetic resonance imaging (MRI) is a powerful diagnostic tool used in both clinical and research settings due to its capacity to render images with high spatial and temporal resolution. Unlike other imaging modalities, MR does not require the use of ionizing radiation or suffer from limited depth penetration, making it well suited for non-invasive longitudinal studies. As a result, MRI has become a major focus of translational imaging research, with the ultra-high resolution achievable with high-field magnets making it particularly well suited to applications such as fate mapping transplanted stem cells,1−3 detecting cancer,4,5 and tracking gene expression.6−8
Contrast agents are typically used to enhance intrinsic MR image contrast. These agents selectively shorten the longitudinal (T1) or transverse (T2) relaxation times of water protons in the region of interest, thereby allowing the visualization of a wide range of otherwise undetectable biomarkers. Gadolinium(III) complexes are the most commonly used T1 contrast agents due to the metal’s seven unpaired electrons (S = 7/2) and high magnetic moment.9 The efficacy with which Gd(III) shortens T1 is termed its relaxivity (r1); agents with higher relaxivities are more sensitive and are detectable at lower concentrations.
A significant limitation of T1 contrast agents is the low observed relaxivities, which ultimately translate into signal ambiguity. One strategy to address this shortcoming involves multiplexing an MR contrast agent with a more sensitive imaging modality, such as optical imaging.10,11 In this combination, MR offers detailed anatomic imaging, while optical imaging offers high probe sensitivity that can be used to image molecular targets at low concentrations. In order to take advantage of this high sensitivity in vivo, it is necessary to use fluorophores that excite in the near-infrared (NIR) imaging window of 700 to 1000 nm as the biological matrix exhibits high absorption and autofluorescence background at shorter wavelengths.12,13
To take advantage of the strengths of optical and MR imaging, our approach was to design a multimodal agent that excites in the NIR range and offers a single pharmacological behavior for both imaging acquisitions. There have been an increasing number of reports of NIR–MR contrast agents which incorporate a wide variety of nanoconjugates,14,15 however, the intrinsic variability and fast clearance of nanoparticles can make long-term longitudinal studies impractical.16 Additionally, while researchers have developed a number of small molecule MR-optical contrast agents conjugated to fluorophores such as rhodamine,17−19 fluorescein,20,21 napthalimide,22,23 BODIPY,24 and luminescent lanthanides,25−27 these agents excite predominately in the visible light spectrum and suffer from low relaxivities, thereby limiting in vivo applications. Small molecule MR-optical agents that excite in the NIR range exist,28,29 however, they suffer from reduced chelate stability and a discrepancy in sensitivity between the MR and optical component due to the 1:1 ratio of the fluorophore and Gd(III) chelate.
Previously, we have reported an agent that consisted of three macrocyclic Gd(III) chelates conjugated to a fluorescein moiety.30 This agent possessed high relaxivity, water solubility, and excellent cell labeling capabilities but its in vivo application was limited by the excitation wavelength of fluorescein. To overcome this limitation, we have prepared a multimodal agent using IR-783, chosen due to its high extinction coefficient, excellent emission wavelengths, and high photochemical and photophysical stability as compared to other commercially available NIR dyes.31,32 Two agents were synthesized and evaluated for cell labeling in vitro. Additionally, biodistribution of 1 was evaluated in vivo using a xenograft MCF7 tumor model. Although further work is needed to increase the sensitivity of the MR component, here we show that these agents possess outstanding cell labeling capability and are detectable in vivo using both MR and optical imaging.
Results and Discussion
Synthesis and Characterization
Two multimeric MR contrast agents conjugated to IR-783 dye were synthesized and characterized (Figure 1). The linker between IR-783 and the phenolic core was varied to investigate the effect on water solubility and the photophysical properties of the complexes. The synthesis of these agents begins with the preparation of an amine-functionalized core. Complex 4 was synthesized according to literature procedure,30 whereas 3 was synthesized from 1,11-dichloro-3,6,9-trioxa-undecane (see Supporting Information, SI, Scheme S1 for synthetic details). In order to incorporate IR-783 onto these scaffolds, an isothiocyanate functional handle was introduced onto the commercially available dye (see SI Scheme S2 for synthetic details).
Figure 1.

Structure of agents investigated in vitro. The presence of the IR-783 dye moiety in complexes 1 and 2 increases cellular uptake and introduces the capacity to image using optical imaging. Complex 1 utilizes a PEG linker to increase water solubility and increase the distance between the Gd(III) and NIR moieties.
Compounds 1 and 2 were synthesized via the direct reaction of 3 or 4 with 5 in a mixture of bicarbonate buffer (pH 9.4), acetonitrile and dimethyl-sulfoxide (Scheme 1). The addition of the dimethyl-sulfoxide and acetonitrile inhibited the aggregation of the dye and allowed the reaction to proceed to completion. 1 and 2 were purified by semipreparative reverse-phase HPLC and characterized by analytical reverse-phase HPLC and MALDI-TOF-MS.
Scheme 1. Synthesis of IR-783 Conjugated Contrast Agents (1 and 2).

Complexes 3 and 4 were designed for orthogonal modification through isothiocyanate conjugation to the primary amine. The reaction was performed in the dark due to the photo-instability of the IR-783 derivative.
The octanol–water partition coefficients (log P) of 1–4 were measured to determine hydrophobicity of the agents (Table 1). The negative log P values are characteristic of high water solubility, indicating that the introduction of the IR-783 moiety did not significantly impact solubility. As a result, the relaxation and photophysical properties of these complexes could be measured in aqueous solutions.
Table 1. Characterization of IR-783 Conjugated Agents (1 and 2) and Precursors (3 and 4) Including log P and Relaxivity at Low and High Fields.
| Log P | relaxivity 1.41 T (60 MHz)a |
relaxivity 7 T (300 MHz)b |
|||
|---|---|---|---|---|---|
| ionic (mM–1 s–1) | molecular (mM–1 s–1) | ionic (mM–1 s–1) | molecular (mM–1 s–1) | ||
| 1 | –1.8 ± 0.2 | 16.7 ± 0.7 | 50.1 ± 2.1 | 4.8 ± 0.4 | 14.4 ± 1.2 |
| 2 | –1.8 ± 0.2 | 17.5 ± 0.4 | 52.5 ± 1.2 | 4.1 ± 0.3 | 12.4 ± 1.2 |
| 3 | –3.0 ± 0.1 | 13.0 ± 0.1 | 39.0 ± 0.3 | 5.1 ± 0.2 | 15.4 ± 0.6 |
| 4 | –1.9 ± 0.1 | 14.9 ± 0.5 | 45.0 ± 1.5 | 5.2 ± 0.3 | 15.9 ± 0.9 |
37 °C, pH 7.4 10 mM MOPS buffer.
25 °C, pH 7.4 10 mM MOPS buffer.
The relaxivities of 1–3 were measured at pH 7.4 in 10 mM MOPS buffer. The ionic relaxivities of 1 and 2 were determined to be 16.7 ± 0.7 mM–1 s–1 and 17.5 ± 0.4 mM–1 s–1, respectively at 1.41 T (Table 1). The observed ionic relaxivities decreased to 4.8 ± 0.4 mM–1 s–1 for 1 and 4.1 ± 0.3 mM–1 s–1 for 2 at 7 T and are consistent with values obtained from agents generated from similar scaffolds.21,30
The photophysical properties of 1 and 2 were measured at pH 7.4 in 10 mM MOPS buffer and in DMSO (Table 2). The maximum absorption and emission wavelengths were in the range of 767 to 803 nm (typical of IR-783 derivatives) and well within the NIR in vivo imaging window. The quantum yields of 1 and 2 in MOPS buffer are typical of heptamethine dye derivatives, which tend to form higher order aggregates in aqueous solutions and self-quench.33,341 and 2 have large extinction coefficients in both DMSO and aqueous solution. Unlike clinically used indocyanine green, the fluorescence of 1 and 2 has a linear relationship with concentration, indicating that observed fluorescence has a direct relationship with the amount of dye present.35,36
Table 2. Photophysical Properties of 1 and 2.
| λexcitation (nm) |
λemission (nm) |
ϕfl |
ε (M–1cm–1) |
|||||
|---|---|---|---|---|---|---|---|---|
| MOPS | DMSO | MOPS | DMSO | MOPS | DMSO | MOPS | DMSO | |
| 1 | 769 | 786 | 787 | 803 | 0.05 | 0.33 | 1.45 × 1005 | 2.45 × 1005 |
| 2 | 767 | 786 | 785 | 803 | 0.02 | 0.29 | 1.36 × 1005 | 1.93 × 1005 |
Cellular Uptake
Concentration-dependent cellular uptake was determined by incubating MCF7 cells with concentrations of 1–3 that maintain ≥90% cell viability (SI Figures S7 and S8) for 24 h to maximize labeling (SI Figure S9). Both 1 and 2 showed significantly enhanced cell uptake with an approximately 910-fold and 430-fold increase in labeling, respectively, compared to 3 (Figure 2). Complex 1 attains the highest cellular uptake with a maximum of 230 ± 10 fmol Gd(III) per cell with only a 60 μM incubation concentration.
Figure 2.

Concentration-dependent cell labeling in MCF7 cells incubated with 0–100 μM 1–3. Complexes 1 and 2 with the IR-783 derivative achieve significantly higher cell labeling than 3.
This labeling is surprising because although some Gd(III)-based nanoparticle contrast agents have attained over 100 fmol Gd(III) per cell with low incubation concentrations,37−39 small molecule agents typically require incubations in the tens to hundreds of millimolar to achieve comparable cell labeling. Furthermore, the cellular uptake of 1 and 2 represent a significant increase in labeling compared to our previous fluorescein-conjugated agent that uses a similar chelate scaffold indicating that the high cell labeling can be attributed to the IR-783 derivative.30 Confocal micrographs of 1 and 2 showed intracellular accumulation of contrast agent indicating that the labeling is unlikely to be a result of nonspecific binding to the cell membrane (Figure 3). Additionally, the high labeling achieved with 1 allowed the agent to be detected with transmitted laser light (seen as dark spots on the image). This phenomena is likely attributable to light scattering and is frequently observed with nanoparticles.40
Figure 3.

Confocal micrographs of 1 and 2 showing intracellular accumulation of contrast agent. The high labeling of 1 enables detection with transmitted laser light. Scale bar = 25 μm. Red = NIR.
Previously, IR-783 derivatives have been shown to target organic–anion transporting polypeptides (OATPs).41−43 To investigate whether OATPs may be responsible for the excellent cell labeling achieved with 1 and 2, MCF7 cells were incubated with bromosulfopthalein (BSP) (a competitive inhibitor of OATPs) for 30 min prior to agent labeling (Figure 4). Labeling decreased by 3.2-fold for 1 and 2.1-fold for 2 compared to cells that did not receive BSP treatment suggesting that uptake is at least partially mediated by OATPs. An active transport mechanism of cell labeling was further confirmed by incubating cells at 4 °C which resulted in a 59-fold and 14-fold decrease in labeling for 1 and 2, respectively, compared to controls incubated at 37 °C. Overall, these results suggest that the uptake of 1 and 2 is facilitated by an energy-dependent active transport mechanism and is likely at least partially mediated by OATPs.
Figure 4.

Mechanism of cell uptake was investigated by incubating cells with BSP (an inhibitor of OATPs) or 4 °C for 30 min prior to contrast agent labeling. To determine the statistical significance from controls, labeling was compared using an unpaired t test where * p < 0.05, ** p < 0.01, and *** p < 0.001.
In Vivo Fluorescence Imaging
The biodistribution of 1 was evaluated using a xenograft MCF7 tumor model in athymic nude mice. Complex 1 was dissolved in DMSO and injected into the intraperitoneal cavity (n = 12) at a dose of 10 mg/kg. The mice were imaged with near-IR fluorescence imaging 2, 4, 24, and 48 h postinjection. Tumors were visibly distinct by fluorescence imaging with the maximum intensity attained 4 h post-injection (Figure 5A,B). The fluorescence signal significantly decreased at the 24- and 48-h time points, suggesting that the complex is cleared efficiently. This tumor uptake profile differs from other IR-783 derivatives that report maximum fluorescence intensity in subcutaneous tumor models 48 h postinjection and persistence of signal for up to 20 days.41,43 This suggests that conjugation of IR-783 to the Gd(III) chelate scaffold increases clearance from tumors.
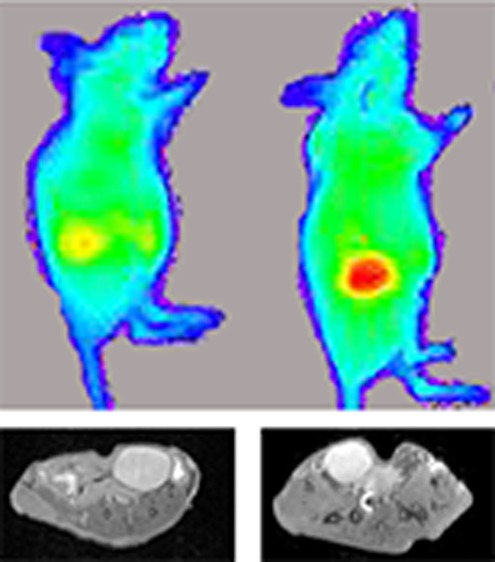
Figure 5.

Near-IR fluorescence images of MCF7 xenograft nude mice were acquired 2, 4, 24, and 48 h after i.p. injection of 1. A: Representative images of mice show accumulation of 1 into the tumor. The maximum fluorescence signal is observed 4 h postinjection. B: Quantitative representation of background subtracted radiant efficiency in the tumors over time. C: Organs were harvested after each time point and imaged ex vivo. These representative images taken 4 h postinjection show the greatest fluorescence intensity in the uterus, kidney, intestine, and tumor. Taken together, these images suggest clearance of the complex over time.
Biodistibution of Complex 1
To further investigate the biodistribution of 1, organs were collected 2, 4, 24, and 48 h postinjection and imaged ex vivo. Representative images of organs harvested at 4 h show significant fluorescence intensity in the uterus, kidneys, intestines, and tumor (Figure 5C). The fluorescence intensity of organs collected at all-time points was plotted and showed that 1 has the greatest accumulation in the liver and intestines followed by the kidneys, tumor, and uterus (SI Figure S10). Accumulation in the uterus is attributed to the i.p. injection method as the uterine tubes open into the peritoneal cavity. While fluorescence imaging can provide some preliminary information regarding biodistribution, this technique is limited by differences in light scattering and absorption between tissue types and the potential for dye quenching. In particular, studies that compare biodistribution by fluorescence and radiolabeling methods have reported attenuated fluorescence signal in the liver and spleen that can lead to inaccurate conclusions regarding biodistribution.44,45
To obtain a quantitative assessment of biodistribution of 1, organs were digested and analyzed for Gd(III) content by ICP-MS (Figure 6). Unlike the fluorescence analysis, Gd(III) content was normalized to the total mass of the tissue and analysis of blood and urine samples was performed. These data show that complex 1 has the highest accumulation in the intestines, urine, and spleen followed by the liver, kidneys, ovaries, and uterus. Accumulation in the spleen and liver is associated with uptake by the reticuloendothelial system (RES) system,46,47 whereas accumulation in the intestines, urine, and kidneys likely indicates clearance of the complex. Uptake of 1 in the tumor was not significantly different than accumulation in the muscle at any time point. All organs except the liver show significantly decreased accumulation of 1 after 48 h compared to the early time points further suggesting clearance of the complex. Taken together, these data suggest that complex 1 is taken up by the RES and eliminated over time possibly by renal, fecal, or hepatic clearance.48
Figure 6.
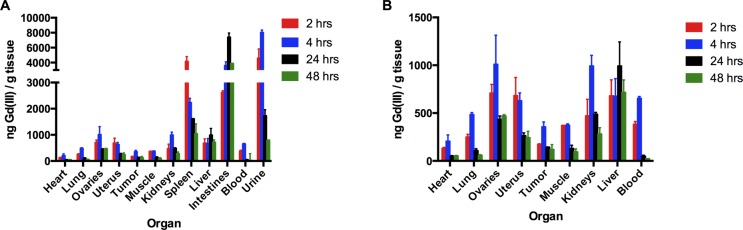
Biodistribution of 1 was determined 2, 4, 24, and 48 h postinjection in MCF7 xenograft nude mice (n = 3 per time point). Briefly, organs, blood, and urine were harvested and acid digested for analysis of Gd(III) content by ICP-MS. These data show the most significant accumulation of 1 occurs in the intestines and urine. Accumulation of 1 decreases over time for all organs except the liver. These data suggest clearance of the complex through the renal system. A: All organs, B: all organs except the spleen, intestines, and urine.
In Vivo MR Imaging
On the basis of the biodistribution and fluorescence imaging data, MR images of xenografted nude mice were acquired 0, 2, 4, and 24 h postinjection of complex 1 (n = 2). Images show significant contrast enhancement in the bladder at all-time points (Figure 7). Contrast-to-noise ratios (CNR) were determined by subtracting the mean intensity of the muscle from the bladder and dividing by the standard deviation of the noise. The highest CNR was obtained 2 h postinjection with a 2.7-fold increase compared to the prescan image. The CNR at 4 and 24 h postinjection was the same with a 1.7-fold increase compared to the prescan. No significant contrast enhancement was observed in the tumors. These images agree with the ICP-MS biodistribution data that shows high accumulation of 1 in the urine and no significant difference in accumulation between the muscle and tumors.
Figure 7.
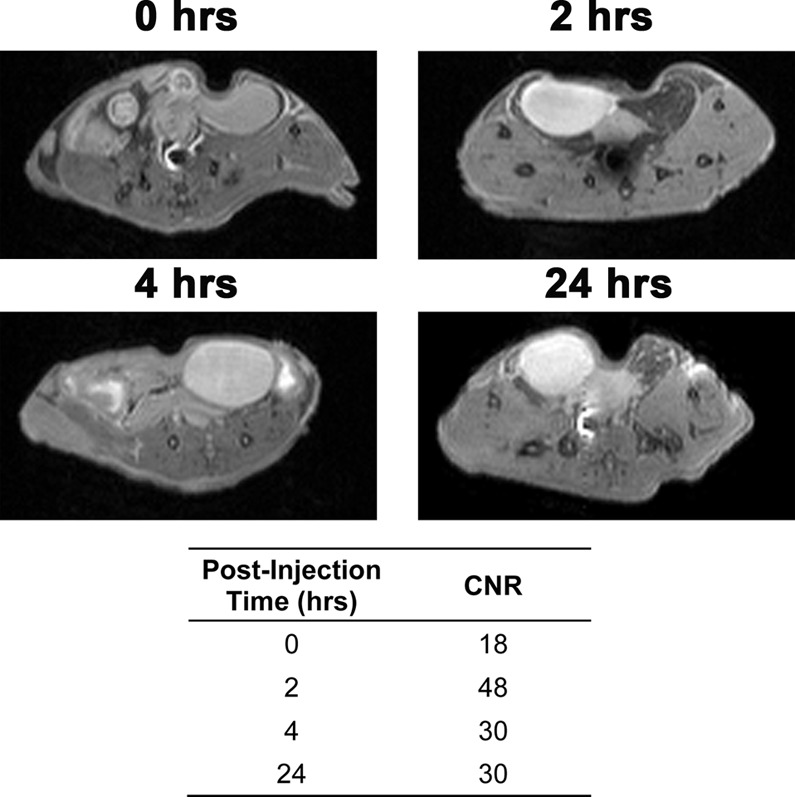
T1-weighted MR images at 9.4 T of MCF7 xenograft nude mice were acquired 0, 2, 4, and 24 h after i.p. injection of 1 (n = 2 per time point). Images show contrast enhancement in the bladder with a 2.7-fold increase in CNR compared to the prescan after 2 h and a 1.7-fold increase after 4 and 24 h.
Conclusions
We have developed two multimeric and multimodal contrast agents containing three Gd(III) chelates conjugated to an IR-783 derivative. One agent was synthesized with a PEG linker (1) while the other contained a short alkyl linker (2). Both agents achieved high cell labeling in cell culture with a maximum of 228 fmol Gd(III) per cell for 1 and 108 fmol Gd(III) per cell for 2. This result is significant because the majority of small molecule agents require incubations in the tens to hundreds of millimolar to achieve labeling of 100+ fmol Gd(III) per cell, whereas our agents were incubated at only 60 μM. Additionally, we found that the labeling occurred via an active transport mechanism likely mediated by OATPs. The biodistribution of complex 1 was investigated in MCF7 xenograft nude mice and showed renal clearance of the agent. Accumulation in the tumors was detected with fluorescence imaging but not MR imaging. To address this issue, synthetic modifications that improve solubility and allow for a higher injection dose or alternate route of administration (i.v. instead of i.p. injection) could be investigated in future work.
Materials and Methods
Synthetic Methods
Unless otherwise noted, materials and solvents were obtained from commercial suppliers and used without further purification. All reactions were performed under an inert nitrogen atmosphere. EMD 60F 254 silica gel plates were used for thin layer chromatography and visualized using UV light or ninhydrin stain. Column chromatography was performed using standard grade 60 Å 230–400 mesh silica gel (Sorbent Technologies). 1H NMR and 13C NMR spectra were obtained at room temperature on a Bruker Avance III 500 MHz NMR spectrometer. An Agilent 6210 LC-TOF spectrometer was used to acquire electrospray ionization mass spectra (ESI–MS). Matrix-Assisted Laser Desorption Ionization Time-Of-Flight (MALDI-TOF) mass spectrometry was carried out using a Bruker Autoflex III MALDI. Semipreparative HPLC was performed on a Waters 19 × 250 mm2 Xbridge C18 Column. Analytical HPLC was performed using a Waters 4.6 × 250 mm2 5 μM Xbridge C18 column using the Varian Prostar 500 system equipped with a Varian 363 fluorescence detector, and a Varian 335 UV–vis Detector.
The amine functionalized Gd(III) scaffold (4) was synthesized according to a literature procedure.30 For a detailed synthetic procedure of the PEG functionalized scaffold (3) and the isothiocyanate functionalized dye (5), see the SI.
N-(2-(2-(2-(2-aminoethoxy)ethoxy)ethoxy)ethyl)-5-(3-(2,4,6)-Tris(1–2(hydroxyl-3-(1H-1,2,3-triazol-1-yl(propyl)-3,7,10-tris(carboxymethyl)-1,4,7,10-tetraazacyclododecylgadolinium(III)phenoxy)-pentanamide- 4-(2-{4-[(4-isothiocyanatophenyl)oxy]-7-[3,3-dimethyl-1-(4-sulfonatobutyl)indolin-2-ylidene]-3,5-(propane-1,3-diyl)-1,3,5-heptatrien-1-yl}-3,3-dimethyl-3H-indolio)butanesulfonate (1)
To a solution of 3 (52.47 mg, 0.023 mmol) in 50 mL pH 9.4 Bicarbonate buffer and 40 mL acetonitrile was added a solution of 5 (78.6 mg, 0.093 mmol) in 10 mL dimethyl sulfoxide. The reaction was covered with aluminum foil, and left to stir for 48 h under nitrogen. The solvent was removed by lyophilization, and the product was purified by reverse phase HPLC, using a C18 column, held at 13% for 5 min and eluting with a gradient of 13% - 22% acetonitrile in pH 10.38 buffered water over 20 min, tr = 19.51 min. This gave 38 mg of the product as a green solid (54% yield). The purity and identity of the product was confirmed using analytical HPLC-MS on a C18 column, held at 10% for 5 min, and eluting with a gradient of 10%–62% acetonitrile in pH 10.38 buffered water over 19 min, tr = 13.55 min. MS (MALDI-TOF): m/z observed = 3083.16 [M + 2H+] m/z calculated = 3082.86 [M + 2H+]
3-(2,4,6)-Tris(1–2(hydroxyl-3-(1H-1,2,3-triazol-1-yl(propyl)-3,7,10-tris(carboxymethyl)-1,4,7,10-tetraazacyclododecylgadolinium(III)phenoxy)-propan-1-amino-4-(2-{4-[(4-isothiocyanatophenyl)oxy]-7-[3,3-dimethyl-1-(4-sulfonatobutyl)indolin-2-ylidene]-3,5-(propane-1,3-diyl)-1,3,5-heptatrien-1-yl}-3,3-dimethyl-3H-indolio)butanesulfonate (2)
To a solution of 4 (46.5 mg, 0.023 mmol) in 8 mL pH 9.4 Bicarbonate buffer and 6 mL acetonitrile was added a solution of 5 (60 mg, 0.071 mmol) in 2 mL dimethyl sulfoxide. The reaction was covered with tinfoil, and allowed to stir for 48 h under nitrogen. The solvent was removed by lyophilization, and the product was purified by reverse phase HPLC (C18 column) held at 13% for 5 min and eluting with a gradient of 13%–22% acetonitrile in pH 10.38 buffered water over 20 min, tr = 16.92 min. This gave 29 mg of the product as a green solid (46% yield). The purity and identity of the product was confirmed using analytical HPLC-MS on a C18 column, held at 10% for 5 min, and eluting with a gradient of 10%–48% acetonitrile in pH 10.38 buffered water over 12.8 min, tr = 13.12 min. MS (MALDI-TOF): m/z observed = 2862.165 [M + 2H+] m/z calculated = 2862.45 [M + 2H+]
Octanol–Water Partition Coefficients
Approximately 1 mg of compound was dissolved in 1 mL of a 1:1 mixture of water:octanol. After vortexing the sample tube for 30 s, the tube was placed on a rotator for gentle mixing over 8 h. The tube was removed from the rotator and allowed to sit for 12 h to ensure complete separation of the aqueous and organic phases. An aliquot was removed from each layer and analyzed by ICP–MS to determine the Gd(III) concentration in each layer. Partition coefficients were calculated from the equation logP = log(Co/Cw), where logP is the logarithm of the partition coefficient, Co is the concentration of Gd in the 1-octanol layer, and Cw is the concentration of Gd in the water layer.
Relaxation Time Measurements at 1.4 T
A 1 mM solution of each gadolinium complex was made up in pH 7.4 10 mM MOPS buffer. These samples were serially diluted four times to give 500 μL of five different sample concentrations. After 30 min of incubation at 37 °C, the T1 and T2 relaxation times were measured on a Bruker mq60 NMR analyzer equipped with Minispec V2.51 Rev.00/NT software (Billerica, MA, U.S.A.) operating at 1.41 T (60 MHz) and 37 °C. Relaxation time determination and analysis was performed as previously described.30
Fluorometric Analysis
The photophysical properties of 1 and 2 were examined in an aqueous solution buffered to pH 7.4 (10 mM MOPS buffer) and DMSO. UV–visible spectra were recorded on an Agilent 8453 spectrophotometer. Steady-state fluorescence emission and excitation spectra were obtained using a Hitachi F-45000 Fluorescence Spectrophotometer. The excitation slit width, emission slit width, and photomultiplier voltages were 5 nm, 5 nm, and 700 V, respectively. Relative fluorescence quantum efficiencies of 1 and 2 were determined by comparing the area under the emission of the sample with that of indocyanine green (ICG) in DMSO (ϕ = 0.13)
Cell Line and Culture
MCF7 (ATCC HTB-22) cells were purchased from American Type Culture Collection (Manassas, VA, U.S.A.) and cultured in phenol red free RPMI-1640 media supplemented with 10% FBS. Cells were grown in a humidified incubator operating at 37 °C and 5.0% CO2 and harvested with 0.25% TrypLE unless otherwise indicated. Cells were allowed to plate for 24 h before all experiments. All agents were filtered with 0.2 μm sterile filters prior to incubation with cells.
Cellular Toxicity
MCF7 cells were seeded at a density of 6000 cells per well in a 96-well plate. Cells were incubated with concentrations of 1 and 2 ranging from 0–80 μM (50 μL volume, 8 concentrations) for 24 h. After incubation, 50 μL of CellTiter-Glo 2.0 (Promega, Madison, WI, U.S.A.) was added to each well and the assay was run according to the manufacturer’s protocol. Luminescence was read on a Synergy 4 Microplate Reader (BioTek, Winooski, VT, U.S.A.). The measured cell viability range was confirmed during each labeling experiment using a Guava EasyCyte Mini Personal Cell Analyzer. An aliquot of cell suspension was mixed with ViaCount solution to obtain a total volume of 200 μL. Samples were counted and viability was measured using Viacount software run according to the manufacturer’s protocol.
Confocal Microscopy
MCF7 cells were seeded at a density of 50,000 cells per plate on a 35 mm FluoroDish (World Precision Instruments, Sarasota, FL, U.S.A.). Cells were incubated with 30 μM 1 and 2 (500 μL) for 24 h. Cells were washed with DPBS (2 × 1 mL) and 500 μL of fresh media was added. Cells were imaged using a Zeiss LSM 510 confocal laser scanning inverted microscope equipped with a mode-locked Mai Tai DeepSee Ti:sapphire two-photon laser (Spectra Physics, Mountain View, CA, U.S.A.) with an excitation wavelength of 780 nm. For all images a Plan-Appochromat 40x/1.20NA water immersion Korr UV–vis–IR M27 objective lens and a 760 nm long pass emission filter was used.
Cellular Uptake
Concentration-dependent uptake was determined in MCF7 cells plated at a density of 30,000 cells per well of a 24-well plate. Complexes 1–3 were dissolved in media at concentrations ranging from 0 to 100 μM and incubated with cells for 24 h. After incubation, cells were washed twice with 0.5 mL DPBS and centrifuged at 1000g for 5 min at 4 °C. The media was aspirated and cells were resuspended in 200 μL media. An aliquot of 50 μL was used for cell counting and 130 μL was used for analysis of Gd(III) content by ICP-MS. For time-dependent uptake, the same procedure was followed except cells were incubated with 20 μM 1–3 for 1, 2, 4, 8, or 24 h.
Mechanism of Uptake
MCF7 cells were plated at a density of 45 000 cells per well of a 24-well plate. Cells were incubated with 180 μL of either blank media (4 or 37 °C) or 250 μM bromosulfophtalein (37 °C) for 30 min prior to the addition of 20 μL of a 10X solution of 1 or 2. Cells were incubated for an additional 4 h then harvested as described in the cell uptake section.
ICP-MS
Quantification of Gd(III) content in solutions, cell suspensions, and liquefied organs was accomplished using ICP-MS. Samples were prepared and analyzed according to previously published procedures.30
MR Imaging of Solutions at 7 T
A 300 μM solution of each gadolinium complex was made up in pH 7.4 10 mM MOPS buffer. These samples were serially diluted three times to give 500 μL of four different sample concentrations. Solutions for determining relaxivity were imaged using a Bruker Pharmscan 7 T imaging spectrometer. Image acquisition and analysis was performed as previously described.30
Tumor Xenograft Model
Female athymic NCr nude mice were purchased from Taconic (Hudson, NY, U.S.A.). The mice were handled and processed according to a protocol approved by Northwestern University Animal Care and Use Committee in accordance with current guidelines from the National Institutes of Health Model Procedure of Animal Care and Use. A 17β-estradiol pellet (Innovative Research of America, Sarasota, FL, 60 day release, 0.18 mg/pellet) was implanted into the nape of the neck of the mice due to their intrinsic low circulating estradiol levels. This pellet ensures the growth of the estrogen-dependent MCF7 cells. Seven days later, 5 × 10⁶ cells were suspended in 1:1 Matrigel/DPBS and injected into the right rear flank of each animal. Mice were monitored for tumor growth every day after inoculation until tumors reached 150–250 mm3. Tumor growth took approximately 2–3 weeks (n = 12, 100% uptake).
In Vivo IVIS Imaging
Xenografted athymic nude mice were injected I.P. with 10 mg/kg of complex 1 dissolved in 100% DMSO (40 μL injection volume). Images were acquired 2 (n = 12), 4 (n = 9), 24 (n = 6), and 48 (n = 3) hours postinjection on an IVIS Spectrum (PerkinElmer, Waltham, MA, U.S.A.) using an excitation wavelength of 745 nm and emission of 810 nm. During imaging, mice were held under 1–3% inhaled isoflurane anesthesia. Mice were allowed to recover between imaging time points. Images were processed using Living Image software, where ROI’s corresponding to the tumor and background signal intensity were used to determine background subtracted radiant efficiency in the tumors.
In Vivo MR Imaging
A subset of mice that underwent IVIS imaging was also imaged with MRI immediately after the corresponding IVIS imaging session. Images were acquired at baseline and 2 (n = 2), 4 (n = 4), and 24 (n = 2) hours post injection on a 9.4 T Bruker Biospec (Bruker Biospin, Billerica, MA, U.S.A.) using a 38 mm quadrature mouse body volume coil. T1 weighted rapid spin echo (RARE) images were acquired with TR/TE = 1500 ms/4.9 ms, field of view 3.5 × 3.5 cm2, matrix 128 × 128, 0.7 mm slice thickness, 19 slices, and 1 average. During imaging, mice were held under 1–2% inhaled isoflurane anesthesia and respiration was monitored using an SA Instruments MR compatible monitoring system (SA Instruments, Stonybrook, NY, U.S.A.). Mice were allowed to recover between imaging time points. Images were processed using JIM 6 software (Xinapse Systems, Essex, U.K.). Contrast to noise ratios were measured by placing signal regions of interest in the paraspinal skeletal muscle and the bladder, and a noise region in the corner of the image, subtracting muscle signal from bladder signal, and dividing by the standard deviation of the noise.
Biodistribution
Mice were injected I. P. with 10 mg/kg of complex 1. Organs were harvested 2, 4, 24, and 48 h postinjection (n = 3 per time point). Organs were imaged on the IVIS using excitation of 745 nm and emission of 810 nm. Living Image software was used to draw ROIs around each organ and calculate the average radiant efficiency.
Following ex vivo imaging, organs were digested and analyzed for Gd(III) content by ICP-MS. The heart, lungs, ovaries, uterus, kidneys, muscle, and tumors were placed into preweighed Teflon tubes, weighed, and dissolved in 9:1 ACS reagent grade nitric acid/hydrogen peroxide(1 mL for kidneys, 500 μL for remaining organs). The solutions were digested using an EthosEZ microwave digestion system (Milestone, Shelton, CT, U.S.A.) with a 120 °C ramp for 30 min followed by a 30 min hold and a 45 min exhaust cycle. The livers and intestines were placed into preweighed TFM vessels, weighed, and dissolved in 9:1 ACS reagent grade nitric acid: hydrogen peroxide (10 mL). The resultant solutions were weighed and an aliquot was transferred to a preweighed 15 mL conical tube. The final ICP-MS sample was prepared as described above in the ICP-MS procedure.
Acknowledgments
This work was supported by the National Institutes of Health (NIH Grants R01EB005866 and P01HL108795) and by a National Science Foundation Graduate Research Fellowship (C.C.). Animal studies were performed with the assistance of the Center for Developmental Therapeutics at Northwestern University. Imaging was performed at the Northwestern University Center for Advanced Molecular Imaging generously supported by NCI CCSG P30 CA060553 awarded to the Robert H. Lurie Comprehensive Cancer Center. Metal analysis was performed at the Northwestern University Quantitative Bioelemental Imaging Center generously supported by NASA Ames Research Center NNA06CB93G.
Supporting Information Available
Synthetic procedures, r2, cell viability, time-dependent uptake, and fluorescence biodistribution. The Supporting Information is available free of charge on the ACS Publications website at DOI: 10.1021/jacs.5b04509.
Author Contributions
V.S.R.H. and C.E.C. contributed equally to this work.
The authors declare no competing financial interest.
Supplementary Material
References
- Modo M.; Cash D.; Mellodew K.; Williams S. C.; Fraser S. E.; Meade T. J.; Price J.; Hodges H. Neuroimage 2002, 17, 803. [PubMed] [Google Scholar]
- Kraitchman D. L.; Bulte J. W. Basic Res. Cardiol. 2008, 103, 105. [DOI] [PMC free article] [PubMed] [Google Scholar]
- Modo M.; Mellodew K.; Cash D.; Fraser S. E.; Meade T. J.; Price J.; Williams S. C. Neuroimage 2004, 21, 311. [DOI] [PubMed] [Google Scholar]
- Sukerkar P. A.; MacRenaris K. W.; Meade T. J.; Burdette J. E. Mol. Pharmaceutics 2011, 8, 1390. [DOI] [PMC free article] [PubMed] [Google Scholar]
- Sukerkar P. A.; MacRenaris K. W.; Townsend T. R.; Ahmed R. A.; Burdette J. E.; Meade T. J. Bioconjugate Chem. 2011, 22, 2304. [DOI] [PMC free article] [PubMed] [Google Scholar]
- Louie A. Y.; Hüber M. M.; Ahrens E. T.; Rothbächer U.; Moats R.; Jacobs R. E.; Fraser S. E.; Meade T. J. Nat. Biotechnol. 2000, 18, 321. [DOI] [PubMed] [Google Scholar]
- Strauch R. C.; Mastarone D. J.; Sukerkar P. A.; Song Y.; Ipsaro J. J.; Meade T. J. J. Am. Chem. Soc. 2011, 133, 16346. [DOI] [PMC free article] [PubMed] [Google Scholar]
- Moats R. A.; Fraser S. E.; Meade T. J. Angew. Chem., Int. Ed. Engl. 1997, 36, 726. [Google Scholar]
- Caravan P. Chem. Soc. Rev. 2006, 35, 512. [DOI] [PubMed] [Google Scholar]
- Verwilst P.; Park S.; Yoon B.; Kim J. S. Chem. Soc. Rev. 2015, 44, 1791. [DOI] [PubMed] [Google Scholar]
- Frullano L.; Meade T. J. J. Biol. Inorg. Chem. 2007, 12, 939. [DOI] [PubMed] [Google Scholar]
- Sevick-Muraca E. Annu. Rev. Med. 2012, 63, 217. [DOI] [PubMed] [Google Scholar]
- Frangioni J. V. Curr. Opin. Chem. Biol. 2003, 7, 626. [DOI] [PubMed] [Google Scholar]
- Mulder W. J.; Griffioen A. W.; Strijkers G. J.; Cormode D. P.; Nicolay K.; Fayad Z. A. Nanomedicine 2007, 2, 307. [DOI] [PubMed] [Google Scholar]
- Lee D.-E.; Koo H.; Sun I.-C.; Ryu J. H.; Kim K.; Kwon I. C. Chem. Soc. Rev. 2012, 41, 2656. [DOI] [PubMed] [Google Scholar]
- Alexis F.; Pridgen E.; Molnar L. K.; Farokhzad O. C. Mol. Pharmaceutics 2008, 5, 505. [DOI] [PMC free article] [PubMed] [Google Scholar]
- Rivas C.; Stasiuk G. J.; Gallo J.; Minuzzi F.; Rutter G. A.; Long N. J. Inorg. Chem. 2013, 52, 14284. [DOI] [PMC free article] [PubMed] [Google Scholar]
- Rivas C.; Stasiuk G. J.; Sae-Heng M.; Long N. J. Dalton Trans. 2015, 44, 4976. [DOI] [PubMed] [Google Scholar]
- Huber M. M.; Staubli A. B.; Kustedjo K.; Gray M. H. B.; Shih J.; Fraser S. E.; Jacobs R. E.; Meade T. J. Bioconjugate Chem. 1998, 9, 242. [DOI] [PubMed] [Google Scholar]
- Mishra A.; Pfeuffer J.; Mishra R.; Engelmann J.; Mishra A. K.; Ugurbil K.; Logothetis N. K. Bioconjugate Chem. 2006, 17, 773. [DOI] [PubMed] [Google Scholar]
- Carney C. E.; MacRenaris K. W.; Mastarone D. J.; Kasjanski D. R.; Hung A. H.; Meade T. J. Bioconjugate Chem. 2014, 25, 945. [DOI] [PMC free article] [PubMed] [Google Scholar]
- Zhang X.; Jing X.; Liu T.; Han G.; Li H.; Duan C. Inorg. Chem. 2012, 51, 2325. [DOI] [PubMed] [Google Scholar]
- Jang J. H.; Bhuniya S.; Kang J.; Yeom A.; Hong K. S.; Kim J. S. Org. Lett. 2013, 15, 4702. [DOI] [PubMed] [Google Scholar]
- Iwaki S.; Hokamura K.; Ogawa M.; Takehara Y.; Muramatsu Y.; Yamane T.; Hirabayashi K.; Morimoto Y.; Hagisawa K.; Nakahara K.; Mineno T.; Terai T.; Komatsu T.; Ueno T.; Tamura K.; Adachi Y.; Hirata Y.; Arita M.; Arai H.; Umemura K.; Nagano T.; Hanaoka K. Org. Biomol. Chem. 2014, 12, 8611. [DOI] [PubMed] [Google Scholar]
- Heffern M. C.; Matosziuk L. M.; Meade T. J. Chem. Rev. 2013, 114, 4496. [DOI] [PMC free article] [PubMed] [Google Scholar]
- Ferreira M. F.; Pereira G.; Martins A.; Martins C. I.; Prata M.; Petoud S.; Toth E.; Ferreira P. M.; Martins J.; Geraldes C. F. Dalton Trans. 2014, 43, 3162. [DOI] [PubMed] [Google Scholar]
- Bonnet C. S.; Tóth É. C. R. Chim. 2010, 13, 700. [Google Scholar]
- Yamane T.; Hanaoka K.; Muramatsu Y.; Tamura K.; Adachi Y.; Miyashita Y.; Hirata Y.; Nagano T. Bioconjugate Chem. 2011, 22, 2227. [DOI] [PubMed] [Google Scholar]
- Guo K.; Berezin M. Y.; Zheng J.; Akers W.; Lin F.; Teng B.; Vasalatiy O.; Gandjbakhche A.; Griffiths G. L.; Achilefu S. Chem. Commun. 2010, 46, 3705. [DOI] [PMC free article] [PubMed] [Google Scholar]
- Harrison V. S. R.; Carney C. E.; Macrenaris K. W.; Meade T. J. Chem. Commun. 2014, 50, 11469. [DOI] [PMC free article] [PubMed] [Google Scholar]
- Song F.; Peng X.; Lu E.; Zhang R.; Chen X.; Song B. J. Photochem. Photobiol., A 2004, 168, 53. [Google Scholar]
- Flanagan J. H.; Khan S. H.; Menchen S.; Soper S. A.; Hammer R. P. Bioconjugate Chem. 1997, 8, 751. [DOI] [PubMed] [Google Scholar]
- Li C.; Greenwood T. R.; Bhujwalla Z. M.; Glunde K. Org. Lett. 2006, 8, 3623. [DOI] [PubMed] [Google Scholar]
- Patonay G.; Antoine M. D.; Devanathan S.; Strekowski L. Appl. Spectrosc. 1991, 45, 457. [Google Scholar]
- Yuan B.; Chen N.; Zhu Q. J. Biomed. Opt. 2004, 9, 497. [DOI] [PMC free article] [PubMed] [Google Scholar]
- Maarek J.-M. I.; Holschneider D. P.; Harimoto J. J. Photochem. Photobiol., B 2001, 65, 157. [DOI] [PubMed] [Google Scholar]
- Hung A. H.; Holbrook R. J.; Rotz M. W.; Glasscock C. J.; Mansukhani N. D.; MacRenaris K. W.; Manus L. M.; Duch M. C.; Dam K. T.; Hersam M. C.; Meade T. J. ACS Nano 2014, 8, 10168. [DOI] [PMC free article] [PubMed] [Google Scholar]
- Guenoun J.; Koning G. A.; Doeswijk G.; Bosman L.; Wielopolski P. A.; Krestin G. P.; Bernsen M. R. Cell Transplant. 2012, 21, 191. [DOI] [PubMed] [Google Scholar]
- Sitharaman B.; Tran L. A.; Pham Q. P.; Bolskar R. D.; Muthupillai R.; Flamm S. D.; Mikos A. G.; Wilson L. J. Contrast Media Mol. Imaging 2007, 2, 139. [DOI] [PubMed] [Google Scholar]
- Sun W.; Wang G. F.; Fang N.; Yeung E. S. Anal. Chem. 2009, 81, 9203. [DOI] [PubMed] [Google Scholar]
- Xiao L.; Zhang Y.; Yue W.; Xie X. Z.; Wang J. P.; Chordia M. D.; Chung L. W. K.; Pan D. F. Nucl. Med. Biol. 2013, 40, 351. [DOI] [PMC free article] [PubMed] [Google Scholar]
- Yang X.; Shi C.; Tong R.; Qian W.; Zhau H. E.; Wang R.; Zhu G.; Cheng J.; Yang V. W.; Cheng T.; Henary M.; Strekowski L.; Chung L. W. Clin. Cancer Res. 2010, 16, 2833. [DOI] [PMC free article] [PubMed] [Google Scholar]
- Zhang C.; Liu T.; Su Y.; Luo S.; Zhu Y.; Tan X.; Fan S.; Zhang L.; Zhou Y.; Cheng T.; Shi C. Biomaterials 2010, 31, 6612. [DOI] [PubMed] [Google Scholar]
- Liu Y.; Tseng Y. C.; Huang L. Pharm. Res. 2012, 29, 3273. [DOI] [PMC free article] [PubMed] [Google Scholar]
- Yang K.; Wan J. M.; Zhang S. A.; Zhang Y. J.; Lee S. T.; Liu Z. A. ACS Nano 2011, 5, 516. [DOI] [PubMed] [Google Scholar]
- Chen H. W.; Wang L. Y.; Yeh J.; Wu X. Y.; Cao Z. H.; Wang Y. A.; Zhang M. M.; Yang L.; Mao H. Biomaterials 2010, 31, 5397. [DOI] [PMC free article] [PubMed] [Google Scholar]
- Nie S. M. Nanomedicine 2010, 5, 523. [DOI] [PMC free article] [PubMed] [Google Scholar]
- Longmire M.; Choyke P. L.; Kobayashi H. Nanomedicine 2008, 3, 703. [DOI] [PMC free article] [PubMed] [Google Scholar]
Associated Data
This section collects any data citations, data availability statements, or supplementary materials included in this article.