

Abstract
Study Objectives:
Mandibular advancement splints (MAS) are an effective treatment for obstructive sleep apnea (OSA); however, therapeutic response is variable. Younger age, female gender, less obesity, and milder and supine-dependent OSA have variably been associated with treatment success in relatively small samples. Our objective was to utilize a large cohort of MAS treated patients (1) to compare efficacy across patients with different phenotypes of OSA and (2) to assess demographic, anthropometric, and polysomnography variables as treatment response predictors.
Methods:
Retrospective analysis of MAS-treated patients participating in clinical trials in sleep centers in Sydney, Australia between years 2000–2013. All studies used equivalent customized two-piece MAS devices and treatment protocols. Treatment response was defined as (1) apnea-hypopnea index (AHI) < 5/h, (2) AHI < 10/h and ≥ 50% reduction, and (3) ≥ 50% AHI reduction.
Results:
A total of 425 patients (109 female) were included (age 51.2 ± 10.9 years, BMI 29.2 ± 5.0 kg/m2). MAS reduced AHI by 50.3% ± 50.7% across the group. Supine-predominant OSA patients had lower treatment response rates than non-positional OSA (e.g., 36% vs. 59% for AHI < 10/h). REM-predominant OSA showed a lower response rate than either NREM or non-stage dependent OSA. In prediction modelling, age, baseline AHI, and anthropometric variables were predictive of MAS treatment outcome but not OSA phenotype. Gender was not associated with treatment outcome.
Conclusions:
Lower MAS treatment response rates were observed in supine and REM sleep. In a large sample, we confirm that demographic, anthropometric, and polysomnographic data only weakly inform about MAS efficacy, supporting the need for alternative objective prediction methods to reliably select patients for MAS treatment.
Citation:
Sutherland K, Takaya H, Qian J, Petocz P, Ng AT, Cistulli PA. Oral appliance treatment response and polysomnographic phenotypes of obstructive sleep apnea. J Clin Sleep Med 2015;11(8):861–868.
Keywords: obstructive sleep apnea, oral appliance, polysomnography, treatment response
Oral appliances, specifically mandibular advancement splints (MAS), are an effective treatment for obstructive sleep apnea (OSA).1,2 MAS hold the mandible in protruded position to increase upper airway patency and reduce collapsibility.3 MAS are currently recommended as first-line therapy for mild-moderate OSA and in severe OSA only when continuous positive airway pressure (CPAP) treatment fails or is refused.4 However, growing evidence suggests that health outcomes, at least in the short term, are comparable between these two treatment modalities. This is even observed in severe OSA, which may be attributable to greater adherence to MAS therapy compared to CPAP, circumventing lower average efficacy.5 Although MAS significantly reduces OSA in the majority of patients, around one-third will show negligible improvement.1 Hence, prediction of treatment outcome is highly desirable; however, currently there is no validated method based on clinical characteristics that can achieve this in a reliable way. This remains a major clinical barrier to therapy.
BRIEF SUMMARY
Current Knowledge/Study Rationale: Not all OSA patients respond to oral appliance therapy and predictors such as younger age, less obesity, female gender, milder OSA, and supine-dependent OSA have variously been associated with treatment success. Readily available demographic, anthropometric, and polysomnographic patient data may provide a simple means to triage patients for this form of therapy and requires investigation in large datasets.
Study Impact: In an analysis of a large cohort of patients treated with oral appliance through clinical trials, we find lower treatment response rates in supine and REM sleep. We confirm that patient characteristics of younger age and less obesity (but not gender) are associated with treatment response, but these prediction models do not have sufficient accuracy for clinical practice, and hence alternative prediction methods are needed, particularly as up to a quarter of severe patients could be completely treated by this therapy alone.
Understanding of the phenotype of patients responsive to MAS treatment could help improve patient selection. Various predictors have previously been associated with treatment response such as younger age, less obesity, and female gender.6–8,9,10 However, patient samples identifying such factors are often small and the findings variable, and prospective validation studies are lacking. Polysomnographic phenotypes such as lower AHI6 and supine-dependent OSA have been associated with better MAS treatment response,11,12, and anecdotally REM-related OSA may respond less well to MAS. However, this has not been investigated.
In addition to OSA severity and body position dependency, polysomnography provides additional disease characteristics such as sleep stage effects and extent of upper airway collapse (apnea vs. hypopnea), which have not been previously explored in relation to MAS. Many patients undergo polysomnography in OSA diagnosis, and such predictors in addition to simple demographic and anthropometric characteristics may be a simple and clinically applicable means to recommend MAS therapy in appropriate patients.
Hence, our objectives were to interrogate a large dataset of MAS-treated patients to: (1) assess relationships between polysomnographic phenotypes (e.g., OSA severity, body position, sleep stage dependency, and extent of upper airway collapse) and treatment efficacy; and (2) develop prediction models of MAS treatment response derived from simple demographic, anthropometric, and polysomnographic characteristics.
METHODS
Participants
This is a retrospective analysis of polysomnographic data collected within MAS research studies from sleep centers in Sydney, Australia between 2000 and 2013.3,5,10,13–24 All studies had appropriate IRB approval, and informed consent was obtained from all participants. Studies varied in design and outcomes; however, all used equivalent MAS device design and treatment protocols, with objective verification of treatment response by in-laboratory polysomnography (supplemental material). A further strength of this dataset is that inclusion/exclusion criteria were equivalent in all studies, with minimal exclusion criteria imposed on patients undergoing oral appliance treatment. Inclusion criteria in all study protocols were adult patients (> 18–20 years of age) with apnea-hypopnea index (AHI) > 10/h and ≥ 2 OSA symptoms (e.g., snoring, fragmented sleep, witnessed apneas, daytime sleepiness). Exclusion was limited to MAS contraindications (periodontal disease, insufficient teeth, temporomandibular joint dysfunction) and also predominantly central sleep apnea, need for immediate therapy (e.g., sleepy drivers, due to the acclimatization period before optimal therapy), psychiatric or lung disease, and narcotic or sedative use. Importantly, no restrictions on AHI or BMI were included in any of the studies. Therefore, a wide range of OSA severity and obesity levels were obtained which would not impose limits investigation of these factors in relation to treatment response. Overall, recruited patients were representative of the general sleep clinic population in terms of clinical characteristics.
MAS Treatment Protocol
MAS device design was consistent across all studies: a customized two-piece appliance, with vertical extensions holding the lower plate with desired advancement level provided by lateral ramps on the upper plate (SomnoDent MAS, SomnoMed Ltd, Australia). MAS treatment protocols were identical in all studies. The degree of mandibular advancement generally has a dose-response relationship with therapeutic benefit25–27; however, a patient must still be able to tolerate advancement position. Across our studies, MAS was incrementally titrated to the maximal comfortable limit of advancement over a 4- to 6-week acclimatization period, which was confirmed by the treating dentist. This was assumed to be the level of mandibular advancement to offer maximal therapeutic benefit, and efficacy was assessed at this protrusive level.
Polysomnographic Phenotypes and Treatment Response Definitions
Baseline polysomnography was used to classify patients into phenotypes of sleep stage and body position dependency (data excluded if < 15 min supine or REM sleep observed during the study). Positional phenotypes investigated were: (1) supine-predominant (AHIsupine:AHInon-supine ratio ≥ 2), (2) supine-isolated (AHIsupine:AHInon-supine ratio > 2 and AHInon-supine < 5/h), and (3) non-positional (AHIsupine:AHInon-supine ratio < 2). Sleep stage phenotypes were: (1) REM-predominant (AHIREM:AHINREM ratio ≥ 2), (2) NREM-predominant (AHIREM:AHINREM ratio < 0.5), and (3) stage-independent AHIREM:AHINREM ratio 0.5–2).28 Extent of upper airway collapsibility was also investigated by the relative occurrence of apneas versus hypopneas. Defined phenotypes were: (1) apnea-predominant (apnea index [AI]: hypopnea index [HI] ratio ≥ 2), (2) hypopnea-predominant (AI:HI ratio < 0.5), and (3) Both apnea-hypopnea (AI:HI ratio 0.5–2). OSA severity classifications were mild (AHI 5–14.9/h), moderate (AHI 15–29.9/h), or severe (AHI > 30/h).
Sleep studies were scored using the following apnea and hypopnea definitions. Apnea was defined as cessation of airflow > 10 seconds. Hypopnea was defined as airflow reduction > 50% of baseline measurement > 10 sec with accompanying oxygen desaturation (> 3%) and/or arousal. Treatment response was defined using AHI data from polysomnography with MAS in situ. Three response definitions were investigated to match commonly used definitions: (1) treatment AHI < 5/h or complete resolution of OSA (definition 1), (2) treatment AHI < 10/h plus ≥ 50% reduction in AHI from baseline or complete-very mild residual OSA (definition 2), and (3) ≥ 50% reduction in AHI from baseline only (definition 3). Apnea-hypopnea indices based on total, supine, REM, or NREM sleep times were used as appropriate.
Statistical Analysis
Statistical analysis was performed using SPSS (Version 21.0, IBM Corporation) and CART Extended Edition (Version 6.0, Salford systems, San Diego, California, USA) software. Baseline and MAS data were compared by paired t-test. Responders and non-responders were compared by independent t-test. Responder proportions between OSA phenotypes were assessed by χ2 and z-test. Demographic, anthropometric, and polysomnographic data were considered in predictive models for MAS treatment response using logistic regression and classification and regression tree (CART)29 analysis methods (supplemental material).
RESULTS
Patient Characteristics and MAS Treatment Response
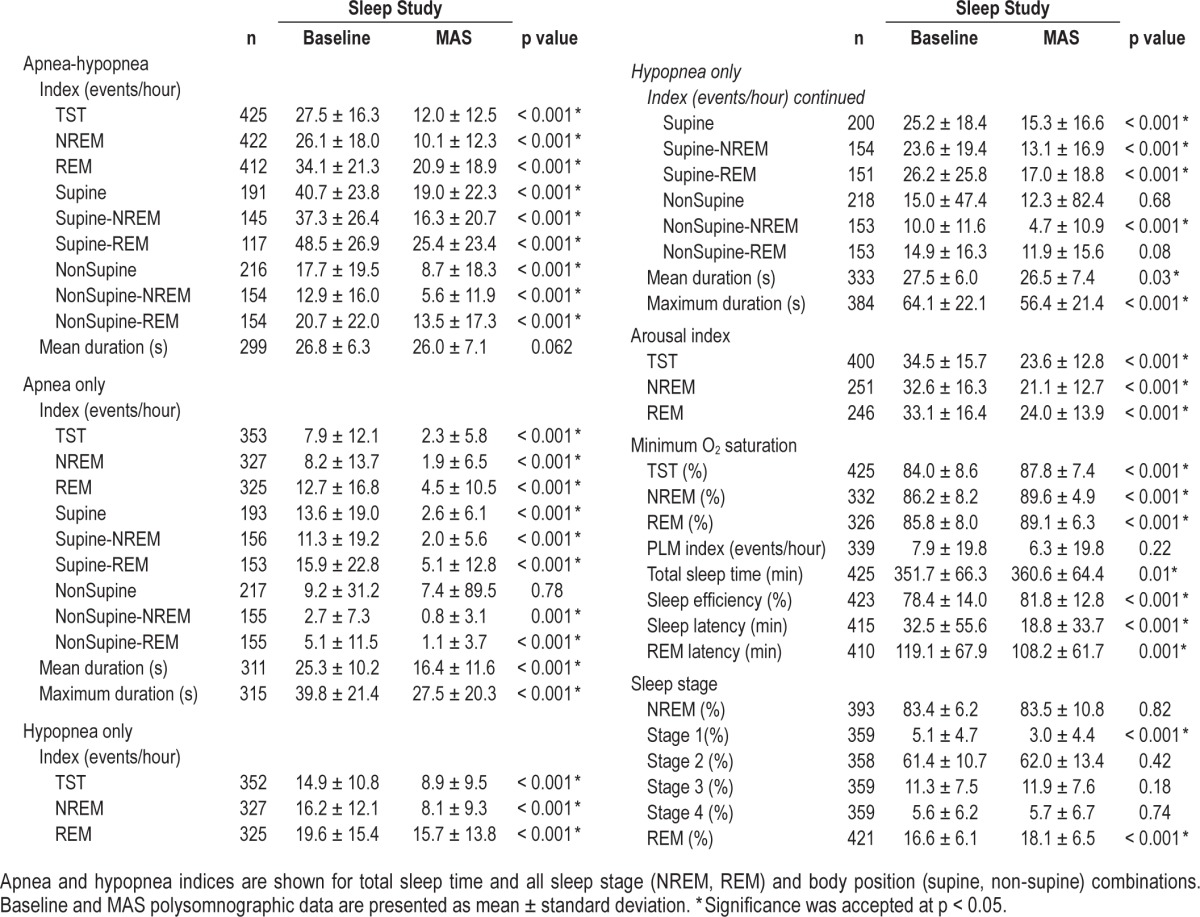
Demographic and anthropometric characteristics of the patient sample are shown in Table 1 (n = 425). Patients were predominantly male, middle-aged, and overweight. Females (n = 109) were older than males. MAS treatment improved polysomnographic indices (Table 2). An average 50% reduction in total AHI was observed with similar improvements across NREM and REM supine and non-supine sleep. MAS reduced apnea and hypopnea duration and arousal index and increased minimum oxygen saturation and REM sleep duration.
Table 1.
Demographic and anthropometric characteristics of the OSA patients undergoing mandibular advancement splint (MAS) treatment.
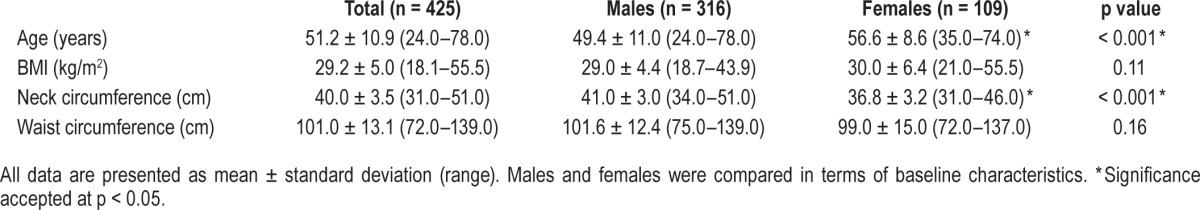
Table 2.
Polysomnographic indices at baseline and with mandibular advancement splint (MAS) treatment.
Treatment response rates are shown in Figure 1. Thirty-seven percent of patients achieved AHI < 5/h (definition 1); 52% achieved AHI < 10/h (definition 2); and 64% reduced AHI by ≥ 50% (definition 3). Although response rates were lower in severe patients, the majority (70%) had at ≥ 50% AHI reduction, and 42% achieved a treatment AHI < 10/h, with approximately half (23%) showing complete resolution of OSA.
Figure 1. Mandibular advancement splint (MAS) treatment response.
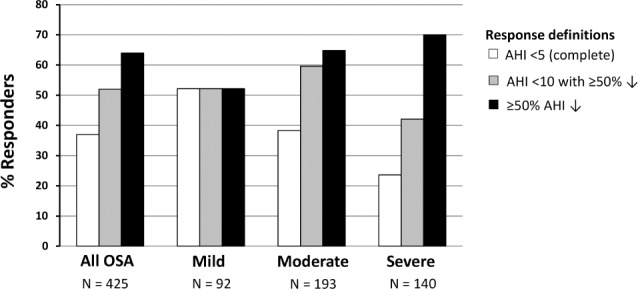
Treatment response was assessed by three definitions: (1) complete response or AHI < 5/h with MAS; (2) AHI < 10/h plus > 50% AHI reduction from baseline; (3) > 50% reduction from baseline. Response rates are shown for all patients as well as subgroups of mild (AHI 5–14.9/h), moderate (AHI 15–29.9/h) and severe (AHI > 30/h) OSA.
Sleep Stage Phenotype and MAS Treatment Response
MAS reduced AHI across all sleep stages, with the exception of increased AHIREM in NREM-predominant patients (Figure 2). In stage-independent OSA, MAS reduced AHINREM more than AHIREM (60.5% ± 40.6% vs. 33.8% ± 57.8% AHI decrease). REM-predominant OSA showed lower response rate than other sleep stage phenotypes (Figure 2). Complete resolution of REM-OSA was only observed in 12% of patients, significantly lower than other phenotypes (42% NREM and 32% non-stage dependent). REM-predominant patients were more likely female (44% vs. 19% NREM and 5% stage-independent, p < 0.001) and showed more obesity (BMI 30.0 ± 5.3 vs. 28.9 ± 4.9 kg/m2, p < 0.05).
Figure 2. Sleep stage phenotypes and mandibular advancement splint (MAS) efficacy.
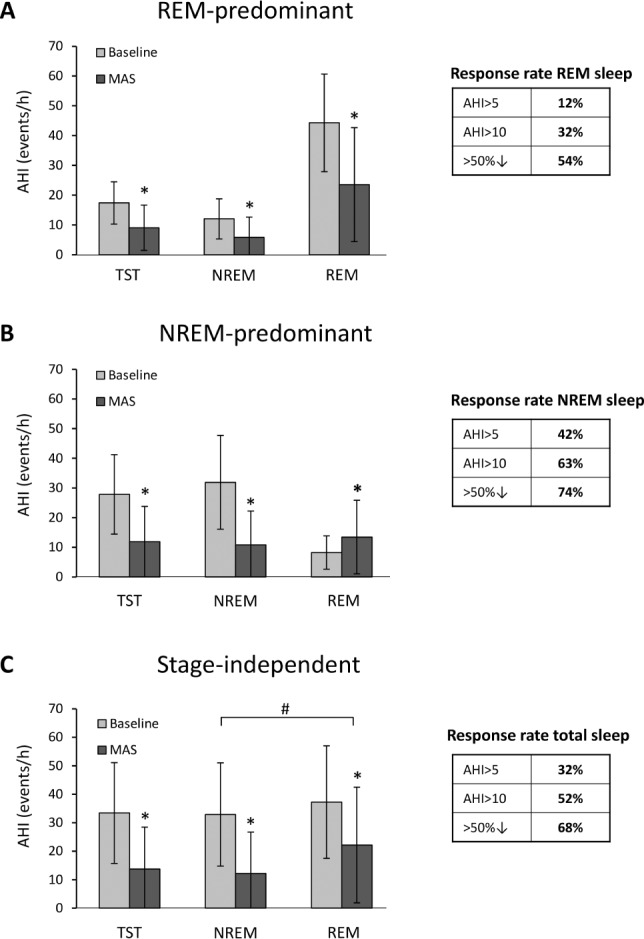
OSA patients were classified as A: REM-predominant (n = 133), B: NREM-predominant (n = 73) or C: stage-independent (n = 198) phenotypes. Response rates are shown for each OSA phenotype using three definitions of response: AHI > 5 (treatment AHI < 5/h), AHI > 10 (treatment AHI < 10/h with ≥ 50% reduction from baseline AHI) and > 50% (≥ 50% AHI reduction from baseline). *p < 0.001 Baseline AHI vs. MAS AHI. #p < 0.001 change in NREM-AHI vs. change in REM-AHI.
Body Position Phenotype and MAS Treatment Response
MAS reduced AHI in both supine and lateral body position, with the exception of increased AHINon-Supine in Supine-isolated patients (Figure 3). In non-positional OSA, MAS reduced AHINon-Supine more than AHISupine (57.4 ± 122.1 vs. 20.1 ± 159.1 % AHI decrease). Non-positional OSA showed double the complete response rate of the Supine-predominant groups (44% vs. 20–22% p < 0.05, Figure 3). MAS did not change supine or non-supine sleep duration (data not shown). Patients with supine-related OSA had a lower BMI than the non-positional patients (28.8 ± 4.7 vs. 29.4 ± 5.7, p = 0.01).
Figure 3. Body position phenotypes and mandibular advancement splint (MAS) efficacy.
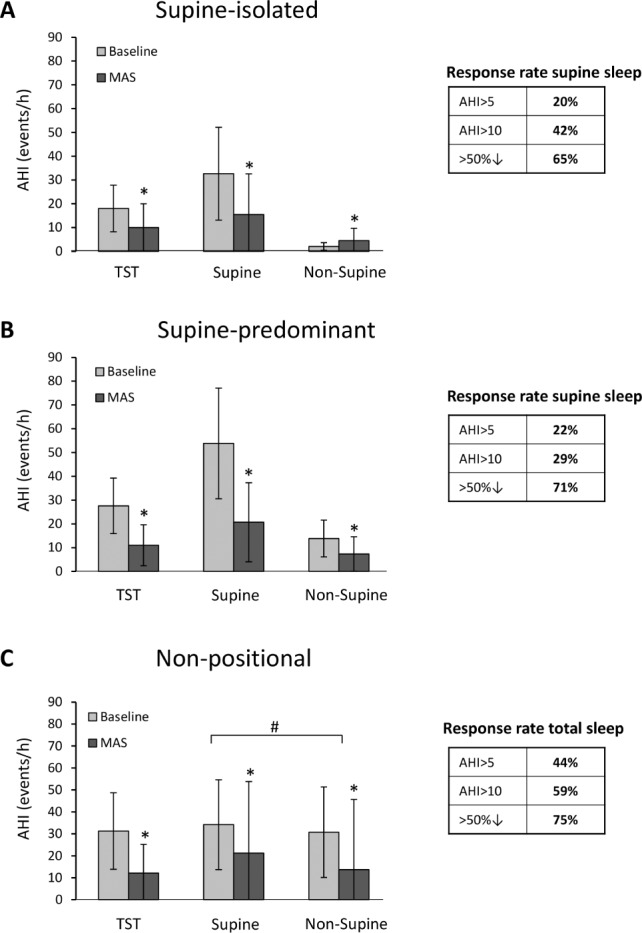
OSA patients were classified as A: Supine-isolated (n = 55), B: Supine-predominant (n = 83) or C: non-positional (n = 61) phenotypes. Response rates are shown for each OSA phenotype using three definitions of response: AHI > 5 (treatment AHI < 5/h), AHI > 10 (treatment AHI < 10/h with ≥ 50% reduction from baseline AHI) and > 50% (≥ 50% AHI reduction from baseline). *p < 0.01 Baseline AHI vs. MAS AHI. #p < 0.001 change in Supine-AHI vs. change in Non-Supine-AHI.
Extent of Upper Airway Collapse (Apnea vs. Hypopnea) and MAS Treatment Response
The apnea-predominant OSA group showed an overall increase in hypopnea index with MAS (Figure 4A). Equivalent reductions in AHI, apnea index, and hypopnea index were seen in hypopnea-predominant and intermittent apnea-hypopnea patients (Figure 4B, 4C). In patients with equivalent frequencies of apnea and hypopnea, there was a greater decrease in apnea compared to hypopnea index (80.3 ± 37.8% vs. 10.2 ± 99.9%, p < 0.001). However, there was no overall difference in treatment response rates between these phenotype groups.
Figure 4. Extent of upper airway collapse (apnea vs. hypopnea) and mandibular advancement splint (MAS) efficacy.
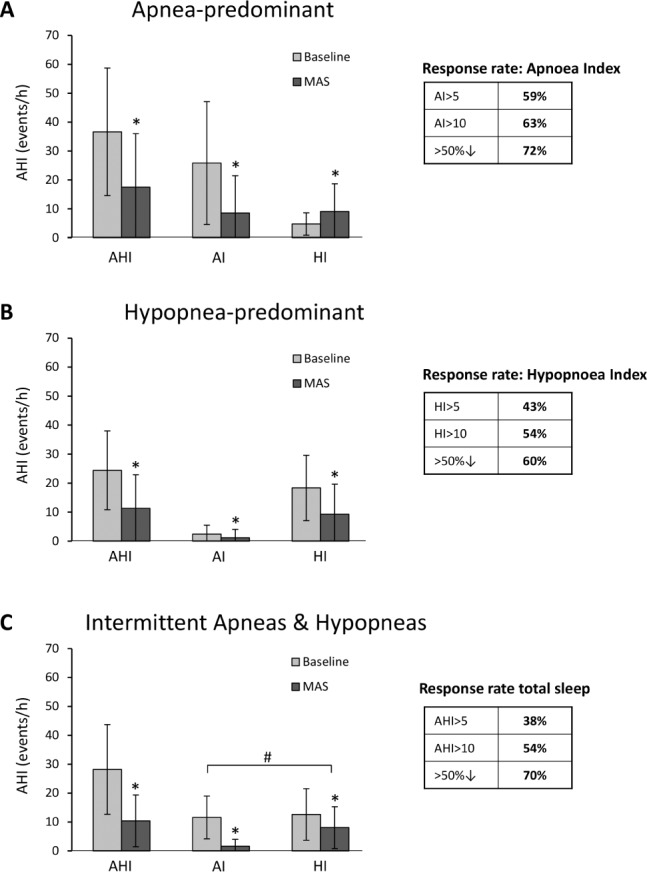
OSA patients were classified as A: Apnea-predominant (n = 46), B: Hypopnea-predominant (n = 216) or C: Intermittent Apnea/Hypopnea (n = 92). Response rates are shown for each OSA phenotype using three definitions of response: AHI/AI/HI > 5 (treatment AHI/AI/HI < 5/h), AHI/AI/HI > 10 (treatment AHI < 10/h with ≥ 50% reduction from baseline AHI) and > 50% (≥ 50% AHI/AI/HI reduction from baseline).*p < 0.01 Baseline AHI/AI/HI vs. MAS AHI/AI/HI. #p < 0.001 change in Apnea Index vs. Hypopnea Index.
Prediction of MAS Treatment Outcome
We have presented the main results based on definition 2 of MAS response (AHI < 10/h with ≥ 50% reduction) as having widest applicability for clinical practice. However, other response definitions (AHI < 5/h and ≥ 50% AHI reduction) produced similar results and are available in the supplemental material. Responder and non-responder characteristics are shown in Table 3. Responders were on average younger, less obese with a smaller neck circumference, and had a lower baseline AHI. There was no association with gender or polysomnographic phenotypes and treatment response. In females (n = 109), age was the only characteristic that differed between responders and non-responders, with no differences in obesity measures (Table S1, supplemental material).
Table 3.
Characteristics of MAS treatment responders and non-responders.
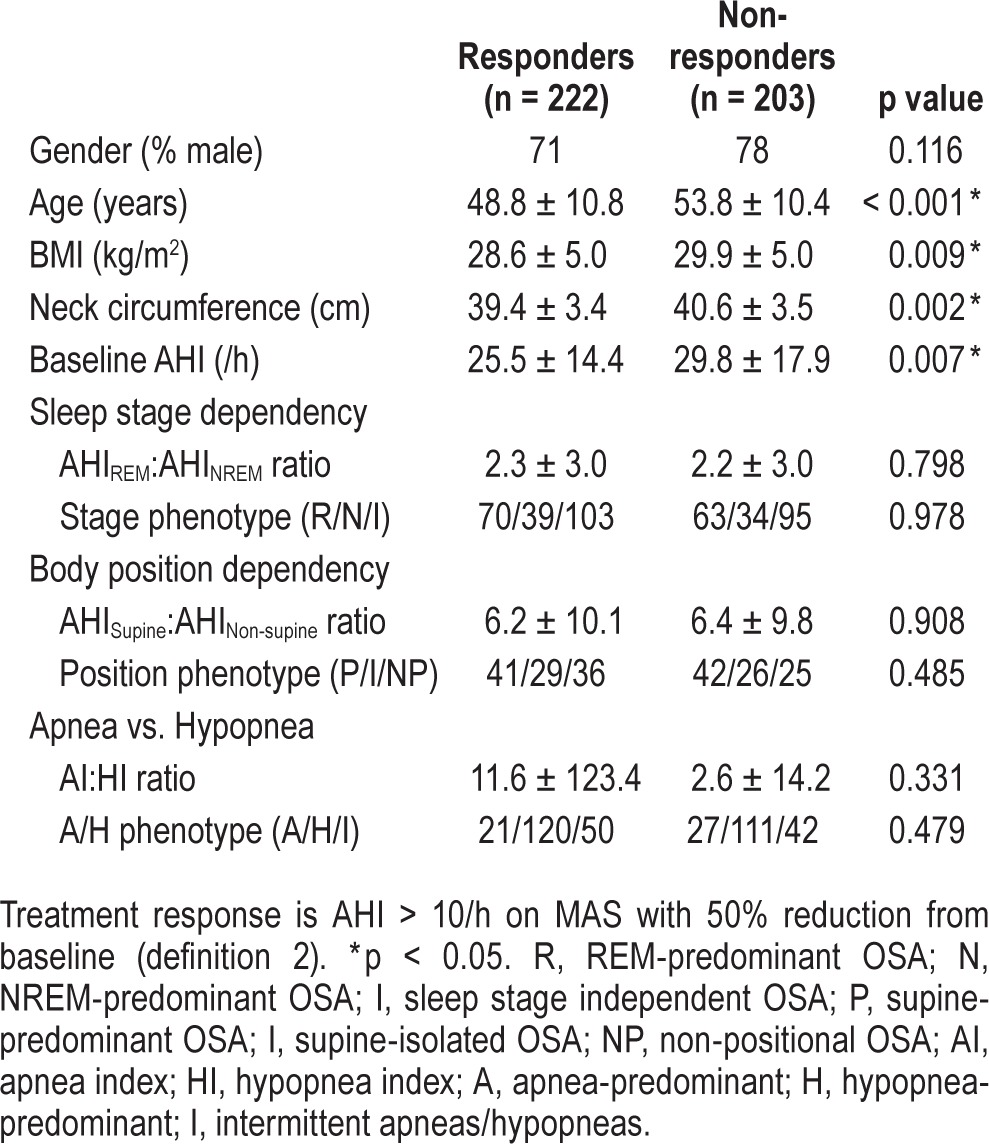
Potential predictor variables considered in prediction modelling analysis were demographic (age, gender), anthropometric (BMI, neck and waist circumference), and polysomnographic (baseline AHI, sleep stage, and body position OSA phenotypes) characteristics. In logistic regression analysis, the best predictor was age, with baseline AHI and BMI also significant. Gender or OSA phenotype did not relate to treatment outcome (regression results are detailed in Table S4, supplemental material).
Classification and regression tree (CART) modelling was additionally applied to the data, as this method is able to assess predictive utility of variables within subgroups of patients and is therefore able to define more complex relationships between predictors. CART models also produce output in a decision tree format which is more adaptable to clinical practice. CART modelling identified age and waist and neck circumference as predictors of MAS AHI < 10/h (Figure 5). This model found classification of the greatest number of patients based on first splitting by an age of 58 years, followed by a waist circumference measure of 103.5 cm. In patients with a smaller waist circumference, an AHI < 20.5 then indicated likely response, whereas in the remaining patients with a higher AHI, an age > 42 years indicated a likely non-responders to treatment. This model correctly classified 64% of patients and yielded a receiver operating characteristic (ROC) area under the curve (AUC) of 0.66, which reduced to 0.60 in subsequent model validation testing (58% correctly classified). Gender and OSA phenotype were not predictors of treatment outcome. CART models for treatment response definition 1 performed similarly with similar predictor variables identified. Modelling for response definition 3 (50% AHI reduction) was more complicated and identified more subgroups of patients, although predictive utility was of the same magnitude. These models are available in the supplemental material.
Figure 5. Classification and regression tree (CART) model MAS treatment outcome (response AHI < 10, definition 2).
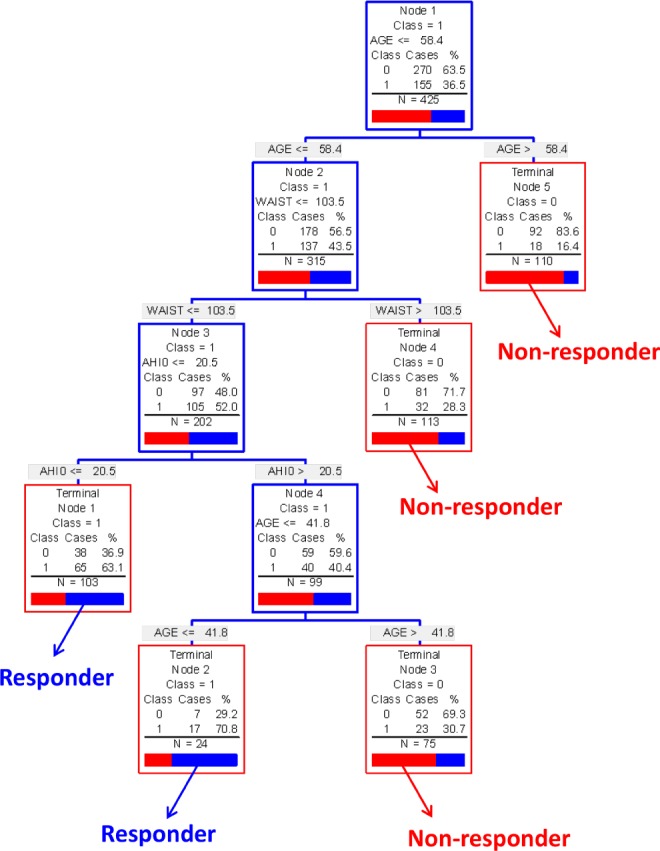
The modelling process starts with the entire patient sample (top blue box). The group is then sequentially split using the variable and cut-point which correctly classifies the maximum number of patients as either responders or non-responders. When no more splits can be made the patients are left in a “terminal node” (red box) where they can be classified as either responders or non-responders based on the predominant classification of patients in that terminal node. The proportion of responders (blue or “1”) and non-responders (red or “0”) in each terminal node is shown. Predictive variables were age, neck circumference (NECK), and waist circumference (WAIST). This model correctly classified 64% or patients on MAS treatment outcome. Non-predictive variables considered in model: baseline AHI, gender, BMI, sleep stage, and body position OSA phenotype.
DISCUSSION
To our knowledge, this is the largest investigation of OSA phenotypes (position and sleep stage dependency, apnea/hypopnea predominance) and MAS treatment response. We have identified that MAS is relatively poor at alleviating REM-predominant OSA. Contrary to previous findings, we have shown that non-positional OSA responds better than supine-predominant phenotypes. We observed no overt differences in alleviation of apneas versus hypopneas by MAS. Additionally we confirm that a substantial proportion of severe OSA patients experience a clinically important response to MAS treatment. The only clinical predictors were age, baseline AHI and anthropometric measures; however, overall such models did not correctly classify enough patients as responders or non-responders to be a reliable clinical tool.
Previously positional OSA has been associated with MAS treatment success.11,12,30,31 Both supine-predominant and supine-isolated subtypes in our analysis showed half the response rate of non-positional patients. Discrepancies may relate to definitions of positional OSA, although we present two definitions of positional dependency, including a stringent definition of no OSA in the lateral sleeping position. Treatment response in supine OSA was previously observed in a sample of only men.9 However we also have a relatively large sample of females and did not find any associations with positional OSA in either gender. Some previous studies12,32 finding this association used one-piece appliances which preclude mouth opening and hence negative effects on upper airway geometry while supine and could be a potential explanation for differences in findings. However two-piece MAS have also previously favored supine OSA in a smaller study.11 Positional sleep data in our 200 patients showed greater AHI reduction in lateral versus supine sleep. Supine OSA occurs in ∼60% of patients, and OSA tends to be more severe when supine.33 MAS may be less effective while supine due to gravity which would favor posterior tongue displacement and overcome the beneficial effects of jaw protrusion. Supine OSA may therefore additionally benefit from positional devices or oral appliances, which additionally protrude the tongue.34 Effects of mandibular advancement on upper airway structure and function in lateral versus supine position have not been extensively studied, with imaging studies assessing airway changes only in the supine position.15
We found REM-predominant OSA patients to have only a 12% complete response rate, and MAS reduced AHINREM more than AHIREM. Therefore MAS may not be appropriate for treatment of REM OSA. Apnea is often worse and upper airway dilator muscle activity reduced in REM sleep,35 and this may account for lower efficacy of MAS. Combined supine and sleep stage data (supplemental material) showed that response rates were lowest in supine REM sleep. In terms of extent of upper airway collapse (apnea versus hypopnea), no relationship was found with MAS response. In patients experiencing intermittent apneas and hypopneas, apnea was reduced to a greater extent than hypopnea and hypopnea index also increased with MAS in apnea-predominant OSA. Complete upper airway obstruction (apnea) can therefore be prevented by MAS, but a residual partial collapse may continue, therefore reducing apnea index but elevating hypopnea index. However, treatment response rates are not negatively impacted by an apnea-predominance phenotype.
Our dataset includes over one hundred females, which to our knowledge is the largest reported to date. In contrast to previous studies,9,10 we did not find females to have better treatment outcomes, nor was gender a predictive factor. This may be explained by low MAS efficacy in REM-predominant OSA, which is more prevalent in females.36 Additionally this sample of 140 severe patients confirms that a substantial proportion can be treated MAS alone, and the majority will likely reduce disease to at least moderate levels. These response rates are similar to previous analyses,37 although actually lower than a 41% complete response rate observed in another study of 167 severe patients.30 Despite some differences in response rates between studies and devices, it appears MAS can be an adequate treatment for severe OSA. However, the ongoing challenge is to pre-identify treatment responders, which is particularly pertinent in the severe subgroup, as confidence in therapeutic response would be needed before treatment implementation. Therefore reliable clinical prediction tests are still needed for MAS response in severe patients in order to recommend this therapy as a first treatment in practice.
Prediction modelling only identified younger age, less obesity, and baseline AHI as predictors of MAS response. The CART analysis method differs from the logistic regression method in that CART is able to assess local effects of predictors in subsets of patients. CART also provides a relatively simple decision tree format with simple cutoff values which can be used to classify patients. Although our sample is large for this type of data, a larger sample may be required to explore the influence of phenotypes in different patient subgroups. In this sample, patient characteristics only resulted in correct classification of 60% to 70% for actual treatment outcome. The strongest predictor in the presented model was age, with age greater than 58 years used to classify non-responders with 83% accuracy. However 60% overall correct classification based on age, AHI, and obesity measures is inadequate accuracy for clinical practice, particularly when considering MAS treatment in severe OSA. Many responders to MAS therapy lie outside the currently recommended limits for AHI and obesity,38 and our data confirm that patient characteristics alone are a poor guides for treatment suitability. Therefore the challenge of prediction remains but we can conclude that simple patient characteristics alone will not suffice and objective assessments to predetermine MAS treatment outcome are ultimately needed. Various methods such as sleep/wake nasopharyngoscopy, flow-volume loops, and single-night mandibular titration studies have been proposed with varying levels of success, although not all have been prospectively validated for routine clinical use.13,14,38
Although we used a retrospective analysis, this study has a number of important strengths. All patients underwent identical treatment protocols with the same device design, in reputable centers with oral appliance research experience. Polysomnography with MAS in situ was available for over 400 patients with a wide range of OSA severity and obesity, as no AHI or BMI limits were set for study inclusion. Furthermore three definitions of MAS treatment response (supplemental material) were assessed for generalizability. However the data also have limitations. Supine sleep data was only accessible in a subset (n = 200), and there is potential selection bias related to participation in MAS research studies, although study exclusion criteria were minimal and a range of gender, age, OSA severity, and BMI was evident in the sample. Generalizability may also be limited by performance bias, as our centers have established expertise in MAS therapy. Findings may not be applicable to MAS treatment with different design types. Also results may be influenced by hypopnea definition and alternative scoring rules could alter results. Additionally, other patient phenotypes that we did not assess (e.g., craniofacial structure, ethnicity) may importantly influence treatment response. Maxillary and mandibular dimensions may also influence response and may be particularly important at different levels of obesity,39 but such imaging assessments are not routinely performed in clinical practice.
In conclusion, exploration of this large dataset of MAS-treated OSA patients has provided novel and contradictory insights. REM-OSA does not respond well to MAS therapy. This analysis favors non-positional OSA for MAS treatment response, unlike previous studies suggesting supine-OSA has higher response rates. Younger age and lower obesity is associated with response, but these characteristics alone will not reliably identify a responder, and female gender also does not indicate likely success. MAS therapy alone is sufficient in a quarter of severe OSA patients, but our data confirm that patient characteristics and OSA phenotypes are not reliable for patient selection, and alternative objective prediction methods are ultimately needed.
DISCLOSURE STATEMENT
Dr. Cistulli is a chief investigator on sponsored clinical trials in obstructive sleep apnea for ResMed Inc and Exploramed Inc.; has a pecuniary interest in SomnoMed Ltd from a previous involvement in product development; is a medical advisor to Exploramed Inc and Zephyr Sleep Technologies. He has received speaker fees/travel support from ResMed Inc and Fisher & Paykel Healthcare. Oral appliances were provided by SomnoMed Ltd. for investigator initiated research studies included in this analysis and the company had no other role in the research. The other authors have indicated no financial conflicts of interest.
ACKNOWLEDGMENTS
The authors gratefully acknowledge the Department of Orthodontics, Sydney Dental Hospital for their contribution in implementing oral appliance treatment in the research patients included in this study.
ABBREVIATIONS
- AHI
apnea-hypopnea index
- AUC
area under the curve
- BMI
body mass index
- CART
classification and regression tree
- CPAP
continuous positive airway pressure
- MAS
mandibular advancement splints
- NREM
non-rapid eye movement
- REM
rapid eye movement
- ROC
receiver operating characteristic
- OSA
obstructive sleep apnea
- TST
total sleep time
SUPPLEMENTAL MATERIAL
METHODS
Polysomnography
Standard electroencephalogram (EEG), electrooculogram and submental electromyogram (EMG) electrodes were applied for sleep stage determination.1 Respiratory variables included monitoring of chest wall and abdominal movement, diaphragm EMG, nasal airflow and pressure, and oxygen saturation by pulse oximetry.2 All sleep recordings were scored by experienced polysomnographers, blinded to the patients' treatment status.
Statistical Analysis
Predictive models for MAS treatment response were developed using logistic regression and classification and regression tree (CART) analysis.3 We have previously used CART analysis to construction prediction models for the presence of OSA.4 The CART method uses nonparametric techniques to evaluate data and account for complex relationships.3 The sample is progressively split into subgroups based on predictive independent variables. Splitting of cases based on predictive variables is continued until “terminal nodes” are reached. A terminal node is a cluster of cases which are either responders or non-responders to MAS treatment. Models were constructed for all three definitions of treatment response based on AHI from total sleep time. In CART analysis, a model is first derived and then tested. Model testing is achieved by using a “10-fold cross validation” method. This method involves removing one random tenth of the data while the model is built from the remaining data. The resulting model is then tested on the tenth of data that were withheld. This process is then repeated for each of the other tenths in turn and the results are aggregated.
RESULTS
Effectiveness of MAS across Sleep Stage and Body Positions
A subgroup of 114 patients had data available in both supine and non-supine sleep with AHI measurements in both NREM and REM. Sleep-disordered breathing was more severe in the supine posture and in REM sleep with highest AHI occurring in supine-REM sleep (Figure S1). MAS decreased AHI in all sleep stages and body positions (Figure S1A). Percent reduction in AHI (Figure S1B) was greatest in the supine position (REM and NREM), however baseline AHI was highest in this body position. In terms of treatment response (Figure S1C), Non-supine NREM sleep showed the highest rate of complete resolution of OSA, however average AHI in this condition was only around 10/h at baseline. The greater reduction in supine AHI appears to be a function of more severe sleep-disordered breathing in this position. Complete response (AHI < 5/h) was most common in Non-Supine NREM sleep when sleep disordered breathing was at its lowest level. Across all body positions and sleep stage conditions, AHI remained at its highest level in supine REM sleep while using MAS.
Classification and Regression Tree Models
CART models are shown for prediction of MAS response by definition 1 (treatment AHI < 5/h) in Figure S2. For definition 3 (50% AHI decrease only) a complex CART model with 8 levels of data splits was obtained (Figure S3). A simpler model using only 5 splits was also constructed (Figure S4). This simplified model correctly classified 70% of patients and split the data based on age, waist circumference, baseline AHI, body position OSA phenotype, neck circumference, gender, and BMI.
AHI data from all four combinations of supine, non-supine, NREM, and REM sleep were available in baseline and MAS sleep studies for 114 patients. (A) Baseline and MAS AHI across all four conditions. (B) Percent change in AHI with MAS treatment in all four conditions (negative numbers indicated a decrease in AHI from baseline). (C) Treatment response rates in all four conditions given for all three definitions of response. *p < 0.05 baseline AHI vs. MAS AHI.
Predictive variables were age, baseline AHI (AHI0) and waist circumference (WAIST). These variables correctly classified 72% of patients as MAS treatment responders or non-responders. Non-predictive variables considered in model: gender, neck circumference, BMI, sleep stage, and body position OSA phenotypes.
This complex model with 8 levels of data splitting correctly classified 75% of patients. Predictive variables on which the data splits were made were age, baseline AHI (AHI0), neck circumference (NECK), waist circumference (WAIST), gender, BMI and body position OSA phenotype (POSNS, 0 = supine OSA, 1 = non-positional OSA).
This is an alternate model to the complex model presented in Figure S3 for this definition of treatment outcome. This model involved only 5 data splits and correctly classified 70% of patients. Predictive variables on which the data splits were made were age, baseline AHI (AHI0), neck circumference (NECK), waist circumference (WAIST), gender, BMI and body position OSA phenotype (POSNS, 0 = supine OSA, 1 = non-positional OSA).
Characteristics of MAS treatment responders and non-responders (definition 2) by gender.
Characteristics of MAS treatment responders and non-responders (definition 1).
Characteristics of MAS treatment responders and non-responders (definition 3).
Logistic regression analyses for prediction of mandibular advancement splint (MAS) treatment outcome.
REFERENCES
- 1.Sutherland K, Vanderveken OM, Tsuda H, et al. Oral appliance treatment for obstructive sleep apnea: an update. J Clin Sleep Med. 2014;10:215–27. doi: 10.5664/jcsm.3460. [DOI] [PMC free article] [PubMed] [Google Scholar]
- 2.Marklund M, Verbraecken J, Randerath W. Non-CPAP therapies in obstructive sleep apnoea: mandibular advancement device therapy. Eur Respir J. 2012;39:1241–7. doi: 10.1183/09031936.00144711. [DOI] [PubMed] [Google Scholar]
- 3.Mehta A, Qian J, Petocz P, Darendeliler MA, Cistulli PA. A randomized, controlled study of a mandibular advancement splint for obstructive sleep apnea. Am J Respir Crit Care Med. 2001;163:1457–61. doi: 10.1164/ajrccm.163.6.2004213. [DOI] [PubMed] [Google Scholar]
- 4.Kushida CA, Littner MR, Morgenthaler T, et al. Practice parameters for the indications for polysomnography and related procedures: an update for 2005. Sleep. 2005;28:499–521. doi: 10.1093/sleep/28.4.499. [DOI] [PubMed] [Google Scholar]
- 5.Phillips CL, Grunstein RR, Darendeliler MA, et al. Health outcomes of continuous positive airway pressure versus oral appliance treatment for obstructive sleep apnea: a randomized controlled trial. Am J Respir Crit Care Med. 2013;187:879–87. doi: 10.1164/rccm.201212-2223OC. [DOI] [PubMed] [Google Scholar]
- 6.Hoekema A, Doff MH, de Bont LG, et al. Predictors of obstructive sleep apnea-hypopnea treatment outcome. J Dent Res. 2007;86:1181–6. doi: 10.1177/154405910708601208. [DOI] [PubMed] [Google Scholar]
- 7.Levendowski DJ, Morgan TD, Patrickus JE, et al. In-home evaluation of efficacy and titration of a mandibular advancement device for obstructive sleep apnea. Sleep Breath. 2007;11:139–47. doi: 10.1007/s11325-006-0094-6. [DOI] [PMC free article] [PubMed] [Google Scholar]
- 8.Liu Y, Lowe AA, Fleetham JA, Park YC. Cephalometric and physiologic predictors of the efficacy of an adjustable oral appliance for treating obstructive sleep apnea. Am J Orthod Dentofacial Orthop. 2001;120:639–47. doi: 10.1067/mod.2001.118782. [DOI] [PubMed] [Google Scholar]
- 9.Marklund M, Stenlund H, Franklin KA. Mandibular advancement devices in 630 men and women with obstructive sleep apnea and snoring: tolerability and predictors of treatment success. Chest. 2004;125:1270–8. doi: 10.1378/chest.125.4.1270. [DOI] [PubMed] [Google Scholar]
- 10.Ng AT, Darendeliler MA, Petocz P, Cistulli PA. Cephalometry and prediction of oral appliance treatment outcome. Sleep Breath. 2012;16:47–58. doi: 10.1007/s11325-011-0484-2. [DOI] [PubMed] [Google Scholar]
- 11.Chung JW, Enciso R, Levendowski DJ, Morgan TD, Westbrook PR, Clark GT. Treatment outcomes of mandibular advancement devices in positional and nonpositional OSA patients. Oral Surg Oral Med Oral Pathol Oral Radiol Endod. 2010;109:724–31. doi: 10.1016/j.tripleo.2009.11.031. [DOI] [PMC free article] [PubMed] [Google Scholar]
- 12.Marklund M, Persson M, Franklin KA. Treatment success with a mandibular advancement device is related to supine-dependent sleep apnea. Chest. 1998;114:1630–5. doi: 10.1378/chest.114.6.1630. [DOI] [PubMed] [Google Scholar]
- 13.Chan AS, Lee RW, Srinivasan VK, Darendeliler MA, Cistulli PA. Use of flow-volume curves to predict oral appliance treatment outcome in obstructive sleep apnea: a prospective validation study. Sleep Breath. 2011;15:157–62. doi: 10.1007/s11325-010-0395-7. [DOI] [PubMed] [Google Scholar]
- 14.Chan AS, Lee RW, Srinivasan VK, Darendeliler MA, Grunstein RR, Cistulli PA. Nasopharyngoscopic evaluation of oral appliance therapy for obstructive sleep apnoea. Eur Respir J. 2010;35:836–42. doi: 10.1183/09031936.00077409. [DOI] [PubMed] [Google Scholar]
- 15.Chan AS, Sutherland K, Schwab RJ, et al. The effect of mandibular advancement on upper airway structure in obstructive sleep apnoea. Thorax. 2010;65:726–32. doi: 10.1136/thx.2009.131094. [DOI] [PubMed] [Google Scholar]
- 16.Gotsopoulos H, Chen C, Qian J, Cistulli PA. Oral appliance therapy improves symptoms in obstructive sleep apnea: a randomized, controlled trial. Am J Respir Crit Care Med. 2002;166:743–8. doi: 10.1164/rccm.200203-208OC. [DOI] [PubMed] [Google Scholar]
- 17.Gotsopoulos H, Kelly JJ, Cistulli PA. Oral appliance therapy reduces blood pressure in obstructive sleep apnea: a randomized, controlled trial. Sleep. 2004;27:934–41. doi: 10.1093/sleep/27.5.934. [DOI] [PubMed] [Google Scholar]
- 18.Hammond RJ, Gotsopoulos H, Shen G, Petocz P, Cistulli PA, Darendeliler MA. A follow-up study of dental and skeletal changes associated with mandibular advancement splint use in obstructive sleep apnea. Am J Orthod Dentofacial Orthop. 2007;132:806–14. doi: 10.1016/j.ajodo.2005.08.047. [DOI] [PubMed] [Google Scholar]
- 19.Ma SY, Whittle T, Descallar J, et al. Association between resting jaw muscle electromyographic activity and mandibular advancement splint outcome in patients with obstructive sleep apnea. Am J Orthod Dentofacial Orthop. 2013;144:357–67. doi: 10.1016/j.ajodo.2013.04.015. [DOI] [PubMed] [Google Scholar]
- 20.Naismith SL, Winter VR, Hickie IB, Cistulli PA. Effect of oral appliance therapy on neurobehavioral functioning in obstructive sleep apnea: a randomized controlled trial. J Clin Sleep Med. 2005;1:374–80. [PubMed] [Google Scholar]
- 21.Ng AT, Gotsopoulos H, Qian J, Cistulli PA. Effect of oral appliance therapy on upper airway collapsibility in obstructive sleep apnea. Am J Respir Crit Care Med. 2003;168:238–41. doi: 10.1164/rccm.200211-1275OC. [DOI] [PubMed] [Google Scholar]
- 22.Ng AT, Qian J, Cistulli PA. Oropharyngeal collapse predicts treatment response with oral appliance therapy in obstructive sleep apnea. Sleep. 2006;29:666–71. [PubMed] [Google Scholar]
- 23.Zeng B, Ng AT, Darendeliler MA, Petocz P, Cistulli PA. Use of flow-volume curves to predict oral appliance treatment outcome in obstructive sleep apnea. Am J Respir Crit Care Med. 2007;175:726–30. doi: 10.1164/rccm.200608-1205OC. [DOI] [PubMed] [Google Scholar]
- 24.Zeng B, Ng AT, Qian J, Petocz P, Darendeliler MA, Cistulli PA. Influence of nasal resistance on oral appliance treatment outcome in obstructive sleep apnea. Sleep. 2008;31:543–7. doi: 10.1093/sleep/31.4.543. [DOI] [PMC free article] [PubMed] [Google Scholar]
- 25.Kato J, Isono S, Tanaka A, et al. Dose-dependent effects of mandibular advancement on pharyngeal mechanics and nocturnal oxygenation in patients with sleep-disordered breathing. Chest. 2000;117:1065–72. doi: 10.1378/chest.117.4.1065. [DOI] [PubMed] [Google Scholar]
- 26.Walker-Engstrom ML, Ringqvist I, Vestling O, Wilhelmsson B, Tegelberg A. A prospective randomized study comparing two different degrees of mandibular advancement with a dental appliance in treatment of severe obstructive sleep apnea. Sleep Breath. 2003;7:119–30. doi: 10.1007/s11325-003-0119-3. [DOI] [PubMed] [Google Scholar]
- 27.Aarab G, Lobbezoo F, Hamburger HL, Naeije M. Effects of an oral appliance with different mandibular protrusion positions at a constant vertical dimension on obstructive sleep apnea. Clin Oral Invest. 2010;14:339–45. doi: 10.1007/s00784-009-0298-9. [DOI] [PubMed] [Google Scholar]
- 28.Joosten SA, Hamza K, Sands S, Turton A, Berger P, Hamilton G. Phenotypes of patients with mild to moderate obstructive sleep apnoea as confirmed by cluster analysis. Respirology. 2012;17:99–107. doi: 10.1111/j.1440-1843.2011.02037.x. [DOI] [PubMed] [Google Scholar]
- 29.Lemon SC, Roy J, Clark MA, Friedmann PD, Rakowski W. Classification and regression tree analysis in public health: methodological review and comparison with logistic regression. Ann Behav Med. 2003;26:172–81. doi: 10.1207/S15324796ABM2603_02. [DOI] [PubMed] [Google Scholar]
- 30.Holley AB, Lettieri CJ, Shah AA. Efficacy of an adjustable oral appliance and comparison with continuous positive airway pressure for the treatment of obstructive sleep apnea syndrome. Chest. 2011;140:1511–6. doi: 10.1378/chest.10-2851. [DOI] [PubMed] [Google Scholar]
- 31.Lettieri CJ, Paolino N, Eliasson AH, Shah AA, Holley AB. Comparison of adjustable and fixed oral appliances for the treatment of obstructive sleep apnea. J Clin Sleep Med. 2011;7:439–45. doi: 10.5664/JCSM.1300. [DOI] [PMC free article] [PubMed] [Google Scholar]
- 32.Yoshida K. Influence of sleep posture on response to oral appliance therapy for sleep apnea syndrome. Sleep. 2001;24:538–44. doi: 10.1093/sleep/24.5.538. [DOI] [PubMed] [Google Scholar]
- 33.Joosten SA, O'Driscoll DM, Berger PJ, Hamilton GS. Supine position related obstructive sleep apnea in adults: pathogenesis and treatment. Sleep Med Rev. 2014;18:7–17. doi: 10.1016/j.smrv.2013.01.005. [DOI] [PubMed] [Google Scholar]
- 34.Dort L, Remmers J. A combination appliance for obstructive sleep apnea: the effectiveness of mandibular advancement and tongue retention. J Clin Sleep Med. 2012;8:265–9. doi: 10.5664/jcsm.1910. [DOI] [PMC free article] [PubMed] [Google Scholar]
- 35.Eckert DJ, Malhotra A, Lo YL, White DP, Jordan AS. The influence of obstructive sleep apnea and gender on genioglossus activity during rapid eye movement sleep. Chest. 2009;135:957–64. doi: 10.1378/chest.08-2292. [DOI] [PMC free article] [PubMed] [Google Scholar]
- 36.O'Connor C, Thornley KS, Hanly PJ. Gender differences in the polysomnographic features of obstructive sleep apnea. Am J Respir Crit Care Med. 2000;161:1465–72. doi: 10.1164/ajrccm.161.5.9904121. [DOI] [PubMed] [Google Scholar]
- 37.Fukuda T, Tsuiki S, Kobayashi M, Nakayama H, Inoue Y. Selection of response criteria affects the success rate of oral appliance treatment for obstructive sleep apnea. Sleep Med. 2014;15:367–70. doi: 10.1016/j.sleep.2013.12.007. [DOI] [PubMed] [Google Scholar]
- 38.Remmers J, Charkhandeh S, Grosse J, et al. Remotely controlled mandibular protrusion during sleep predicts therapeutic success with oral appliances in patients with obstructive sleep apnea. Sleep. 2013;36:1517–25. doi: 10.5665/sleep.3048. [DOI] [PMC free article] [PubMed] [Google Scholar]
- 39.Tsuiki S, Ito E, Isono S, et al. Oropharyngeal crowding and obesity as predictors of oral appliance treatment response to moderate obstructive sleep apnea. Chest. 2013;144:558–63. doi: 10.1378/chest.12-2609. [DOI] [PubMed] [Google Scholar]
REFERENCES
- 1.Rechtschaffen A, Kales A. Los Angeles: Brain Information Service/Brain Research Institute; 1968. A manual of standardized terminology, techniques and scoring system for sleep stages of human subjects. [Google Scholar]
- 2.Sleep-related breathing disorders in adults: recommendations for syndrome definition and measurement techniques in clinical research. The Report of an American Academy of Sleep Medicine Task Force. Sleep. 1999;22:667–89. [PubMed] [Google Scholar]
- 3.Lemon SC, Roy J, Clark MA, et al. Classification and regression tree analysis in public health: methodological review and comparison with logistic regression. Ann Behav Med. 2003;26:172–81. doi: 10.1207/S15324796ABM2603_02. [DOI] [PubMed] [Google Scholar]
- 4.Lee RW, Petocz P, Prvan T, et al. Prediction of obstructive sleep apnea with craniofacial photographic analysis. Sleep. 2009;32:46–52. [PMC free article] [PubMed] [Google Scholar]
Associated Data
This section collects any data citations, data availability statements, or supplementary materials included in this article.
Supplementary Materials
AHI data from all four combinations of supine, non-supine, NREM, and REM sleep were available in baseline and MAS sleep studies for 114 patients. (A) Baseline and MAS AHI across all four conditions. (B) Percent change in AHI with MAS treatment in all four conditions (negative numbers indicated a decrease in AHI from baseline). (C) Treatment response rates in all four conditions given for all three definitions of response. *p < 0.05 baseline AHI vs. MAS AHI.
Predictive variables were age, baseline AHI (AHI0) and waist circumference (WAIST). These variables correctly classified 72% of patients as MAS treatment responders or non-responders. Non-predictive variables considered in model: gender, neck circumference, BMI, sleep stage, and body position OSA phenotypes.
This complex model with 8 levels of data splitting correctly classified 75% of patients. Predictive variables on which the data splits were made were age, baseline AHI (AHI0), neck circumference (NECK), waist circumference (WAIST), gender, BMI and body position OSA phenotype (POSNS, 0 = supine OSA, 1 = non-positional OSA).
This is an alternate model to the complex model presented in Figure S3 for this definition of treatment outcome. This model involved only 5 data splits and correctly classified 70% of patients. Predictive variables on which the data splits were made were age, baseline AHI (AHI0), neck circumference (NECK), waist circumference (WAIST), gender, BMI and body position OSA phenotype (POSNS, 0 = supine OSA, 1 = non-positional OSA).
Characteristics of MAS treatment responders and non-responders (definition 2) by gender.
Characteristics of MAS treatment responders and non-responders (definition 1).
Characteristics of MAS treatment responders and non-responders (definition 3).
Logistic regression analyses for prediction of mandibular advancement splint (MAS) treatment outcome.