Abstract
Cytosine (C)-rich DNA can adopt i-motif folds under acidic conditions, with the human telomere i-motif providing a well-studied example. The dimensions of this i-motif are appropriate for capture in the nanocavity of the α-hemolysin (α-HL) protein pore under an electrophoretic force. Interrogation of the current vs time (i–t) traces when the i-motif interacts with α-HL identified characteristic signals that were pH dependent. These features were evaluated from pH 5.0 to 7.2, a region surrounding the transition pH of the i-motif (6.1). When the i-motif without polynucleotide tails was studied at pH 5.0, the folded structure entered the nanocavity of α-HL from either the top or bottom face to yield characteristic current patterns. Addition of a 5′ 25-mer poly-2′-deoxyadensosine tail allowed capture of the i-motif from the unfolded terminus, and this was used to analyze the pH dependency of unfolding. At pH values below the transition point, only folded strands were observed, and when the pH was increased above the transition pH, the number of folded events decreased, while the unfolded events increased. At pH 6.8 and 7.2 4% and 2% of the strands were still folded, respectively. The lifetimes for the folded states at pH 6.8 and 7.2 were 21 and 9 ms, respectively, at 160 mV electrophoretic force. These lifetimes are sufficiently long to affect enzymes operating on DNA. Furthermore, these transient lifetimes are readily obtained using the α-HL nanopore, a feature that is not easily achievable by other methods.
Introduction
The instructional information contained in DNA and RNA polymers can direct a wealth of secondary structures via hydrogen bonding, π stacking, and coordination with metals. Secondary structural variability observed for these polymers includes many different forms of hairpins, duplexes, cruciform folds, triple helices, G-quadruplexes, triplexes, and i-motifs.1 The intercalation of cytosine (C)-rich strands at low pH yields i-motif folds that are finding broad utility in chemistry and biology.2,3 Specifically, hemiprotonation of C-rich strands at low pH allows C+•C base pairs to form that initiate folding of i-motifs (Figure 1A). The pH dependency in formation of the i-motif topology causes the folding process to be highly cooperative.2−4 These folds have immense potential in biosensor development and other analytical applications, due to the ease with which these folds can be manipulated by pH.5 Biological studies have identified i-motifs in human promoter regions that are proposed to aid in the control of gene transcription.3 For example, the Hurley laboratory has identified the BCL2 promoter i-motif as a cellular target for drugs to bind and control transcription of this gene.6,7 The ability to regulate gene transcription via i-motif interacting drugs has enormous potential to combat a number of cancers.8 Realization of the full potential of i-motif scaffolds in analytical applications and understanding their role in biological processes requires an extensive set of tools. These tools allow us to better understand the sequence dependency and how changes in physical conditions affect i-motif structures, their unfolding kinetics and thermodynamics as well as how small molecules interact with them.
Figure 1.
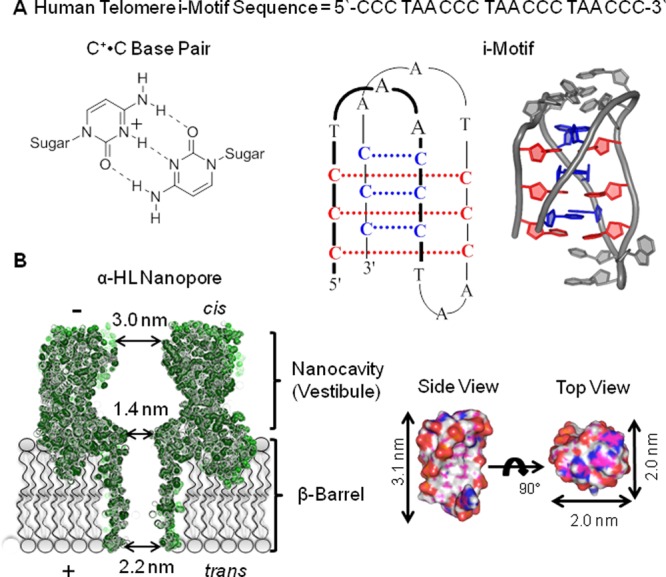
Structures of the human telomere i-motif and the α-hemolysin nanopore. (A) The C+•C base pair scheme, the human telomere i-motif line structure, and cartoon drawing based on pdb 1ELN.9 (B) Space filling model of the α-hemolysin nanopore (pdb 7AHL)10 and the human telomere i-motif along with their dimensions for comparison.
Typical analytical tools for studying i-motif folds include spectroscopic methods (e.g., UV–vis, CD, and fluorescence), NMR, gel electrophoresis, thermal denaturation, and mass spectrometry.11−13 These tools have identified numerous sequence-dependent folds for i-motifs, their optimum pH ranges for folding, and alterations of the physical parameters that affect i-motif stability.13,14 Generally, hemiprotonation of C occurs at pH < 6, leading to favorable i-motif folding conditions, although molecular crowding agents and selection of certain sequences have found i-motif folds that are stable at higher pH values.13−15 Recently, studies of individual i-motif folds by optical tweezers evaluated their pH-dependent tensile strengths.16,17 Another single-molecule approach for studying DNA and RNA secondary structures is the alpha-hemolysin (α-HL) protein nanopore; however, this tool has not been employed for studying the i-motif scaffold.
The α-HL nanopore is a mushroom-shaped protein channel that, once embedded in a lipid bilayer, forms a well-defined, nanometer-sized hole through which ions can flow in an electrical field (Figure 1B).10 On the cis side of α-HL is the opening (d ∼ 3.0 nm) to the nanocavity or vestibule that has a large volume (39.5 nm3)18 for capturing and analyzing folded DNA structures. At the base of the nanocavity is a ∼1.4 nm central constriction leading to a β-barrel that exits the trans side of the protein.18 Some protein nanopores allow single-stranded DNA to translocate readily, a feature being utilized as a next-generation DNA sequencing platform.19−22 In contrast, folded DNA structures cannot pass the central constriction causing them to be trapped. When molecules are trapped and interact with the protein channel, they impede the ion flow.23−25 Thus, the change in ion flow and the blockage duration time when molecules, such as DNA, interact with the nanopore yield valuable information about the molecular interactions. Specifically, the α-HL nanopore has successfully identified features of DNA secondary structures that have been challenging to observe by other bulk measurements. For example, the human telomere G-quadruplex can fold to two nearly identical hybrid structures in KCl-containing solutions, and the α-HL nanopore can readily identify the populations of these two topologies.26 The thrombin-binding aptamer G-quadruplex studied with α-HL identified ion-regulated unfolding kinetic values that are beneficial for the development of fine-tuned biosensors.27
A second advantage to studies of DNA secondary structures with the α-HL nanopore is achieved by the size-selective properties of this nanochannel.18 For instance, if molecules are too big (d > 3.0 nm) they do not enter the mouth of the nanocavity. Attachment of a long, single-stranded DNA tail allows folded DNA structures to be drawn into the pore. Large folds interact with the pore on the outside, while small structures can be trapped via the tail tethered through the β-barrel that allows the initial orientation to be known. This feature has verified that hairpins with two tails (internal hairpins) and propeller folded G-quadruplexes are too big to enter the protein channel when electrophoretically driven toward the channel.28−30 Smaller structures, such as blunt-ended hairpins,31,32 DNA duplexes,33,34 and small G-quadruplexes enter the nanocavity of α-HL.27,28,35,36 Encapsulation of these structures inside the nanocavity provides current levels and residence times that are diagnostic of specific structure- and sequence-dependent interactions. Other protein and solid-state nanopores have been utilized for interrogating DNA, aptamers, and protein structures when they interact with these small aperture pores under an electrical bias.37−45 Single-molecule techniques using nanopores have the further advantage of providing information about the equilibrium or distribution of molecules in solution.26,46,47 These studies provide background knowledge that can be leveraged for evaluating data collected from uncharted DNA structures, such as the i-motif scaffold, when they were allowed to interact with α-HL under an electrophoretic force.
In the current studies, the α-HL nanopore was utilized to interrogate the i-motif that folds from the human telomere repeat sequence (5′-CCC TAA-3′)n. Studies were conducted to understand whether and how polynucleotide tails attached to this structure modulate the DNA–protein interactions. Because i-motifs cooperatively fold in a pH-dependent fashion, titration studies were conducted to monitor this folding and unfolding process in situ. Additionally, the residence time that an i-motif was trapped in the nanocavity before unraveling provides a measure of the structure’s stability, allowing us to probe the unraveling kinetics of this structure as a function of pH. These studies identify unique and characteristic properties of i-motifs and their interactions with α-HL. This knowledge will be beneficial for stochastic biosensor development and for understanding the kinetic properties of these structures that may regulate genetic processes.
Results and Discussion
Initial studies were conducted with the minimal human telomere i-motif sequence 5′-CCC TAA CCC TAA CCC TAA CCC-3′ that does not have polynucleotide tails protruding from the core of the fold (Figure 1A). To obtain satisfactory current levels for interpreting interactions of the i-motif with α-HL under an electrophoretic force, the ionic strength was held at 1.0 M KCl and was appropriately buffered at each pH studied. Before conducting α-HL nanopore measurements, a set of pH-dependent CD studies were performed with this sequence under the high ionic strength conditions that favor DNA capture in the nanopore to determine the transition pH for folding this i-motif. Measurement of the CD spectra from 220–320 nm as the pH changed by 0.25 increments from 5.0 to 7.5 provided signals that changed with the pH (Figure 2). Plots of the molar ellipticity at 286 nm vs pH demonstrate a transition with an inflection point at 6.1 (pHT). This value is similar to literature sources for this sequence under lower ionic strength conditions.9 Knowledge of this transition pH allowed α-HL experiments to be designed that ensured monitoring of the fully folded and fully unfolded states. Lastly, to better understand how the thermodynamics of the i-motif are affected by the high ionic strength, thermal melting (Tm) measurements were conducted. At pH 5.0 and physiologically relevant ionic strength (140 mM KCl and 12 mM NaCl), the Tm was 43.6 °C, and at the high ionic strength conditions (1.0 M KCl) used for the nanopore studies, the Tm was 46.7 °C (Figure 2B). The high salt concentration increased the Tm by 3.4 °C, indicating that the high ionic strength of the nanopore conditions has a minor effect on increasing the thermodynamic stability of the folded state.
Figure 2.
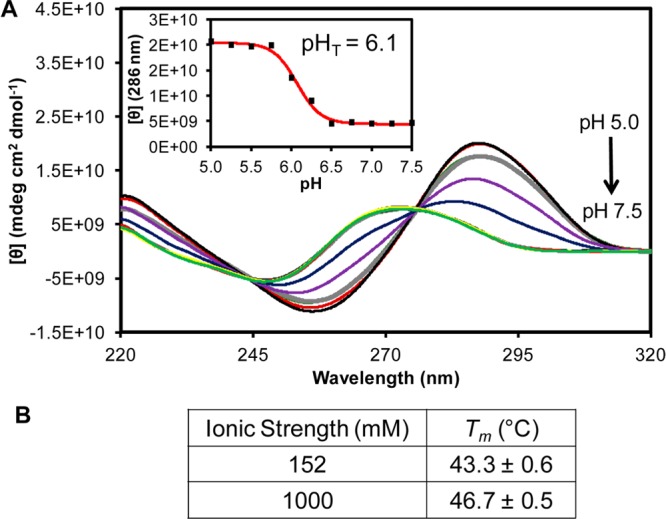
pH-Dependent CD spectra and ionic strength-dependent Tm values for the human telomere i-motif. (A) The CD spectra were recorded on a 10 μM solution of the sequence 5′-CCC TAA CCC TAA CCC TAA CCC-3′ in a 25 mM three buffer system (acetate, phosphate, and borate) with 1.0 M KCl at 20 °C. The pH values were adjusted from 5.0 to 7.5 in 0.25 pH unit increments. The inset represents the molar ellipticity at 286 nm vs pH that determined the transition pH (pHT) to be 6.1. (B) Table of measured Tm values for the i-motif sequence at physiological ionic strength (140 mM KCl and 12 mM NaCl) vs the high ionic strength for the nanopore analysis (1.0 M) at pH 5.0. Values were determined by monitoring the temperature-dependent unfolding process by UV–vis at 295 nm.
Analysis of the fully folded i-motif by α-HL was conducted at pH 5.0. When the i-motif was added to the cis side of the nanopore and electrophoretically driven into the nanocavity under a −120 mV bias (cis vs trans), only very long blockages to the current were observed. These blockages persisted for >2 min (Figure S1). Studies with greater driving force (−160 mV) gave similar results. The observation that the i-motif folds were trapped in the nanocavity is consistent with the exterior dimensions of the i-motif (d ∼ 2.0 nm, Figure 1B) being greater than the central constriction of α-HL (d ∼ 1.4 nm, Figure 1B). Furthermore, these initial observations at pH 5.0 identify the i-motif to be very stable and the kinetics of unraveling to be too slow to be monitored in a reasonable amount of time. All nanopore data reported were determined on at least three α-HL nanopores, and the number of events was dependent on the experiment as described below.
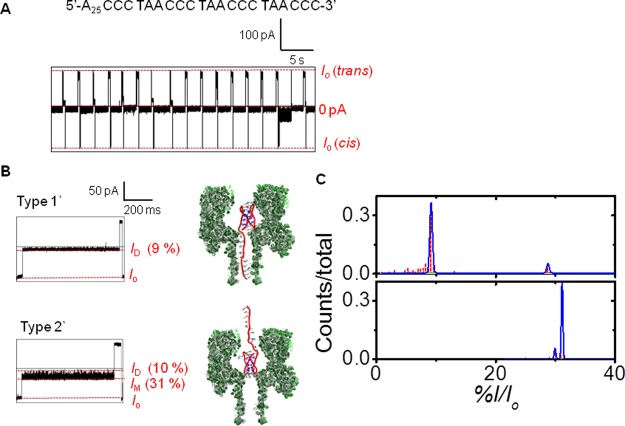
To obtain populations of blockage currents required for conducting statistical analysis of the results, the i-motifs were trapped in the nanocavity and held there for 2 s (Figure 3A). After the 2 s hold, the voltage bias was reversed to force the structure to exit the cis side of the channel, followed by reversing the current back again to allow trapping and studying the next DNA molecule. Analysis of >200 of these trapping events found two types of current vs time (i–t) patterns to emerge (Figure 3B and Figures S2 & S3). Close inspection of the i–t patterns revealed the characteristic patterns of these events that were termed Types 1 and 2 (Figures 3B). Type 1 event profiles were interpreted as entry of the i-motif into the channel causing the open channel current (Io) to initially go to an intermediate blockage state (IM) that lasted >100 μs and then began to transition to a deep blockage current (ID) that also lasted >100 μs. An alteration in the two blocking current levels was maintained throughout the 2 s duration for which each Type 1 event monitored. The current values reported were normalized by the Io to give percent residual currents (i.e., %I/Io). Accordingly, the %IM/Io was 36 ± 1%, and the %ID/Io was 10 ± 1% for the Type 1 events. In contrast, the Type 2 events initiated with an intermediate current blockage level of %IM/Io = 31 ± 1%, and this level was the dominate current recorded during the event (Figure 3B). Occasionally, a deeper blockage to the current was recorded that had a value of %ID/Io = 10 ± 1%, and these blockages lasted for <100 μs (Figure 3B). For the Type 2 events, this current pattern persisted through the entire 2 s during which they were recorded. The distribution of Type 1 and 2 events was 5.6:1, respectively (Figure 3C). These were the only two event types observed for the i-motif at pH 5.0, leading us to hypothesize the interpretation below.
Figure 3.
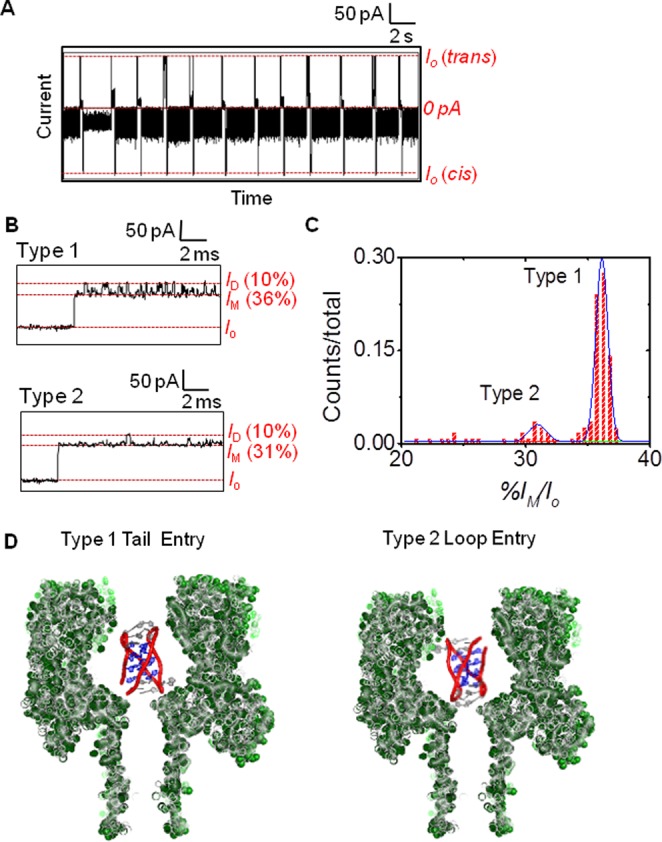
Analysis of the human telomere i-motif with the α-HL nanopore at pH 5.0. (A) A 20 s continuous i–t trace showing the raw data. (B) Expanded views for the Type 1 and 2 events to show their unique i–t patterns. (C) Current vs IM counts to identify the Type 1 and 2 events based on their unique differences. (D) Proposed model that describes the process leading to these two event types. Data were recorded at −120 mV (cis vs trans) at 22 °C in 1.0 M KCl electrolyte solution buffered with 10 mM phosphate and 5 mM citrate at pH 5.0.
Inspection of the space filling model of the human telomere i-motif (Figure 1B) identifies it to be nearly cylindrically shaped with a height of 3.1 nm and a diameter of 2.0 nm similar to that of duplex B-form DNA.9 Furthermore, the top and bottom of this cylinder have different features: on one side, the 5′ and 3′ termini exist along with one edgewise loop, while the other side presents two edgewise loops (Figure 1A,B). Therefore, we hypothesize that these two event types result from entry of the i-motif into the nanocavity from the side with the 5′ and 3′ termini or from the side with the two edgewise loops to yield the two different i–t patterns (Figure 3D). The different sides should interact with the narrow central constriction differently, resulting in the two different event types. Specifically, the side with one edgewise loop is proposed to be more flexible leading to more frequent and longer-lived interactions with the central constriction, such as those observed in the Type 1 events. In contrast, the side with two edgewise loops is conformationally restricted due to a loop–loop base pair that caps the structure48 leading to less frequent interactions with the central constriction, such as those observed in the Type 2 events.
Support for this orientation-specific hypothesis was achieved by studying an i-motif sequence that had two additional nucleotides on both the 5′ and 3′ ends (sequence = 5′- AA CCC TAA CCC TAA CCC TAA CCC TA-3′, the underlined nucleotides being the ones added). These additional nucleotides do not change the pH-dependent folding properties of the sequence (Figure S4). These additional nucleotides should cause a change in the event type that enters the pore from the side with the 5′ and 3′ tails; thus, identifying the event type resulting from this face interacting with the central constriction. Examination of the results when the new sequence was studied with α-HL found that Type 2 events remained the same and that Type 1 events were changed (Figure S5). New features of the Type 1 events with the additional two-nucleotide tails include similar IM and ID currents, while the duration times dramatically changed (Figure 4). Due to the highly stochastic nature of these new events, a thorough analysis was not conducted. These new events could not be unraveled at increased voltage (−160 mV) up to 2 min (Figure S6), suggesting the stability of the i-motif was not affected by the tails. Because the height of the i-motif is 3.1 nm and the mouth of the nanocavity is 3.0 nm, we suspect entry from the side would not be a favorable mode for entry of the i-motif into the nanocavity. There were no additional event types that would support this type of process.
Figure 4.
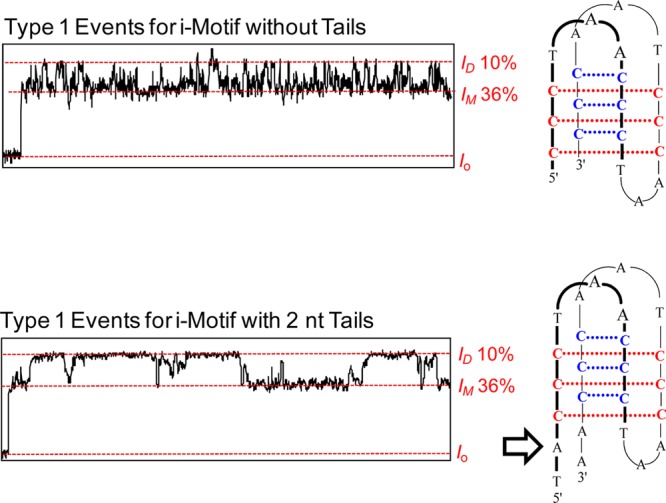
Comparison of Type 1 events for i-motifs without tails and with two nucleotide tails on the 5′ and 3′ ends. The i–t traces represent 20 ms of two representative events. Data were recorded at −120 mV (cis vs trans) at 22 °C in 1.0 M KCl electrolyte solution buffered with 10 mM phosphate and 5 mM citrate at pH 5.0.
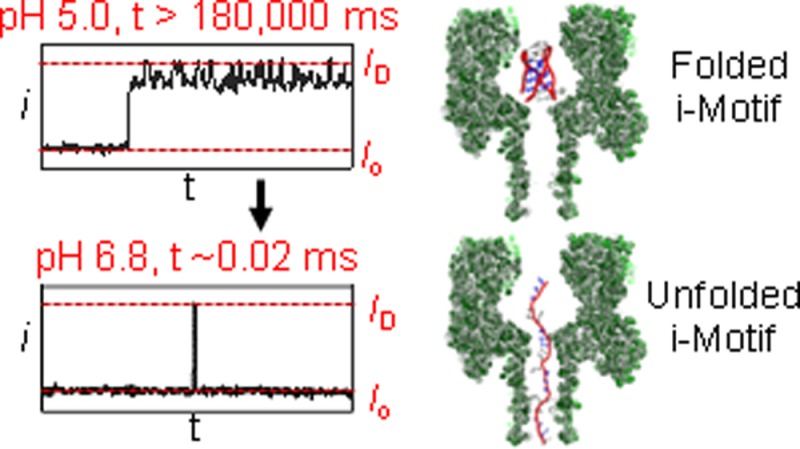
In the next study, the tailless i-motif was initially analyzed with a protein channel at −120 mV and pH 5.0, and then a predetermined aliquot of NaOH was added to the cis side of the channel to raise the pH to 6.8 (Figure 5). At pH 6.8, this i-motif should be nearly completely unfolded based on the CD studies (Figure 2A). Upon addition of NaOH and within a few seconds (mixing time in the analysis chamber), new events were observed characteristic of unfolded, single-stranded DNA translocation, and the long dwell-time blockages were reduced to <5% of the events. The new events were very fast and gave a wide distribution of blocking levels that was expected because of the short length of this strand (21 nucleotides, see Figure 5). For example, at −100 mV the ID distribution was broad and centered at %ID/Io = 11 ± 1%. The mean translocation time for a population of events (>2000 events) was a Gaussian distribution with a time constant of 0.03 ± 0.01 ms (Figure S7). Support for translocation of these unfolded strands through the channel was achieved by a voltage-dependent study that found as the voltage was increased, the translocation time decreased (Figure S7). The results of these studies at pH 5.0 and 6.8 verify that the nanopore can easily distinguish the folded and unfolded states of the i-motif strand.
Figure 5.
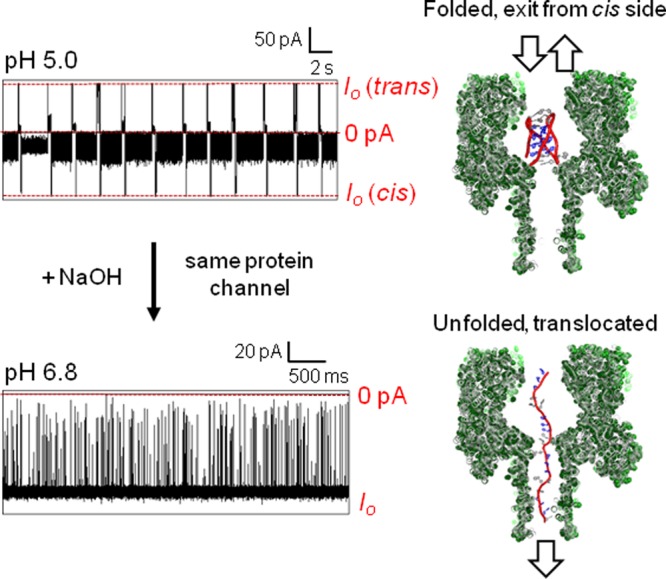
Comparison of the human telomere i-motif studied at pH 5.0 and 6.8 with the α-HL nanopore. Data were recorded at −120 mV (cis vs trans) at 22 °C in in 1.0 M KCl electrolyte solution buffered with 10 mM phosphate and 5 mM citrate at pH 5.0 or 6.8 on the sequence 5′-CCC TAA CCC TAA CCC TAA CCC-3′.
Previous studies from our laboratory and others have found that the addition of a long (>25 nucleotide), single-stranded polynucleotide tail to bulky secondary structures such as hairpins, duplexes, and G-quadruplexes forces the structures to preferentially enter from the single-stranded terminus.28,29,34,41,49−51 Also, the tail allows trapping the folds for very long times, and it allows the entry orientation to be known.28,34 Accordingly, a 25-mer poly-2′-deoxyadenosine tail (dA25) was added to the 5′-end of the i-motif. Selection of the dA25 tail was advantageous because the structure of poly dA strands is not affected by low pH. First, we determined the addition of the 25-mer tail to the i-motif had no effect on the transition pH between the single-stranded and folded states based on CD analysis (Figure S8). Next, the i-motif bearing the tail was studied with α-HL at pH 5.0 under a −120 mV bias (Figure 6A). In these studies, two event types were observed that were incapable of translocating through the channel at −120 mV (Figure 6B); these studies determined the events to persist for >2 min (Figure S9). The two event types were termed Types 1′ and 2′ (Figure 6B). The Type 1′ events were characterized as having a static deep blockage to the current with %ID/Io = 10 ± 2%, while the Type 2′ events fluctuated between an intermediate current level with %IM/Io = 31 ± 1% and a deep blockage current level with %ID/Io = 10 ± 1% (Figure 6B). The intermediate current level was the dominate current recorded with only short pulses (<100 μs) of deep blockage current levels. The Type 2′ events behaved nearly identically to the Type 2 events recorded for the i-motif without a long poly dA tail (Figures 3B and 6B). On the basis of a comparison to our previous results,28,30 the Type 1′ events are consistent with entry of the poly dA tail into the protein channel first, in which the tail occupies the entire β-barrel, and the i-motif resides in the nanocavity (Figure 6B,C). These studies with the 25-mer tail further support the model proposed in which the Type 1 and 2 events result from side-specific entry of the i-motif into the nanocavity (Figure 3D). The 5′-poly dA tail only affects the Type 1′ events, the side of the i-motif from which the tail protrudes from the i-motif core; whereas, Type 2′ events are nearly identical to the tailless i-motif Type 2 events.
Figure 6.
Analysis of the i-motif with a 5′ 25-mer poly dA tail at pH 5.0 with the α-HL nanopore. (A) A 30 s continuous i–t trace. (B) Expanded views of the Type 1′ and 2′ events and graphical models showing the i-motif interactions with α-HL that yield these event types. (C) Comparison of the IM histograms for the i-motif with a 5′-tail (top) and tailless i-motif (bottom) to show that the IM values for the Type 2 and 2′ events are nearly identical. Data were recorded at −120 mV (cis vs trans) at 22 °C in 1.0 M KCl electrolyte solution buffered with 10 mM phosphate and 5 mM citrate at pH 5.0.
To obtain a sufficient number of events for statistical analysis, the event profiles were recorded for 2 s followed by ejection of the sample from the nanocavity by reversing the electrical bias. Once the channel was cleared, the bias was returned to its original state (−120 mV, cis vs trans) to capture another i-motif. Analysis of this population of data identified the Type 1′ and 2′ events to occur in an 11:1 ratio, respectively (Figure 6C). This ratio identifies the poly dA tail to enter the pore more readily than the i-motif end of the strand. Now that the event types have been identified, pH-dependent studies could next be conducted.
To conduct the pH-dependent studies, the i-motif with a 25-mer poly dA tail was placed on the cis side of the channel initially at pH 5.0, and the bias was set to −120 mV (Figure 7A). Once a sufficient population of data was recorded (>200 events), a predetermined aliquot of NaOH was added to the cis side of the channel to raise the pH to 5.7 (Figure 7A). Again, a sufficient population of data was recorded (>200 events). The only events observed were the folded i-motifs (Figure 7A). Comparison of the data at pH 5.0 and 5.7 determined them to be virtually identical (Figure 7A), which was consistent with the pH-dependent CD studies (Figure S8) that identify these two pH conditions to behave the same (Figures S12 and S13). Next, the pH was adjusted to 6.3, a value near the transition pH of 6.1, and three event types were observed. Two long event types identical to Types 1′ and 2′ were detected (28 ± 4%) as well as fast events identical to unfolded, single-stranded DNA translocation (72 ± 14%, Figures 7B and S16). This observation is consistent with the event profile expected during the transition phase of an i-motif from folded to the unfolded state. In the final pH analysis, NaOH was added to achieve pH 6.8 (Figures 7C and S17). Under these conditions, the i-motif gave predominantly unfolded states (96 ± 2%) and a small population of folded states (4 ± 1%, Figure 7C). Analysis of the population of times for single-stranded DNA translocation at pH 6.3 and 6.8 found them to be Gaussian distributed and to have nearly identical time constants (Figure S16). These studies provided knowledge of the current patterns expected as the i-motif goes through a transition from the folded to unfolded states.
Figure 7.
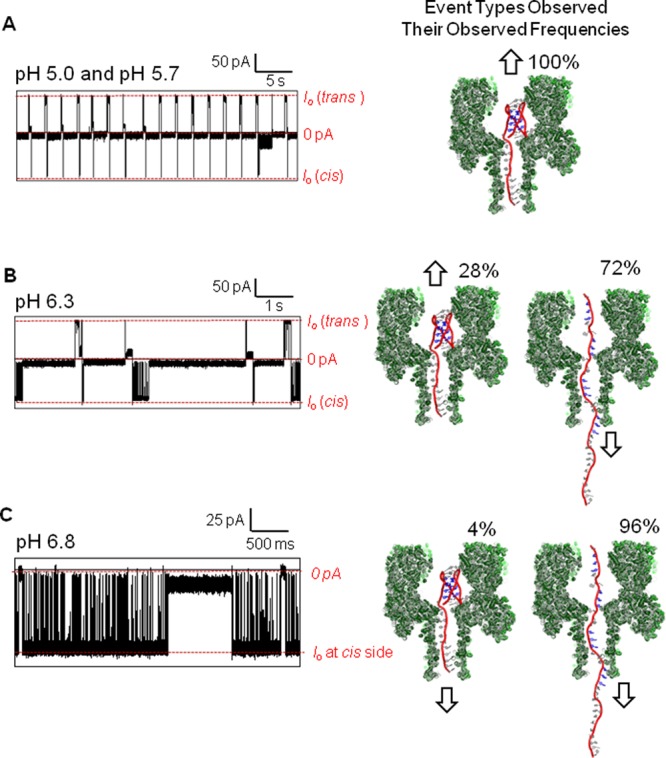
The pH-dependent analysis of the i-motif with a poly dA tail via the α-HL nanopore at pH 5.0, 5.7, 6.3, and 6.8. (A) Typical i–t profiles observed for 40 s at pH 5.0 and 5.7. The data for both pH studies were very similar, and therefore, only data for pH 5.0 are shown. (B) Typical i–t profiles observed for 10 s at pH 6.3. (C) Typical i–t profiles observed for 6 s at pH 6.8. All i–t profiles were recorded at −120 mV (cis vs trans) at 22 °C in 1.0 M KCl electrolyte solution buffered with 10 mM phosphate and 5 mM citrate at the designated pH. Errors for the event frequencies are ∼20% based on analysis of events from three different protein channels.
In the last set of experiments, the i-motif with a 25-mer poly dA tail was analyzed at −160 mV (cis vs trans) bias while repeating the pH-dependent study. Interestingly, with the 25-mer tail, the i-motif at pH 5.0 could be unfolded at −160 mV when the tail enters first (Type 1′ events), a feat not achievable in 3 min at −120 mV (Figure S9). A voltage-dependent study (−120, −160, and −180 mV) confirmed that the events represented DNA strands unzipping and translocating through the pore, because as the voltage was increased, the time of the Type 1′ events decreased (Figures S9–S11). The less frequent Type 2′ events were readily identifiable and ejected from the channel and omitted from the analysis that follows. Additionally, when the pH was high enough to see single-stranded DNA translocations, these fast events were also not part of the analysis that follows. In the first case, the pH was initially at 5.0. The Type 1′ events represent DNA captured in the pore and held until they unzipped to obtain 150 events that ranged in translocation time from ∼5 s up to 150 s (Figure 8A,B). The median translocation time at pH 5.0 was determined to be 25.0 s (Figure 8A,B, n = 150 events). The broad distribution of the events is exponentially distributed, and to best describe the data, it is shown graphically in box plots in Figure 8A. The boxes represent the lifetimes for 75% of the data, and the bars show the 95% confidence interval. Inspection of these plots illustrates that as the pH was increased the lifetimes decreased. Further, we only report the median lifetimes in the text and in Figure 8B, while providing the error analysis graphically in Figure 8A. Next, the pH was increased to 5.7, and a population of 200 Type 1′ events was analyzed. Type 1′ events represented 100% of the population. From this population, the distribution of times ranged from ∼1 s up to 130 s, and the median time for translocation was determined to be 14.3 s (Figure 8A,B). Studies at pH 6.0 found a population of 250 Type 1′ events representing 70% of the population with a median lifetime of 8.1 s distributed from ∼1 to 40 s. When the pH was adjusted to 6.3, 300 Type 1′ events (28% of the population) were collected and analyzed. From this population of Type 1′ events, the spread in translocation time was <1 s up to 20 s with a median translocation time of 2.7 s (Figure 8A,B). Analysis of the i-motif unzipping at pH 6.8 showed that 4% of the population was Type 1′, and analysis of 300 of these events gave a median lifetime of 21 ms. The last pH studied was 7.2, in which Type 1′ events represented <2% of the population. The median lifetime of this population was 9.0 ms. These translocation times show a clear pH dependence that demonstrates as the pH was increased, the event time decreased. These low numbers of events are challenging to conduct statistical analysis; however, to a first approximation, the event populations appear to be exponentially distributed.
Figure 8.
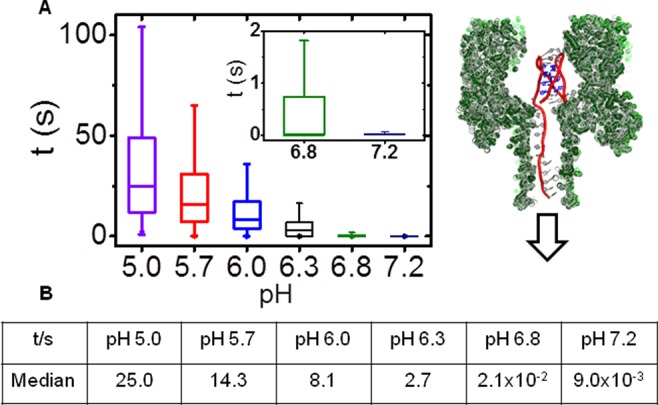
The pH-dependent times measured for the unraveling of the i-motif with a 25-mer poly dA tail at high bias. (A) Plots of unraveling time vs pH for individual molecules of the human telomere i-motif with a 5′-tail. (B) Table of median unraveling times vs pH. All measurements were recorded at −160 mV (cis vs trans) at 22 °C in a solution buffered with 10 mM phosphate and 5 mM citrate and 1.0 M KCl electrolyte.
The pH-dependent results provide insight about the lifetime of the i-motif folds when an electrophoretic force was applied. Comparison of the median i-motif lifetimes between pH 5.0 and 5.7 identifies that at the higher pH, the median lifetime decreases by nearly 2-fold (25.0 s vs 14.3 s, Figure 8B). The observation that the i-motif lifetime under a force decreased as the pH was increased was due to the increased likelihood of deprotonating the C+•C base pairs at the higher pH. The high degree of cooperativity5 in the i-motif folding process supports the observation of the shorter lifetime at pH 5.7 relative to pH 5.0 (Figure 8B). The trend in i-motif lifetime continued to decrease as the pH was increased (Figure 8B). When the pH was 6.8, the measured lifetime was 21 ms, and at pH 7.2 the folded lifetime was 9.0 ms. Measurement of i-motif lifetimes as a function of pH is typically achieved by NMR measurements52 that require large sample sizes or SPR analysis,53 both of which require sophisticated, expensive instruments. Further, NMR and SPR results provide average lifetime values without an added stimulus or force. The millisecond folded lifetimes at pH 6.8 and 7.2 would be very challenging to measure by NMR, AFM, or SPR, if at all possible. Lastly, we evaluated the folded-state lifetime at pH 6.8 under physiological ionic strength (150 mM) and observed the median folded-state lifetime to be similar to that observed at 1.0 M ionic strength (Figure S21). The α-HL nanopore results presented here profile molecules individually and identify the fact that the i-motif lifetime population was broad under a force load and yields a nearly exponential distribution of times. This distribution was expected, due to the first-order processes that regulate unzipping of the strands in the α-HL nanopore.29,49
The results establish the α-HL nanopore as a convenient method for examining i-motif lifetimes as a function of pH under a force. The present approach for generating the force is analogous to the forces generated by RNA polymerases and DNA helicases on genomic DNA.54,55 These enzymes apply forces on DNA from one direction, similar to the way the electrophoretic force does in the α-HL nanopore.29 Further, the force applied by the nanopore at −160 mV is ∼10 pN,56 a value that is similar to that imposed by RNA polymerase II (5–20 pN)54 and DNA helicases (6–16 pN).55 Utilization of the nanopore method allows measurement of the i-motif folded lifetime distribution with an applied force similar to these DNA processing enzymes. Understanding the lifetime an i-motif will maintain its folded state at physiological pH values and will help gauge the ability of the fold to interfere with biological processes. For example, RNA polymerase II synthesizes mRNA at rate of ∼15 ms per nucleotide.57 Any DNA structure that can maintain its fold under the force of RNA polymerase II will cause it to stall, impacting the rate of mRNA synthesis. In this study, we determined that at pH values similar to those found in the nucleus (pH 6.8–7.0),58 the human telomere i-motif has a folded-state lifetime of ∼20 ms (Figure 8B). This is long enough to cause RNA polymerase II to stall. This knowledge is readily obtained by nanopore measurements, yet quite challenging to determine by NMR, SPR, or optical tweezer methods. The human telomere i-motif does not regulate transcription; however, future α-HL nanopore studies on the BCL2(6,7) or c-MYC(59) i-motifs will allow one to understand the lifetimes of these folds under controlled physical conditions, such as those presented in these studies. Determination of these values will provide a window of times in which i-motif folds can regulate transcription, for example, or the length of time these folds may exist and slow helicase activity. Knowledge of these lifetimes will aid in our understanding of these biologically relevant structures that are targets for drug design to treat a number of cancers.3
Lastly, the α-HL nanopore is a stochastic sensor that can identify how solutes in a solution change when the equilibrium is perturbed.23,60 In these studies, the perturbation was pH, and the change was the folding state of the i-motif. The ability to monitor this change in situ provides sensing capabilities of pH. Sensors built around the pH-dependent folding of i-motifs have been utilized to monitor a number of enzymatic reactions and quantify analytes in solution.2,61−63 The present work provides an alternative method to determine how the equilibrium of i-motif folding is affected by external stimuli for reporting purposes.
Conclusions
The present work utilized the nanocavity of the α-HL nanopore (Figure 1B) to monitor the pH-dependent folded structures for the human telomere i-motif (Figure 1A). When the C-rich sequence without a tail was folded (pH 5.0), the structure entered the nanocavity from two different directions that gave characteristic i–t signatures (Figure 3C). These folded states were found to be long-lived and required a reversal of the electrical bias to eject them from the pore. Upon increasing the pH to 6.8, this sequence unfolded to the single-stranded state, and strands quickly translocated through the pore (Figure 5). Upon addition of a 5′ 25-mer poly dA tail, similar i–t patterns were observed at −120 mV (Figure 6B). A titration of the pH was conducted to monitor the transition from the folded to unfolded state (Figure 7). This experiment lead to increasing the voltage to −160 mV, at which point the applied force was capable of unraveling the i-motif folds, allowing determination of the folded-state lifetime under an electrophoretic force. These studies identified that even though the i-motif was folded in a range from pH 5.0 to 7.2, the lifetime of the fold under a force was pH dependent (Figure 8B). The present results establish a method for analyzing lifetimes of i-motif sequences found in gene promoter regions that are important for biological regulation.3 Furthermore, the stochastic sensing capability of the α-HL nanopore23 provides a convenient way to interrogate the folded state of an i-motif in solution when the folding equilibrium is dependent on the physical properties of the solution (i.e., pH) or an analyte that specifically binds these sequences.2,61−63 Future studies with α-HL and i-motifs are anticipated to be applicable in analytical sensing applications as well as biophysical studies that aim to understand the biology of nucleic acids.
Methods
Ion channel recordings, DNA preparation procedures, and ion channel measurements were conducted as previously reported.29,64,65 Details about DNA purification, nanopore construction, and CD spectroscopy procedures can be found in the Supporting Information. The ion channel measurements with different pH values were initiated at pH 5.0 (10 mM KPi and 5 mM citrate) with 1.0 M KCl electrolyte at 22 °C. After collection of enough data at pH 5.0 with one protein channel, 5 μL of 0.2 M NaOH was added to the nanopore chamber to reach pH 5.7. After mixing the solution in the nanopore chamber with a pipet tip, data were collected at the new pH. This process was repeated for pH 6.3 and 6.8. All pH-dependent measurements were collected with the same α-HL nanopore. The pH values for each titration step were determined by placing all components of the analysis chamber in an Eppendorf tube, and then a pH meter was used to determine how much NaOH was needed at each step to obtain the desired pH. The data were collected with a 100 kHz filter with an acquisition rate of 500 kHz. For presentation purposes the data were refiltered to 2 or 10 kHz. All data were processed QuB 1.5.0.31 and plotted using OriginPro 9.1.
Acknowledgments
The authors are grateful to Electronic BioSciences (San Diego, CA) for donation of the instrument for recording the i–t traces and Dr. Henry S. White (University of Utah) for stimulating conversations about the data. The oligonucleotides were provided by the DNA/Peptide core facility at the University of Utah that is supported in part by the NCI Cancer Center Support Grant (P30 CA042014). Funding for this work was provided by the National Institutes of Health (R01 GM093099).
Supporting Information Available
The complete methods, pH-dependent CD spectra, example i–t traces, translocation time distributions, and ion–current distributions. The Supporting Information is available free of charge on the ACS Publications website at DOI: 10.1021/jacs.5b03912.
The authors declare no competing financial interest.
Supplementary Material
References
- Choi J.; Majima T. Chem. Soc. Rev. 2011, 40, 5893–5909 10.1039/c1cs15153c. [DOI] [PubMed] [Google Scholar]
- Wang F.; Liu X.; Willner I. Angew. Chem., Int. Ed. 2015, 54, 1098–1129 10.1002/anie.201404652. [DOI] [PubMed] [Google Scholar]
- Brooks T. A.; Kendrick S.; Hurley L. FEBS J. 2010, 277, 3459–3469 10.1111/j.1742-4658.2010.07759.x. [DOI] [PMC free article] [PubMed] [Google Scholar]
- Choi J.; Kim S.; Tachikawa T.; Fujitsuka M.; Majima T. J. Am. Chem. Soc. 2011, 133, 16146–16153 10.1021/ja2061984. [DOI] [PubMed] [Google Scholar]
- Chen C.; Li M.; Xing Y.; Li Y.; Joedecke C. C.; Jin J.; Yang Z.; Liu D. Langmuir 2012, 28, 17743–17748 10.1021/la303851a. [DOI] [PubMed] [Google Scholar]
- Kang H. J.; Kendrick S.; Hecht S. M.; Hurley L. H. J. Am. Chem. Soc. 2014, 136, 4172–4185 10.1021/ja4109352. [DOI] [PMC free article] [PubMed] [Google Scholar]
- Kendrick S.; Kang H. J.; Alam M. P.; Madathil M. M.; Agrawal P.; Gokhale V.; Yang D.; Hecht S. M.; Hurley L. H. J. Am. Chem. Soc. 2014, 136, 4161–4171 10.1021/ja410934b. [DOI] [PMC free article] [PubMed] [Google Scholar]
- Kendrick S.; Hurley L. H. Pure Appl. Chem. 2010, 82, 1609–1621 10.1351/PAC-CON-09-09-29. [DOI] [PMC free article] [PubMed] [Google Scholar]
- Phan A. T.; Gueron M.; Leroy J. L. J. Mol. Biol. 2000, 299, 123–144 10.1006/jmbi.2000.3613. [DOI] [PubMed] [Google Scholar]
- Song L.; Hobaugh M.; Shustak C.; Cheley S.; Bayley H.; Gouaux J. Science 1996, 274, 1859–1866 10.1126/science.274.5294.1859. [DOI] [PubMed] [Google Scholar]
- Choi J.; Majima T. Photochem. Photobiol. 2013, 89, 513–522 10.1111/php.12042. [DOI] [PubMed] [Google Scholar]
- Phan A. T.; Mergny J. L. Nucleic Acids Res. 2002, 30, 4618–4625 10.1093/nar/gkf597. [DOI] [PMC free article] [PubMed] [Google Scholar]
- Cui J.; Waltman P.; Le V.; Lewis E. Molecules 2013, 18, 12751–12767 10.3390/molecules181012751. [DOI] [PMC free article] [PubMed] [Google Scholar]
- Reilly S. M.; Morgan R. K.; Brooks T. A.; Wadkins R. M. Biochemistry 2015, 54, 1364–1370 10.1021/bi5014722. [DOI] [PMC free article] [PubMed] [Google Scholar]
- Nesterova I. V.; Nesterov E. E. J. Am. Chem. Soc. 2014, 136, 8843–8846 10.1021/ja501859w. [DOI] [PubMed] [Google Scholar]
- Dhakal S.; Yu Z.; Konik R.; Cui Y.; Koirala D.; Mao H. Biophys. J. 2012, 102, 2575–2584 10.1016/j.bpj.2012.04.024. [DOI] [PMC free article] [PubMed] [Google Scholar]
- Dhakal S.; Lafontaine J. L.; Yu Z.; Koirala D.; Mao H. PLoS One 2012, 7, e39271. 10.1371/journal.pone.0039271. [DOI] [PMC free article] [PubMed] [Google Scholar]
- Jung Y.; Cheley S.; Braha O.; Bayley H. Biochemistry 2005, 44, 8919–8929 10.1021/bi0473713. [DOI] [PubMed] [Google Scholar]
- Jain M.; Fiddes I. T.; Miga K. H.; Olsen H. E.; Paten B.; Akeson M. Nat. Methods 2015, 12, 351–356 10.1038/nmeth.3290. [DOI] [PMC free article] [PubMed] [Google Scholar]
- Laszlo A. H.; Derrington I. M.; Ross B. C.; Brinkerhoff H.; Adey A.; Nova I. C.; Craig J. M.; Langford K. W.; Samson J. M.; Daza R.; Doering K.; Shendure J.; Gundlach J. H. Nat. Biotechnol. 2014, 32, 829–833 10.1038/nbt.2950. [DOI] [PMC free article] [PubMed] [Google Scholar]
- Bayley H. Clin. Chem. 2015, 61, 25–31 10.1373/clinchem.2014.223016. [DOI] [PMC free article] [PubMed] [Google Scholar]
- Carson S.; Wanunu M. Nanotechnology 2015, 26, 074004. 10.1088/0957-4484/26/7/074004. [DOI] [PMC free article] [PubMed] [Google Scholar]
- Bayley H.; Cremer P. Nature 2001, 413, 226–230 10.1038/35093038. [DOI] [PubMed] [Google Scholar]
- Wanunu M. Phys. Life Rev. 2012, 9, 125–158 10.1016/j.plrev.2012.05.010. [DOI] [PMC free article] [PubMed] [Google Scholar]
- Robertson J. W.; Kasianowicz J. J.; Banerjee S. Chem. Rev. 2012, 112, 6227–6249 10.1021/cr300317z. [DOI] [PubMed] [Google Scholar]
- An N.; Fleming A. M.; Burrows C. J. J. Am. Chem. Soc. 2013, 135, 8562–8570 10.1021/ja400973m. [DOI] [PMC free article] [PubMed] [Google Scholar]
- Shim J. W.; Tan Q.; Gu L.-Q. Nucleic Acids Res. 2009, 37, 972–982 10.1093/nar/gkn968. [DOI] [PMC free article] [PubMed] [Google Scholar]
- An N.; Fleming A. M.; Middleton E. G.; Burrows C. J. Proc. Natl. Acad. Sci. U. S. A. 2014, 111, 14325–14331 10.1073/pnas.1415944111. [DOI] [PMC free article] [PubMed] [Google Scholar]
- Ding Y.; Fleming A. M.; White H. S.; Burrows C. J. J. Phys. Chem. B 2014, 118, 12873–12882 10.1021/jp5101413. [DOI] [PMC free article] [PubMed] [Google Scholar]
- An N.; Fleming A. M.; White H. S.; Burrows C. J. ACS Nano 2015, 9, 4296–4307 10.1021/acsnano.5b00722. [DOI] [PMC free article] [PubMed] [Google Scholar]
- Vercoutere W.; Winters-Hilt S.; Olsen H.; Deamer D.; Haussler D.; Akeson M. Nat. Biotechnol. 2001, 19, 248–252 10.1038/85696. [DOI] [PubMed] [Google Scholar]
- Vercoutere W. A.; Winters-Hilt S.; DeGuzman V. S.; Deamer D.; Ridino S. E.; Rodgers J. T.; Olsen H. E.; Marziali A.; Akeson M. Nucleic Acids Res. 2003, 31, 1311–1318 10.1093/nar/gkg218. [DOI] [PMC free article] [PubMed] [Google Scholar]
- Jin Q.; Fleming A. M.; Johnson R. P.; Ding Y.; Burrows C. J.; White H. S. J. Am. Chem. Soc. 2013, 135, 19347–19353 10.1021/ja410615d. [DOI] [PMC free article] [PubMed] [Google Scholar]
- Johnson R. P.; Fleming A. M.; Jin Q.; Burrows C. J.; White H. S. Biophys. J. 2014, 107, 924–931 10.1016/j.bpj.2014.07.006. [DOI] [PMC free article] [PubMed] [Google Scholar]
- Wolna A. H.; Fleming A. M.; Burrows C. J. Biochemistry 2014, 53, 7484–93 10.1021/bi501072m. [DOI] [PMC free article] [PubMed] [Google Scholar]
- Shim J. W.; Gu L.-Q. J. Phys. Chem. B 2008, 112, 8354–8360 10.1021/jp0775911. [DOI] [PMC free article] [PubMed] [Google Scholar]
- Van Meervelt V.; Soskine M.; Maglia G. ACS Nano 2014, 8, 12826–12835 10.1021/nn506077e. [DOI] [PMC free article] [PubMed] [Google Scholar]
- Shasha C.; Henley R. Y.; Stoloff D. H.; Rynearson K. D.; Hermann T.; Wanunu M. ACS Nano 2014, 8, 6425–6430 10.1021/nn501969r. [DOI] [PMC free article] [PubMed] [Google Scholar]
- Plesa C.; van Loo N.; Ketterer P.; Dietz H.; Dekker C. Nano Lett. 2015, 15, 732–737 10.1021/nl504375c. [DOI] [PubMed] [Google Scholar]
- Nivala J.; Marks D. B.; Akeson M. Nat. Biotechnol. 2013, 31, 247–250 10.1038/nbt.2503. [DOI] [PMC free article] [PubMed] [Google Scholar]
- Rodriguez-Larrea D.; Bayley H. Nat. Commun. 2014, 5, 4841. 10.1038/ncomms5841. [DOI] [PMC free article] [PubMed] [Google Scholar]
- Arnaut V.; Langecker M.; Simmel F. C. Biophys. J. 2013, 105, 1199–1207 10.1016/j.bpj.2013.07.047. [DOI] [PMC free article] [PubMed] [Google Scholar]
- Rotem D.; Jayasinghe L.; Salichou M.; Bayley H. J. Am. Chem. Soc. 2012, 134, 2781–2787 10.1021/ja2105653. [DOI] [PMC free article] [PubMed] [Google Scholar]
- Soskine M.; Biesemans A.; Moeyaert B.; Cheley S.; Bayley H.; Maglia G. Nano Lett. 2012, 12, 4895–4900 10.1021/nl3024438. [DOI] [PMC free article] [PubMed] [Google Scholar]
- Kawano R.; Osaki T.; Sasaki H.; Takinoue M.; Yoshizawa S.; Takeuchi S. J. Am. Chem. Soc. 2011, 133, 8474–8477 10.1021/ja2026085. [DOI] [PubMed] [Google Scholar]
- Reiner J. E.; Robertson J. W.; Burden D. L.; Burden L. K.; Balijepalli A.; Kasianowicz J. J. J. Am. Chem. Soc. 2013, 135, 3087–3094 10.1021/ja309892e. [DOI] [PMC free article] [PubMed] [Google Scholar]
- Luo L.; German S. R.; Lan W. J.; Holden D. A.; Mega T. L.; White H. S. Annu. Rev. Anal. Chem. 2014, 7, 513–535 10.1146/annurev-anchem-071213-020107. [DOI] [PubMed] [Google Scholar]
- Lieblein A. L.; Furtig B.; Schwalbe H. ChemBioChem 2013, 14, 1226–1230 10.1002/cbic.201300284. [DOI] [PubMed] [Google Scholar]
- Jin Q.; Fleming A. M.; Burrows C. J.; White H. S. J. Am. Chem. Soc. 2012, 134, 11006–11011 10.1021/ja304169n. [DOI] [PMC free article] [PubMed] [Google Scholar]
- Wang Y.; Zheng D.; Tan Q.; Wang M. X.; Gu L. Q. Nat. Nanotechnol. 2011, 6, 668–74 10.1038/nnano.2011.147. [DOI] [PMC free article] [PubMed] [Google Scholar]
- Sauer-Budge A. F.; Nyamwanda J. A.; Lubensky D. K.; Branton D. Phys. Rev. Lett. 2003, 90, 23801. 10.1103/PhysRevLett.90.238101. [DOI] [PubMed] [Google Scholar]
- Canalia M.; Leroy J. L. Nucleic Acids Res. 2005, 33, 5471–5481 10.1093/nar/gki843. [DOI] [PMC free article] [PubMed] [Google Scholar]
- Zhao Y.; Zeng Z.; Kan Z.; Hao Y.; Tan Z. ChemBioChem 2005, 6, 1957–1960 10.1002/cbic.200500175. [DOI] [PubMed] [Google Scholar]
- Larson M. H.; Zhou J.; Kaplan C. D.; Palangat M.; Kornberg R. D.; Landick R.; Block S. M. Proc. Natl. Acad. Sci. U. S. A. 2012, 109, 6555–6560 10.1073/pnas.1200939109. [DOI] [PMC free article] [PubMed] [Google Scholar]
- Ribeck N.; Kaplan D. L.; Bruck I.; Saleh O. A. Biophys. J. 2010, 99, 2170–2179 10.1016/j.bpj.2010.07.039. [DOI] [PMC free article] [PubMed] [Google Scholar]
- Stoddart D.; Franceschini L.; Heron A.; Bayley H.; Maglia G. Nanotechnology 2015, 26, 084002. 10.1088/0957-4484/26/8/084002. [DOI] [PMC free article] [PubMed] [Google Scholar]
- Guo J.; Price D. H. Chem. Rev. 2013, 113, 8583–8603 10.1021/cr400105n. [DOI] [PMC free article] [PubMed] [Google Scholar]
- Ronco C.; Bellomo R.; Kellum J.. Critical Care Nephrology; Elsevier Inc: Philadelphia, PA, 2009; Vol. 2. [Google Scholar]
- Dai J.; Hatzakis E.; Hurley L. H.; Yang D. PLoS One 2010, 5, e11647. 10.1371/journal.pone.0011647. [DOI] [PMC free article] [PubMed] [Google Scholar]
- Reiner J. E.; Balijepalli A.; Robertson J. W.; Campbell J.; Suehle J.; Kasianowicz J. J. Chem. Rev. 2012, 112, 6431–6451 10.1021/cr300381m. [DOI] [PubMed] [Google Scholar]
- Li W.; Feng L.; Ren J.; Wu L.; Qu X. Chem. - Eur. J. 2012, 18, 12637–12642 10.1002/chem.201201914. [DOI] [PubMed] [Google Scholar]
- Dong Y.; Yang Z.; Liu D. Acc. Chem. Res. 2014, 47, 1853–1860 10.1021/ar500073a. [DOI] [PubMed] [Google Scholar]
- Tjong V.; Tang L.; Zauscher S.; Chilkoti A. Chem. Soc. Rev. 2014, 43, 1612–1626 10.1039/C3CS60331H. [DOI] [PubMed] [Google Scholar]
- Zhang B.; Galusha J.; Shiozawa P. G.; Wang G.; Bergren A. J.; Jones R. M.; White R. J.; Ervin E. N.; Cauley C. C.; White H. S. Anal. Chem. 2007, 79, 4778–4787 10.1021/ac070609j. [DOI] [PubMed] [Google Scholar]
- White R. J.; Ervin E. N.; Yang T.; Chen X.; Daniel S.; Cremer P. S.; White H. S. J. Am. Chem. Soc. 2007, 129, 11766–75 10.1021/ja073174q. [DOI] [PubMed] [Google Scholar]
Associated Data
This section collects any data citations, data availability statements, or supplementary materials included in this article.


