


Abstract
Transposable elements (TEs) are mobile genomic DNA sequences found in most organisms. They so densely populate the genomes of many eukaryotic species that they are often the major constituents. With the rapid generation of many plant genome sequencing projects over the past few decades, there is an urgent need for improved TE annotation as a prerequisite for genome-wide studies. Analogous to the use of RNA-seq for gene annotation, we propose a new method for de novo TE annotation that uses as a guide 24 nt-siRNAs that are a part of TE silencing pathways. We use this new approach, called TASR (for Transposon Annotation using Small RNAs), for de novo annotation of TEs in Arabidopsis, rice and soybean and demonstrate that this strategy can be successfully applied for de novo TE annotation in plants.
Executable PERL is available for download from: http://tasr-pipeline.sourceforge.net/
INTRODUCTION
Transposable elements (TEs) are mobile DNA that replicate in their host genome by a mechanism known as transposition. Because of their ability to transpose and generate new insertions, TEs can be major constituents of plant genomes (1,2). TEs are classified based on their transposition intermediate: class I elements, retrotransposons, transpose via an RNA intermediate while class II elements, DNA-transposons, transpose via a DNA intermediate (3). Wrongly considered as ‘junk DNA’, it has become increasingly clear that TEs have helped shape the architecture, function and evolution of host genomes throughout evolution. Several authors have described the direct role of TEs in plant genome size variation (4–6) and as controlling elements of gene expression (7–10).
Despite their high copy number, few active TEs have been observed in plants and the majority of these transposition events occur in stress conditions such as tissue culture (11–13) or in mutants affected in the silencing pathways that repress TE activity, such as ddm1 mutants (14–16). In wild-type plants under ‘normal’ growth conditions, the vast majority of TEs are silent and inactivated by their host via DNA methylation and suppressive histone modifications (17,18).
Unlike genes that are methylated in the CG context that is associated with expression, DNA methylation of TEs occurs concomitantly in CG, CHG and CHH (where H = A, T, or C) contexts giving rise to transcriptional repression known as TGS (Transcriptional Gene Silencing). Such TE methylation requires small interfering RNAs, mostly 24 nucleotides long (24-nt siRNAs), that act via the RdDM (RNA-directed DNA Methylation) pathway (19). The silenced state of TEs is stably maintained across generations which prevents transposition, particularly in the germ cells (20). The conservation of the RdDM pathway among plant species (21) demonstrates its importance for the repression of TE transposition, thereby maintaining genome integrity.
Since the publication of the first plant genome sequence, the model species Arabidopsis thaliana (22), a large number of whole genome assemblies have been made available. This is due to the falling cost and reduced sequencing time using next generation (NGS) technologies (23). The availability of these genomic data sets has provided a unique opportunity to study the biology and evolution of plants at the whole genome scale. Now, genome annotation has become a major bottleneck for genome studies and, in particular, good TE annotations are a challenge. Several methods have been described for TE annotation (24,25) that can be categorized into two types of strategies: library-based or signature-based (26).
In the case of the library-based approach, a collection of reference TEs is used to screen genomes to identify similar sequences. This is typically done using RepeatMasker (27) and a public TE database such as repbase (28) or the MIPS repeat database (29) that contains reference TE sequences from a variety of species. The library-based method has several limitations. While genes are highly conserved between species, TEs diverge rapidly due to the absence of selective pressure. This divergence in TE sequences can limit the performance of the library-based approach. This strategy also presupposes the vertical evolution of TE sequences, yet it has been shown that millions of horizontal transfer events have occurred between divergent plant species over the last few millions of years (30).
Signature-based strategies use TE-specific features such as the presence of coding regions (transposase, reverse-transcriptase, etc.) or structures that characterize particular TE classes, such as LTRs (Long Terminal Repeats) for LTR-retrotransposons or TIRs (Terminal Inverted Repeats) for DNA transposons. Due to the diversity of TEs in terms of coding and structure, a range of specialized programs have been developed (26). These tools are limited, however, to the identification of well-known TE structures and are unable to find new TE classes. The only generally conserved feature among all TE types is their repetitive nature, a consequence of replication in a host genome. Copy number is indeed used by several programs such as RepeatScout (31), PILER (32) or REPET (33). However, differentiating TEs and other repetitive sequences within a genome is challenging since all repeated sequences are not necessarily TEs.
The use of combined evidences such as copy number and structural features should allow one to discriminate between TEs and non-TE repeated sequences. REPET, for example, uses a combination of tools and evidence to annotate TEs, a major step toward the standardization of TE annotation (34). After first identifying repeated sequences with REPET, PASTEC (35) is used to search for the presence of features for repeat classification. However, many of these TE features can be difficult to identify. In addition, a large number of TEs in genomes have no coding capacity (36) or have lost structural features via deletion or recombination. Furthermore, these strategies may be less suited for genomes that have undergone multiple rounds of whole genome duplication (WGD) events, such as soybean (37) resulting in repeated, non-TE sequences. One solution to this issue is to increase the minimum copy number to consider TE candidates. However, most TE families are low copy number while only a few are highly repetitive, as has been shown for LTR-retrotransposons (6).
For obvious reasons, gene annotation has received the most attention from the community and TE annotation has lagged. The use of RNA-seq data for gene annotation has resulted in high-quality gene predictions whereas TE annotation is based on DNA sequence structure or homology, due to the absence of easily identifiable transcripts. However, host genomes are able to recognize and silence endogenous TEs using 24 nt-siRNAs and the RdDM (RNA-directed DNA Methylation) pathway. We developed an approach analogous to the use of RNA-seq mapping for gene annotation whereby TEs are annotated through the mapping of 24 nt-siRNAs, termed TASR (for Transposon Annotation using Small RNAs). We demonstrate the power of this approach in several plant genomes, soybean, Arabidopsis and rice, for which we were able to annotate additional TE sequences not present in existing repeat annotations, some of which were previously annotated as genes.
MATERIALS AND METHODS
Mapping of 24 nt-siRNAs
Arabidopsis, rice and soybean siRNAs libraries derived from leaf were used for this study. Non-redundant 24 nt-siRNAs sequences were mapped using Bowtie2 (38) onto the TAIR10 assembly for Arabidopsis http://www.arabidopsis.org/, IRGSP1 http://rapdb.dna.affrc.go.jp/ for rice and Glyma1 http://www.soybase.org/ for soybean. Highly sensitive parameters were used for Bowtie2 mapping: -a -D 10 -R 5 -N 1 -L 15 -i S,1,0.50.
Extracting loci corresponding to 24 nt-siRNAs positions
We merged the different 24 nt-siRNAs mapping intervals (start to stop positions) present in a window of 150 bp and retained all loci with a length between 80 bp and 20 kbp and at least four different 24 nt-siRNAs. After extracting the loci with mapped 24 nt-siRNAs, we masked tandem repeats using Tandem Repeat Finder (39).
Clustering of TE paralogs
A clustering strategy was used as a first step in an all-by-all comparison of the total sets of ‘TE’ loci harvested after mapping of the 24 nt-siRNAs. This was done using BLAST with the following parameters: -r 2 (reward for a nucleotide match, this is a default option in Blast2+ version) and -m 8 (alignment view options: tabular) and E-value of 1e-20. The BLAST output was then used to define clusters based on sequence similarity using SILIX (40) with a minimum of 80% sequence identity and 80% coverage (please refer to SILIX manual http://lbbe.univ-lyon1.fr/Documentation,3012.html?lang=fr).
Re-defining TE boundaries
For each paralog within each cluster that contained at least two copies, we extracted the flanking (10 kbp upstream and downstream) and performed an all-by-all comparison using BLASTn with the same parameters as for clustering. We then defined the boundaries of each paralog using the BLAST alignment against the other members of a cluster after reducing redundant sequences using UCLUST algorithm (41). When the cluster contained more than 10 paralogs, TASR retained sequences that match to at least 30% of other members to avoid discarding some variant sequences that are a part of divergent paralogs and only sequences related to that particular family were kept and nested insertions removed, as well as incorrect TE boundaries. For clusters with fewer than 10 copies, the threshold varied depending on the cluster size. For clusters that contained only two members, only sequences that aligned to both members were kept. Finally clusters that contained between 3 and 10, an alignment to at least three paralogs was required to maintain the family related sequences.
Comparing TE annotations
We downloaded the public TE annotations for Arabidopsis (http://www.arabidopsis.org/), rice (http://rapdb.dna.affrc.go.jp/) and soybean (http://www.soybase.org/) in GFF format. We then compared each start to end positions with TEs annotated by TASR using the intersectBed and substractBed function of BEDtools (42). This allowed us to produce a comparison of annotation intervals at the level of specific nucleotides.
TE classification using PASTEC
The TE candidates as defined by TASR were classified using the PASTEC classification tool (https://urgi.versailles.inra.fr/Tools/PASTEClassifier).
RPKM calculations for 24 nt-siRNAs
In order to calculate the 24 nt-siRNAs RPKM score, we mapped the 24 nt-siRNAs sequences against their respective genomes using Bowtie2 with default settings. Uniquely and multiple mapped reads without mismatches were selected to calculate RPKM for each TE locus.
Calculation of methylation levels
The public whole-genome methylation data of Arabidopsis (43) and rice (44) and data for soybean (Kim et al., unpublished, available on request) were used to determine methylation levels of TEs. Raw sequence reads with primer/adaptor sequences or quality score under 20 were filtered out using NGS QC Toolkit v2.3 (45) with default parameters. High-quality reads were aligned to Arabidopsis (TAIR10), rice (IRGSP 1.0) or soybean (Glyma1) genomes using Bismark v0.10.1 (46). Only uniquely mapped reads were used and potential clonal bias from polymerase chain reaction amplification was removed from further analysis. Methylated cytosines were determined using the binomial distribution as previously described (47). The error rates due to incomplete bisulfite conversion were estimated from the percentage of methylated cytosines at reference cytosine positions in the unmethylated chloroplast genomes for each species. Weighted methylation levels (48) of TEs were calculated for all three cytosine contexts for further analysis.
RESULTS
24 nt-siRNA as guide for TE annotation
An overview of the TASR approach is as follows (Figure 1): 24 nt-siRNAs were mapped to the genome using a short-read alignment program such as Bowtie2 (38). The 24 nt-siRNAs map preferentially to TEs and their diverged copies in a genome, even though the 24 nt-siRNAs ‘mapping profiles’ may be complex (Figure 1-I and 1-II-A). For most TEs in a genome, 24 nt-siRNAs covered the full-length element and correspond to the exact TE boundaries (Figure 1-I-A). However, 24 nt-siRNAs can spread beyond the TE boundaries, or not cover the entire length of an element (Figure 1-I-B and 1-I-C). This could be due to missing 24 nt-siRNAs sequences in the library or because the 24 nt-siRNAs that map to a locus are produced by a diverged TE copy. The success of this approach assumes that at least one member of each TE family generates 24 nt-siRNAs. Therefore, by reporting all the potential 24 nt-siRNAs hits in the genome and allowing mismatches, most paralogs of a TE ‘family’ are recovered, even if they are diverged at the sequence level. Supplemental steps are necessary to recover full-length elements (Figure 1-II-B to F). After extracting the genomic intervals that correspond to mapped 24 nt-siRNAs (Figure 1-II-B), an all-by-all comparison is done to define clusters, or families (Figure 1-II-C). We required that clusters have at least two members, as at least two copies are needed to define TE boundaries. These repeated sequences are likely to be TEs. For each paralog within a cluster, we extracted the flanking genomic regions (Figure 1-II-D). In order to recover potentially missing TE parts, an all-by-all comparison of the paralogs, including flanking sequences, was then done. After the alignment, only sequences present in most of the paralogs were retained, thereby, allowing exact TE borders to be detected (Figure 1-II-E) and removal of non-TE sequences and nested TE insertions.
Figure 1.

Workflow of the de-novo TE annotation pipeline using 24 nt-siRNAs mapping (TASR). (I) Examples of 24 nt-siRNAs ‘mapping profiles’ (A) Expected 24 nt-siRNA TE mapping profile when the siRNAs cover the full length TE and correspond to TE boundaries. (B) 24 nt-siRNAs spread beyond the TE boundaries (+). (C) Missing 24 nt-siRNAs. Cases B and C concern the 5', 3' part or both sides of a TE. (II) The TASR pipeline. (A) Mapping 24 nt-siRNAs to a genome. (B) Extraction of genomic intervals corresponding to the different instances shown in (I). (C) Clustering of TE paralogs based on sequence similarity. (D) Extending flanking regions, (E) Re-defining the boundaries for each TE paralog using an all-against-all comparison, including flanking regions. (F) Separate multi-FASTA files containing TE paralogs for each family.
de novo re-annotation of Arabidopsis, rice and soybean genome using TASR
We tested the new TE annotation strategy by using it to de novo re-annotate TEs from three different plant species: Arabidopsis, rice and soybean. These species were chosen based on their range of genome sizes (135 Mbp for Arabidopsis, 382 Mbp for rice and 975 Mbp for soybean) and because of their high-quality TE annotations in order to evaluate the performance of TASR. We use de novo TE libraries obtained by TASR to mask the genome of these species using RepeatMasker (http://www.repeatmasker.org/) and compared the annotation results with the current TE annotations (TAIR10 for Arabidopsis http://www.arabidopsis.org/, IRGSP1 http://rapdb.dna.affrc.go.jp/ for rice and Soybase http://www.soybase.org/ for soybean). We were able to recover 70% (16 Mbp), 94% (150 Mbp) and 96% (427 Mbp) of the Arabidopsis, rice and soybean public TE annotations, respectively (Figure 2-A). Of note, we identified an additional 4 Mbp (20%) (Arabidopsis), 38 Mbp (20%) (rice) and 68 Mbp (14%) (soybean) of potential TE sequences, absent from the public TE annotations. These differences correspond to changes in TE boundaries and to elements absent from one or the other TE annotations. Differentiating between these two categories is challenging, particularly because of nested and old, fragmented TE insertions, especially in large genomes such as soybean.
Figure 2.
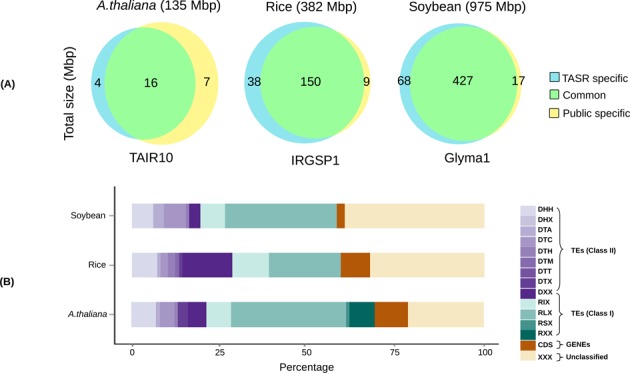
Venn diagrams showing the comparison of the public TE annotations and TASR TE annotations and bar plots of TASR-specific TE classifications. (A) Green corresponds to common TEs between the two annotations in Mbp. Blue corresponds to TASR-specific TE elements and absent from the public annotations. Yellow corresponds to the TEs from the public annotation that are absent in the TASR TE annotations. (B) TASR-specific TE classification according to Wicker's classification. Green colors correspond to class I transposons. Purple colors correspond to class II elements. Rust colors correspond to CDS sequences and yellow to unclassified TASR-specific TEs.
Several analyses were undertaken in order to confirm that sequences defined by TASR were TE-related. We first calculated the density of 24 nt-siRNAs (RPKM score) and percentage of methylation in the three methylation contexts CG,CHG and CHH (H = A,T or C) of TASR-specific TEs and the public TE annotations (Figure 3). From this, we observed that the public annotations for Arabidopsis and rice were depleted in 24 nt-siRNAs and methylation as compared to the TASR TE annotations. Since TASR is based on 24 nt-siRNAs mapping, it is not surprising that some TE families were missed if they do not produce siRNAs for silencing. Analysis of TEs missed by TASR reveals that most correspond to divergent and siRNA ‘poor’ paralogs, rather than entirely missed families. An example is represented in Supplementary Figure S1 for rice TE family ENSPM7_OS for which TASR missed 8% of the paralogs (Supplementary Figure S1-A) that are 24 nt-siRNA poor (Supplementary Figure S1-B) and correspond to highly divergent copies (Supplementary Figure S1-C). However, the use of a similarity search (RepeatMasker) allowed us to recover most of ENSPM7_OS paralogs (92%) even with no matching 24 nt-siRNAs (Supplementary Figure S1-B). The reason for which some paralogs are unable to produce siRNAs remains unknown. However, it is clear the age of TE copies does not explain the loss of 24 nt-siRNAs and methylation as has been shown in Arabidopsis (49).
Figure 3.

Comparison of the percentage of methylation and 24 nt-siRNAs densities between TEs annotated using TASRs and the public TE annotation in Arabidopsis, rice and soybean.
We also compared the genomic distribution of TASR-specific TEs with the public TEs to determine similarities and differences in genomic distribution. TASR-specific TEs and the reference TEs show a nearly identical distribution (an example is shown in Supplementary Figure S2). It is clear that TASR-defined TEs are similar to TEs in general as they are both highly repeated in the genome, abundant in the peri-centromeric regions and have relatively high levels of methylation and 24 nt-siRNAs, signatures of the RdDM silencing pathway. However, this is not enough to confirm that TASR TE candidates are real TE sequences since other non-TE sequences in the genome could be RdDM targets and thus a source of 24 nt-siRNAs (50).
We classified the TASR-specific TEs using PASTEC (35) (Supplementary Tables S1, S2 and S3). TE candidates that were not classified by PASTEC were first used as Blast queries against the classified elements since some paralogs are difficult to classify as they have lost some structural features due to fragmentation and deletion. Secondly, we performed a similarity search against a collection of TE sequences including reference elements from Repbase (28) and MIPS repeat database (29). We also used those sequences to Blast against Coding DNA Sequence (CDS) corresponding to host genes. The results of this is shown in Figure 2-B. 71%, 58% and 57% of Arabidopsis, rice and soybean TASR-specific TE fractions, respectively, were assigned to different classes and superfamilies. It is important, however, to note that 9%, 8% and 2% (1.8%, 1.6% and 0.27% from the total TASR TEs) of Arabidopsis, rice and soybean TASR-specific TE candidates produce matches against CDS sequences ranging from few base pair to full length CDS. It is known that in plants some genes can be targeted by the RdDM pathway (51,52). Therefore, if an RdDM targeted gene is present in at least two copies it could be falsely identified as TE by TASR. It have been also shown that some TE superfamilies such as Helitrons (53) or CACTA (54) can capture gene fragments resulting in the presence of CDS sequences inside TEs. Finally, approximately half of the ‘host genes’ are annotated as ‘unknown’ or ‘hypothetical genes’ and some encode proteins, such as reverse transcriptase, helicase or transposase (see Supplementary Tables S4, S5 and S6). Furthermore, the number of duplicated genes is much higher than those falsely identified by TASR. For example, in soybean more than 75% of the 46 000 genes are present in at least two copies, a consequence of two rounds of WGD (37). However, the fraction of TASR candidate TEs that match CDS represents only 1.89% of the total CDS length. Thus, the use of TASR pipeline, even when considering low copy number (at least two copy number here) TEs, avoids the general misidentification of multi-copy genes. In order to decrease the percentage of CDS sequences captured by TASR, the minimum copy number for considering TE candidates can be increased. However this will be at the expense of the sensitivity of the approach (see Supplementary Table S7). We should also note that 21%, 32% and 41% of TASR-specific TE candidates in Arabidopsis, rice and soybean, respectively were not classified automatically and require manual curation to determine the nature of those sequences. However, if all TE candidates detected using TASR are considered, the unclassified fraction represents only 4%, 6% and 5% in Arabidopsis, rice and soybean, respectively, indicative of good specificity of the TASR pipeline.
Comparison of TASR with other de novo repeats identification tools
In order to further evaluate the performance of the TASR strategy, we compared TASR TE libraries with TE libraries obtained using two other de novo TE detection tools, RepeatScout (RS) and REPET. We first measured the size of the TE sequences obtained by the three different strategies in Arabidopsis and rice (Figure 4-A). The distribution of relative length frequencies of TASR-generated TE libraries were more similar to that of REPET than to RepeatScout which supports the validity of the TASR approach. We next used the three TE libraries to mask the genomes of Arabidopsis and rice using the same RepeatMasker criteria (Figure 4-B). For Arabidopsis, there was no significant difference between RepeatScout/REPET and TASR in term of percentage of genome masked. However, for rice TASR detected about 33 Mbp of TE and TE-related sequences not masked with either the RepeatScout or REPET libraries.
Figure 4.
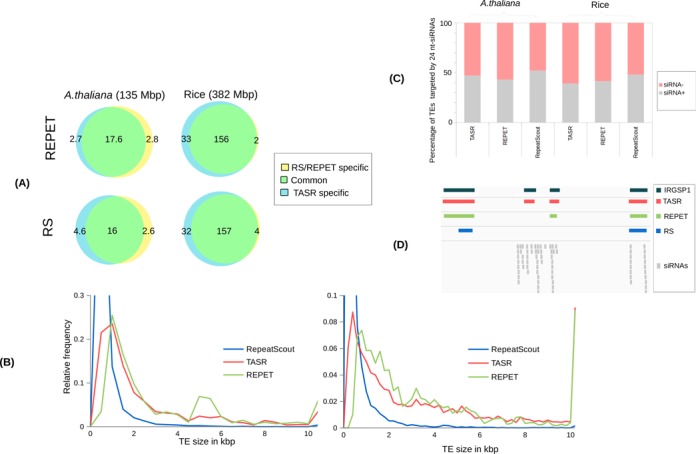
Comparison of TE annotations obtained by TASR with RepeatScout and REPET. (A) Venn diagrams showing the common and specific TE fractions in Mbp obtained using TASR and RepeatScout/REPET. Blue is TASR-specific TEs, green common TEs and yellow RepeatScout/REPET-specific TEs. (B) Relative frequency distribution of library length in kbp generated by RepeatScout, REPET and TASR. Note the relative frequency was limited in Y-axis to facilitate comparisons. (C) Comparison of the percentage of TEs targeted by 24 nt-siRNAs between TASR, REPET and RepeatScout. (D) Genome Browser screenshot showing representative example of TE annotation obtained by TASR, REPET and RepeatScout.
As shown in Supplementary Figure S1 some diverged TE paralogs were missed by TASR because of the absence of 24 nt-siRNAs. In order to determine whether there is a bias in detecting siRNA-rich TEs as compared to other methods, we labeled the TASR annotated TEs as siRNA- and siRNA+ depending on the presence or absence of 24 nt-siRNAs matches as described by Hollister et al. (55). There was no bias in siRNA- TE paralogs detected using TASR as compared to either REPET or RepeatScout (Figure 4-C and D). This can be explained by the similarity search (RepeatMasker) step using the TE library obtained by TASR which allowed the recovery of most but not all of siRNA- TE copies.
DISCUSSION
In contrast to genes, relatively few computational tools are available for TE annotation. This may be a consequence of considering TEs to be ‘junk DNA’ with little functional impact. But this paradigm has shifted as it has been shown that low copy TEs can be incorrectly annotated as genes and that TEs have functional roles within a genome, often at the regulatory level (7–10). A more thorough understanding of the role of TEs at the genetic and epigenetic level requires improved TE annotations. Despite advances in TE annotation, recognizing TEs in DNA sequences and differentiating them from non-TE repeated sequences, such as gene families, retropseudogenes, segmental duplications, or non-genic dispersed duplications, remains a challenge. Most, if not all, TE annotations have been based on the DNA sequence itself, dependent on knowledge of TE structures and features. We demonstrate the use of the biological system, specifically the 24 nt-siRNAs that are a part of the RdDM pathway, as a tool for de novo TE annotation in plants.
Using rice, Arabidopsis and soybean as exemplars, our approach recovers most of the previously described TEs within these genomes in addition to annotating new TE components. The TASR pipeline can, in a single run, harvest all classes and types of TEs including non-autonomous ones that have been particularly difficult to annotate using previous strategies. A further advantage of using TASR for TE annotation is the relatively low computing overhead (∼1 h for Arabidopsis using 8 CPUs) due to the use of 24 nt-siRNAs that target only a fraction of a genome. An added benefit is that it is relatively simple and inexpensive to generate and sequence small RNA libraries, the substrate for the TASR pipeline. However, TASR may falsely annotate some gene families as TEs if at least two highly similar members are targeted by 24 nt-siRNAs, such as some gene families (Supplementary Tables S4, S5 and S6).
A full understanding of how the different TASR steps affect the final annotation will enable a user to have a better interpretation of TASR-annotated TEs. Since the TASR pipeline is based on 24 nt-siRNAs, the quality of the small RNA library is critical. The tissue used to generate the siRNA library could affect the quality of TE annotation. It is known that 24 nt-siRNAs differentially accumulate in various tissues, especially in flowers and young fruit in Arabidopsis (56,57), thus 24 nt-siRNAs libraries obtained from those organs may be more suitable for the TASR pipeline. We tested TASR using a flower-derived 24 nt-siRNAs library in Arabidopsis but did not observe significant differences versus a leaf 24 nt-siRNAs library (data not shown) indicating that the diversity rather than the abundance of 24 nt-siRNAs is most critical. The mapping criteria of 24 nt-siRNAs onto the reference genome is also critical given that not all TE paralogs are RdDM targeted (Figure 3 and Supplementary Figure S1). This is why we employed low stringency mapping criteria by allowing mismatches to increase the number of mapped 24 nt-siRNAs, thereby increasing the opportunity to define diverged TE paralogs.
To harvest 24 nt-siRNA target regions, we merged mapped 24 nt-siRNAs within 150 bp windows. The size of the window was chosen after testing various sizes (50, 100, 150, 200, etc). When the window size was increased, the chance of merging adjacent elements increased. Conversely, when the window size was decreased, the frequency of splitting single elements into multiple pieces increased. Windows of 150 bp were optimal in our tests but this criterion may need to be changed based on the biology of the target genome. Moreover, selecting only loci with high densities of non-redundant 24 nt-siRNAs increased specificity, but at the expense of sensitivity.
Issues with clustering of TE copies may arise as 24 nt-siRNAs mapping intervals can extend outside TE boundaries or not fully cover an element (Figure 1-I). Therefore, a low percentage of coverage (80% coverage) was used to ensure grouping of TE family members, even those with incorrect defined TE borders. Increasing the percentage of coverage would produce more consistent and homogeneous clusters but would increase the risk of splitting a TE family in two or more clusters if some copies had inexact borders, as shown in Figure 1-IA. The missing paralogous TE copies can be recovered using homology-based searches (e.g. RepeatMasker).
The TASR pipeline is, to our knowledge, the first direct use of an epigenetic signal for genome annotation. We demonstrate the efficiency of using such a biological system for de novo TE annotation in plants. An understanding of the methodology used for TE annotation and inherent limits is critical for downstream analysis. In some cases, manual curation may be necessary, for example, to define single copy elements. We believe that the use of TASR pipeline for TE annotation in plants will lead to a better understanding of the biological and evolutionary role of TEs in molding and regulating host genomes.
SUPPLEMENTARY DATA
Supplementary Data are available at NAR Online.
Acknowledgments
We would like to thank Robert J Schmitz and Marie Mirouze for their critical comments on the manuscript and for discussions together with two anonymous reviewers.
FUNDING
National Science Foundation [1339194 and 1229956 to S.A.J.]. Funding for open access charge: National Science Foundation [1339194 and 1229956 to S.A.J.].
Conflict of interest statement. None declared.
REFERENCES
- 1.Bennetzen J.L., Ma J., Devos K.M. Mechanisms of recent genome size variation in flowering plants. Ann. Bot. 2005;95:127–132. doi: 10.1093/aob/mci008. [DOI] [PMC free article] [PubMed] [Google Scholar]
- 2.Vitte C., Fustier M.-A., Alix K., Tenaillon M.I. The bright side of transposons in crop evolution. Brief. Funct. Genomics. 2014;13:276–295. doi: 10.1093/bfgp/elu002. [DOI] [PubMed] [Google Scholar]
- 3.Wicker T., Sabot F., Hua-Van A., Bennetzen J.L., Capy P., Chalhoub B., Flavell A., Leroy P., Morgante M., Panaud O., et al. A unified classification system for eukaryotic transposable elements. Nat. Rev. Genet. 2007;8:973–982. doi: 10.1038/nrg2165. [DOI] [PubMed] [Google Scholar]
- 4.Ma J., Bennetzen J.L. Rapid recent growth and divergence of rice nuclear genomes. Proc. Natl. Acad. Sci. U. S. A. 2004;101:12404–12410. doi: 10.1073/pnas.0403715101. [DOI] [PMC free article] [PubMed] [Google Scholar]
- 5.Vitte C., Panaud O. LTR retrotransposons and flowering plant genome size: Emergence of the increase/decrease model. Cytogenet. Genome Res. 2005;110:91–107. doi: 10.1159/000084941. [DOI] [PubMed] [Google Scholar]
- 6.El Baidouri M., Panaud O. Comparative genomic paleontology across plant kingdom reveals the dynamics of TE-driven genome evolution. Genome Biol. Evol. 2013;5:954–965. doi: 10.1093/gbe/evt025. [DOI] [PMC free article] [PubMed] [Google Scholar]
- 7.Xiao H., Jiang N., Schaffner E., Stockinger E.J., van der Knaap E. A retrotransposon-mediated gene duplication underlies morphological variation of tomato fruit. Science. 2008;319:1527–1530. doi: 10.1126/science.1153040. [DOI] [PubMed] [Google Scholar]
- 8.Martin A., Troadec C., Boualem A., Rajab M., Fernandez R., Morin H., Pitrat M., Dogimont C., Bendahmane A. A transposon-induced epigenetic change leads to sex determination in melon. Nature. 2009;461:1135–1138. doi: 10.1038/nature08498. [DOI] [PubMed] [Google Scholar]
- 9.Studer A., Zhao Q., Ross-Ibarra J., Doebley J. Identification of a functional transposon insertion in the maize domestication gene tb1. Nat. Genet. 2011;43:1160–1163. doi: 10.1038/ng.942. [DOI] [PMC free article] [PubMed] [Google Scholar]
- 10.Butelli E., Licciardello C., Zhang Y., Liu J., Mackay S., Bailey P., Reforgiato-Recupero G., Martin C. Retrotransposons control fruit-specific, cold-dependent accumulation of anthocyanins in blood oranges. Plant Cell. 2012;24:1242–1255. doi: 10.1105/tpc.111.095232. [DOI] [PMC free article] [PubMed] [Google Scholar]
- 11.Hirochika H. Activation of tobacco retrotransposons during tissue culture. EMBO J. 1993;12:2521–2528. doi: 10.1002/j.1460-2075.1993.tb05907.x. [DOI] [PMC free article] [PubMed] [Google Scholar]
- 12.Sabot F., Picault N., El-Baidouri M., Llauro C., Chaparro C., Piegu B., Roulin A., Guiderdoni E., Delabastide M., McCombie R., et al. Transpositional landscape of the rice genome revealed by paired-end mapping of high-throughput re-sequencing data. Plant J. 2011;66:241–246. doi: 10.1111/j.1365-313X.2011.04492.x. [DOI] [PubMed] [Google Scholar]
- 13.Grandbastien M.-A. Stress activation and genomic impact of plant retrotransposons. J. Soc. Biol. 2004;198:425–432. [PubMed] [Google Scholar]
- 14.Hirochika H., Okamoto H., Kakutani T. Silencing of retrotransposons in arabidopsis and reactivation by the ddm1 mutation. Plant Cell. 2000;12:357–369. doi: 10.1105/tpc.12.3.357. [DOI] [PMC free article] [PubMed] [Google Scholar]
- 15.Tsukahara S., Kobayashi A., Kawabe A., Mathieu O., Miura A., Kakutani T. Bursts of retrotransposition reproduced in Arabidopsis. Nature. 2009;461:423–426. doi: 10.1038/nature08351. [DOI] [PubMed] [Google Scholar]
- 16.Mirouze M., Reinders J., Bucher E., Nishimura T., Schneeberger K., Ossowski S., Cao J., Weigel D., Paszkowski J., Mathieu O. Selective epigenetic control of retrotransposition in Arabidopsis. Nature. 2009;461:427–430. doi: 10.1038/nature08328. [DOI] [PubMed] [Google Scholar]
- 17.Rigal M., Mathieu O. A ‘mille-feuille’ of silencing: Epigenetic control of transposable elements. Biochim. Biophys. Acta - Gene Regul. Mech. 2011;1809:452–458. doi: 10.1016/j.bbagrm.2011.04.001. [DOI] [PubMed] [Google Scholar]
- 18.Heard E., Martienssen R.A. Transgenerational epigenetic inheritance: Myths and mechanisms. Cell. 2014;157:95–109. doi: 10.1016/j.cell.2014.02.045. [DOI] [PMC free article] [PubMed] [Google Scholar]
- 19.Saze H., Tsugane K., Kanno T., Nishimura T. DNA methylation in plants: relationship to small RNAs and histone modifications, and functions in transposon inactivation. Plant Cell Physiol. 2012;53:766–84. doi: 10.1093/pcp/pcs008. [DOI] [PubMed] [Google Scholar]
- 20.Slotkin R.K., Vaughn M., Borges F., Tanurdzić M., Becker J.D., Feijó J.A., Martienssen R.A. Epigenetic reprogramming and small RNA silencing of transposable elements in pollen. Cell. 2009;136:461–472. doi: 10.1016/j.cell.2008.12.038. [DOI] [PMC free article] [PubMed] [Google Scholar]
- 21.Matzke M.A., Mosher R.A. RNA-directed DNA methylation: an epigenetic pathway of increasing complexity. Nat. Rev. Genet. 2014;15:394–408. doi: 10.1038/nrg3683. [DOI] [PubMed] [Google Scholar]
- 22.The Arabidopsis Genome Initiative. Analysis of the genome sequence of the flowering plant Arabidopsis thaliana. Nature. 2000;408:796–815. doi: 10.1038/35048692. [DOI] [PubMed] [Google Scholar]
- 23.Michael T.P., Jackson S. The First 50 Plant Genomes. Plant Genome. 2013;6 doi:10.3835/plantgenome2013.03.0001in. [Google Scholar]
- 24.Bergman C.M., Quesneville H. Discovering and detecting transposable elements in genome sequences. Brief. Bioinform. 2007;8:382–392. doi: 10.1093/bib/bbm048. [DOI] [PubMed] [Google Scholar]
- 25.Permal E., Flutre T., Quesneville H. Roadmap for annotating transposable elements in eukaryote genomes. Methods Mol. Biol. 2012;859:53–68. doi: 10.1007/978-1-61779-603-6_3. [DOI] [PubMed] [Google Scholar]
- 26.Lerat E. Identifying repeats and transposable elements in sequenced genomes: how to find your way through the dense forest of programs. Heredity (Edinb). 2010;104:520–533. doi: 10.1038/hdy.2009.165. [DOI] [PubMed] [Google Scholar]
- 27.Tempel S., Repeatmasker U. Using and understanding RepeatMasker. Methods Mol. Biol. 2012;859:29–51. doi: 10.1007/978-1-61779-603-6_2. [DOI] [PubMed] [Google Scholar]
- 28.Jurka J., Kapitonov V.V., Pavlicek A., Klonowski P., Kohany O., Walichiewicz J. Repbase Update, a database of eukaryotic repetitive elements. Cytogenet. Genome Res. 2005;110:462–467. doi: 10.1159/000084979. [DOI] [PubMed] [Google Scholar]
- 29.Nussbaumer T., Martis M.M., Roessner S.K., Pfeifer M., Bader K.C., Sharma S., Gundlach H., Spannagl M. MIPS PlantsDB: a database framework for comparative plant genome research. Nucleic Acids Res. 2013;41:D1144–D1151. doi: 10.1093/nar/gks1153. [DOI] [PMC free article] [PubMed] [Google Scholar]
- 30.El Baidouri M., Carpentier M.-C., Cooke R., Gao D., Lasserre E., Llauro C., Mirouze M., Picault N., Jackson S.A., Panaud O. Widespread and frequent horizontal transfers of transposable elements in plants. Genome Res. 2014;24:831–838. doi: 10.1101/gr.164400.113. [DOI] [PMC free article] [PubMed] [Google Scholar]
- 31.Price A.L., Jones N.C., Pevzner P.A. De novo identification of repeat families in large genomes. Bioinformatics. 2005;21(Suppl 1):i351–i358. doi: 10.1093/bioinformatics/bti1018. [DOI] [PubMed] [Google Scholar]
- 32.Edgar R.C., Myers E.W. PILER: identification and classification of genomic repeats. Bioinformatics. 2005;21(Suppl 1):i152–i158. doi: 10.1093/bioinformatics/bti1003. [DOI] [PubMed] [Google Scholar]
- 33.Flutre T., Duprat E., Feuillet C., Quesneville H. Considering transposable element diversification in de novo annotation approaches. PLoS One. 2011;6:e91929. doi: 10.1371/journal.pone.0016526. [DOI] [PMC free article] [PubMed] [Google Scholar]
- 34.Ragupathy R., You F.M., Cloutier S. Arguments for standardizing transposable element annotation in plant genomes. Trends Plant Sci. 2013;18:367–376. doi: 10.1016/j.tplants.2013.03.005. [DOI] [PubMed] [Google Scholar]
- 35.Hoede C., Arnoux S., Moisset M., Chaumier T., Inizan O., Jamilloux V., Quesneville H. PASTEC: An automatic transposable element classification tool. PLoS One. 2014;9:e91929. doi: 10.1371/journal.pone.0091929. [DOI] [PMC free article] [PubMed] [Google Scholar]
- 36.Feschotte C., Jiang N., Wessler S.R. Plant transposable elements: where genetics meets genomics. Nat. Rev. Genet. 2002;3:329–341. doi: 10.1038/nrg793. [DOI] [PubMed] [Google Scholar]
- 37.Schmutz J., Cannon S.B., Schlueter J., Ma J., Mitros T., Nelson W., Hyten D.L., Song Q., Thelen J.J., Cheng J., et al. Genome sequence of the palaeopolyploid soybean. Nature. 2010;463:178–183. doi: 10.1038/nature08670. [DOI] [PubMed] [Google Scholar]
- 38.Langmead B., Salzberg S.L. Fast gapped-read alignment with Bowtie 2. Nat. Methods. 2012;9:357–359. doi: 10.1038/nmeth.1923. [DOI] [PMC free article] [PubMed] [Google Scholar]
- 39.Benson G. Tandem repeats finder: a program to analyze DNA sequences. Nucleic Acids Res. 1999;27:573–580. doi: 10.1093/nar/27.2.573. [DOI] [PMC free article] [PubMed] [Google Scholar]
- 40.Miele V., Penel S., Duret L. Ultra-fast sequence clustering from similarity networks with SiLiX. BMC Bioinformatics. 2011;12:116. doi: 10.1186/1471-2105-12-116. [DOI] [PMC free article] [PubMed] [Google Scholar]
- 41.Edgar R.C. Search and clustering orders of magnitude faster than BLAST. Bioinformatics. 2010;26:2460–2461. doi: 10.1093/bioinformatics/btq461. [DOI] [PubMed] [Google Scholar]
- 42.Quinlan A.R., Hall I.M. BEDTools: a flexible suite of utilities for comparing genomic features. Bioinformatics. 2010;26:841–842. doi: 10.1093/bioinformatics/btq033. [DOI] [PMC free article] [PubMed] [Google Scholar]
- 43.Schmitz R.J., Schultz M.D., Lewsey M.G., O'Malley R.C., Urich M.A., Libiger O., Schork N.J., Ecker J.R. Transgenerational epigenetic instability is a source of novel methylation variants. Science. 2011;334:369–373. doi: 10.1126/science.1212959. [DOI] [PMC free article] [PubMed] [Google Scholar]
- 44.Chodavarapu R.K., Feng S., Ding B., Simon S.A., Lopez D., Jia Y., Wang G.-L., Meyers B.C., Jacobsen S.E., Pellegrini M. Transcriptome and methylome interactions in rice hybrids. Proc. Natl. Acad. Sci. 2012;109:12040–12045. doi: 10.1073/pnas.1209297109. [DOI] [PMC free article] [PubMed] [Google Scholar]
- 45.Patel R.K., Jain M. NGS QC toolkit: A toolkit for quality control of next generation sequencing data. PLoS One. 2012;7:e30619. doi: 10.1371/journal.pone.0030619. [DOI] [PMC free article] [PubMed] [Google Scholar]
- 46.Krueger F., Andrews S.R. Bismark: a flexible aligner and methylation caller for Bisulfite-Seq applications. Bioinformatics. 2011;27:1571–1572. doi: 10.1093/bioinformatics/btr167. [DOI] [PMC free article] [PubMed] [Google Scholar]
- 47.Lister R., Pelizzola M., Dowen R.H., Hawkins R.D., Hon G., Tonti-Filippini J., Nery J.R., Lee L., Ye Z., Ngo Q.-M., et al. Human DNA methylomes at base resolution show widespread epigenomic differences. Nature. 2009;462:315–322. doi: 10.1038/nature08514. [DOI] [PMC free article] [PubMed] [Google Scholar]
- 48.Schultz M.D., Schmitz R.J., Ecker J.R. ‘Leveling’ the playing field for analyses of single-base resolution DNA methylomes. Trends Genet. 2012;28:583–585. doi: 10.1016/j.tig.2012.10.012. [DOI] [PMC free article] [PubMed] [Google Scholar]
- 49.Maumus F., Quesneville H. Ancestral repeats have shaped epigenome and genome composition for millions of years in Arabidopsis thaliana. Nat Commun. 2014;5:4104. doi: 10.1038/ncomms5104. [DOI] [PMC free article] [PubMed] [Google Scholar]
- 50.Schmitz R.J., Schultz M.D., Urich M., Nery J.R., Pelizzola M., Libiger O., Alix A., McCosh R.B., Chen H., Schork N.J., et al. Patterns of population epigenomic diversity. Nature. 2013;495:193–198. doi: 10.1038/nature11968. [DOI] [PMC free article] [PubMed] [Google Scholar]
- 51.Zhang X., Yazaki J., Sundaresan A., Cokus S., Chan S.W.L., Chen H., Henderson I.R., Shinn P., Pellegrini M., Jacobsen S.E., et al. Genome-wide high-resolution mapping and functional analysis of DNA methylation in arabidopsis. Cell. 2006;126:1189–1201. doi: 10.1016/j.cell.2006.08.003. [DOI] [PubMed] [Google Scholar]
- 52.Schmitz R.J., Schultz M.D., Urich M.A., Nery J.R., Pelizzola M., Libiger O., Alix A., McCosh R.B., Chen H., Schork N.J., et al. Patterns of population epigenomic diversity. Nature. 2013;495:193–198. doi: 10.1038/nature11968. [DOI] [PMC free article] [PubMed] [Google Scholar]
- 53.Morgante M., Brunner S., Pea G., Fengler K., Zuccolo A., Rafalski A. Gene duplication and exon shuffling by helitron-like transposons generate intraspecies diversity in maize. Nat. Genet. 2005;37:997–1002. doi: 10.1038/ng1615. [DOI] [PubMed] [Google Scholar]
- 54.Daron J., Glover N., Pingault L., Theil S., Jamilloux V., Paux E., Barbe V., Mangenot S., Alberti A., Wincker P., et al. Organization and evolution of transposable elements along the bread wheat chromosome 3B. Genome Biol. 2014;15:546. doi: 10.1186/s13059-014-0546-4. [DOI] [PMC free article] [PubMed] [Google Scholar]
- 55.Hollister J.D., Smith L.M., Guo Y.-L., Ott F., Weigel D., Gaut B.S. Transposable elements and small RNAs contribute to gene expression divergence between Arabidopsis thaliana and Arabidopsis lyrata. Proc. Natl. Acad. Sci. U. S. A. 2011;108:2322–2327. doi: 10.1073/pnas.1018222108. [DOI] [PMC free article] [PubMed] [Google Scholar]
- 56.Mosher R.A., Melnyk C.W., Kelly K.A., Dunn R.M., Studholme D.J., Baulcombe D.C. Uniparental expression of PolIV-dependent siRNAs in developing endosperm of Arabidopsis. Nature. 2009;460:283–286. doi: 10.1038/nature08084. [DOI] [PubMed] [Google Scholar]
- 57.Calarco J.P., Martienssen R.A. Genome reprogramming and small interfering RNA in the Arabidopsis germline. Curr. Opin. Genet. Dev. 2011;21:134–139. doi: 10.1016/j.gde.2011.01.014. [DOI] [PMC free article] [PubMed] [Google Scholar]
Associated Data
This section collects any data citations, data availability statements, or supplementary materials included in this article.