


Abstract
Heat stress is one of the best-studied cellular stress factors; however, little is known about its delayed effects. Here, we demonstrate that heat stress induces p21-dependent cellular senescence-like cell cycle arrest. Notably, only early S-phase cells undergo such an arrest in response to heat stress. The encounter of DNA replication forks with topoisomerase I-generated single-stranded DNA breaks resulted in the generation of persistent double-stranded DNA breaks was found to be a primary cause of heat stress-induced cellular senescence in these cells. This investigation of heat stress-induced cellular senescence elucidates the mechanisms underlying the exclusive sensitivity of early S-phase cells to ultra-low doses of agents that induce single-stranded DNA breaks.
INTRODUCTION
Heat stress (HS, heat shock, hyperthermia) is a well-studied exogenous form of cellular stress that affects virtually all cellular structures and many metabolic/signalling pathways (1,2). One of the interesting features of HS is its cell cycle phase specificity. We have shown recently that HS provokes different DNA damage responses (DDRs) in S-phase and non-S-phase (G1 and G2) cells. In non-S-phase cells, HS induces DNA double-stranded breaks (DSBs) marked by ATM-dependent H2AX phosphorylation, and in S-phase cells, HS inhibits DNA replication and leads to the subsequent formation of DNA-PK-dependent γH2AX foci (3). It has been established that severe HS may lead to cell death through apoptosis, necrosis or mitotic catastrophe (4). On the other hand, the delayed, cell fate decision-related effects of acute sublethal HS have been overlooked.
Cellular senescence, a form of cell cycle arrest, is one of the cellular responses to different types of exogenous and endogenous damage. This state is established and maintained through the activation of the cyclin-dependent kinase (CDK) inhibitors, p21CIP1 or p16INK4A (5). In addition to the permanent growth arrest, several features and molecular markers are used to identify senescent cells. The most ubiquitous characteristics of cellular senescence include cell and nucleus enlargement (6,7), the expression of CDK inhibitors (6,8) and increased β-galactosidase activity (9). Mechanisms of cellular senescence vary according to the initial stress stimulus (telomere shortening, oncogene activation, etc.). It is generally thought that the most upstream common trigger of the senescent state is the persistent DDR (5); however, the aetiology of the DDR can vary.
Here, we have demonstrated that HS can induce p21CIP1-dependent senescence-like cell cycle arrest. Intriguingly, only early S-phase cells undergo senescence in response to HS. The encounter of DNA replication forks with topoisomerase I (top1)-generated single-stranded DNA breaks (SSBs) was found to be a primary cause of HS-induced senescence-like growth arrest in these cells. Different SSB-inducing agents were found to induce similar changes (i.e. senescence-like phenotype) in early S-phase cells. This study highlights the complexity of the immediate effects of HS and their impact on delayed cell fate decisions.
MATERIALS AND METHODS
Antibodies
The primary antibodies used for immunofluorescence and/or western blot hybridisation were γH2AX (rabbit; Active Motif, #39117), γH2AX (rabbit; Abcam, #ab2893), γH2AX (mouse; clone JBW301; Upstate/Millipore, #05–636), BrdU (mouse; clone 131–14871; Chemicon/Millipore, #MAB4072), BrdU (rabbit; Rockland Immunochemicals, #600–401-C29), cyclin B1 (rabbit; Santa Cruz Biotechnology, #sc-752), 53BP1 (rabbit; Santa Cruz Biotechnology, #sc-22760), Rad51 (mouse; Abcam, #ab213), GM-130 (rabbit; Cell Signaling Technology, #12480P), DNA-topoisomerase 1 (rabbit; Abcam, #ab3825), p21 (rabbit; Cell Signaling Technology, #2947P) and histone H3 (rabbit; Abcam, #ab1791). The secondary antibodies conjugated to either Alexa Fluor 488 or Alexa Fluor 594 were purchased from Molecular Probes/Life Technologies; the horseradish peroxidase-conjugated anti-mouse and anti-rabbit IgG were purchased from Amersham/GE Healthcare.
Cell culture and synchronisation
Human HeLa cells were cultured in DMEM (PanEco) supplemented with 10% foetal bovine serum (FBS; HyClone/GE Healthcare). The cells were cultured at 37°C in a conventional humidified CO2 incubator. For synchronisation by double-thymidine block the cells were treated with 2 mM thymidine for 16 h, released for 9 h from the block and then treated with thymidine for an additional 16 h. To release the cells from double thymidine, they were washed twice with phosphate buffered saline (PBS) and replated in drug-free medium.
Human skin fibroblasts (female 46XX) were kindly provided by Dr M. Lagarkova (Vavilov Institute of General Genetics, Moscow, Russia). Fibroblasts were cultured in DMEM (PanEco) supplemented with 10% FBS (HyClone/GE Healthcare) and 0.04 mg/ml gentamycin. For synchronisation, 30%-confluent cell cultures were rinsed by PBS and incubated in a serum free medium (DMEM supplemented with 0.1% FBS) for 48 h. Then the medium was replaced by DMEM supplemented with 10% FBS and 2 mM thymidine for 24 h. To release the cells from thymidine block, they were washed twice with PBS and replaced in a drug-free medium supplemented with 10 ng/ml fibroblasts growth factor.
Drug treatment and HS
Cells were immersed in a precision-controlled water bath at 45.5°C (±0.05°C) for 30 min. For the recovery experiments, the HS-treated cells were incubated at 37°C. Under the experimental conditions used, no marked change in the pH was detected in the medium during the treatment. For the kinase inhibition experiments, HeLa cells were treated with 10 mM caffeine (Sigma-Aldrich) for 6 h, 1 μM Ku55933 (Tocris Bioscience) for 6 h or 50 μM NU7026 (Tocris Bioscience) for 6 h. For the replication inhibition experiments, the cells were treated with 10 μM aphidicolin (APH) (Sigma-Aldrich) for 1 h or 10 mM hydroxyurea (HU) (Sigma-Aldrich) for 1 h. For the top1 inhibition experiments, the cells were treated with 10 nM, 100 nM or 1 μM camptothecin (CPT) (Sigma-Aldrich) for 1 h. For the proteasome inhibition experiments, cells were treated with 10 μM MG132 (Sigma-Aldrich) for 3–6 h. For transcription inhibition experiments, cells were treated with 5 μg/ml α-amanitin (Sigma-Aldrich) for 6 h. For induction of SSBs, the cells were treated with 50 or 100 μM hydrogen peroxide for 1 h (Merck).
BrdU and EdU incorporation
Cells were incubated with 100 μM BrdU (Sigma-Aldrich) or 10 μM EdU (Life Technologies) for 30 min at 37°C. After this incubation, the cells were washed three times with PBS and fixed in either CSK buffer (10 mM PIPES, pH 7.0, 100 mM NaCl, 1.5 mM MgCl2, 300 mM sucrose) supplemented with 1% paraformaldehyde (PFA) and 2.5% Triton X-100 for 15 min at room temperature or 100% cold methanol (−20ºC) for 10 min before staining. The samples were then processed using a Click−iT EdU Imaging Kit (Life Technologies) according to the manufacturer's recommendations, or they were immunostained as described below.
5-FU incorporation
Cells were incubated with 5 mM 5-fluorouracil (5-FU, Sigma-Aldrich) for 3 h at 37°C. After this incubation, the cells were washed three times with PBS and fixed in 100% cold methanol (−20°C) for 10 min before staining. The cells were washed three times with PBS and incubated with rabbit polyclonal anti-BrdU antibodies (Rockland Immunochemicals, #600–401-C29) in PBS supplemented with 1% bovine serum albumin (BSA) for 1 h at room temperature. The primary antibody was revealed using Alexa Fluor 488-conjugated goat anti-rabbit antibody as described below.
Gene knockdown
RNA interference experiments were performed using Dharmafect siRNA transfection reagent (Thermo) following the manufacturer's instructions. HeLa cells were transfected with 100 nM ATM siRNA, 200 nM ATR siRNA, 80 nM PRKDC (catalytic subunit of DNA-PK), 60 nM topoisomerase 1 (TOP1) siRNA (Santa-Cruz Biotechnology). Forty-eight hours after transfection, the cells were harvested for further analysis.
Immunofluorescence microscopy
For immunostaining, cells were grown on microscope slides. All of the samples were fixed and permeabilised in either CSK buffer supplemented with 1% PFA and 2.5% Triton X-100 for 15 min at room temperature or 100% cold methanol (−20°C) for 10 min. The fixed cells were washed three times (5 min each) in PBS. For BrdU immunostaining, the DNA was denatured by 2 N HCl at room temperature for 30 min and then neutralised in 0.1 M borate buffer. After washing, the cells were preincubated with 1% BSA in PBS for 30 min and were then incubated with antibodies in PBS supplemented with 1% BSA for 1 h at room temperature. After incubation, the cells were washed three times (5 min each time) with PBS supplemented with 0.2% BSA and 0.05% Tween 20. The primary antibodies bound to antigens were visualised using Alexa Fluor 488- or Alexa Fluor 594-conjugated secondary antibodies. The DNA was counterstained with the fluorescent dye 4,6-diamino-2-phenylindole (DAPI) for 5 min at room temperature. The samples were mounted using Dako fluorescent mounting medium (Life Technologies). The immunostained samples were analysed using a Zeiss AxioScope A.1 fluorescence microscope (objectives: Zeiss N-Achroplan 40×/0.65 and EC Plan-Neofluar 100×/1.3 oil; camera: Zeiss AxioCam MRm; acquisition software: Zeiss AxioVision Rel. 4.8.2; Jena, Germany). The images were processed using ImageJ software (version 1.44) and Adobe Photoshop CS6.
Senescence-associated β-galactosidase assay
The cells were fixed in 2% formaldehyde, 0.2% glutaraldehyde containing PBS for 5 min at room temperature. Then, the cells were washed three times with PBS and incubated in X-gal solution (40 mM citric acid/sodium phosphate buffer pH 6.0; 150 mM NaCl, 2 mM MgCl2, 5 mM K3Fe(CN)6; 5 mM K4Fe(CN)6; 1 mg/ml X-gal (Sigma-Aldrich)) at 37°C overnight. After that, the cells were washed with PBS and fixed with methanol for 5 min. The samples were analysed using an Olympus BX50F4 microscope (objectives: Olympus UPlanFl 40×/0.75 and UPlanFl 20×/0.50).
Whole-cell extracts preparation and immunoblotting
HeLa cells were lysed by incubation in RIPA buffer (150 mM NaCl, 1% Triton X-100, 0.5% sodium deoxycholate, 0.1% SDS, 50 mM Tris-HCl (pH 8.0), 1 mM dithiothreitol and 1 mM PMSF) supplemented with Protease Inhibitor Cocktail (Sigma-Aldrich) and Phosphatase Inhibitor Cocktail 2 (Sigma-Aldrich) for 30 min on ice. Next, the cell extracts were sonicated with a VirSonic 100 ultrasonic cell disrupter and stored at −70°C. The protein concentration was measured by the Bradford assay. Aliquots of each sample were separated by sodium dodecyl sulphate-polyacrylamide gel electrophoresis (SDS-PAGE) and blotted onto polyvinylidene difluoride (PVDF) membranes (Amersham/GE Healthcare). The membranes were blocked for 1 h in 2% ECL Advance blocking reagent (GE Healthcare) in PBS containing 0.1% Tween 20 (PBS-T) followed by incubation overnight with a primary antibody diluted in PBS-T containing 2% blocking reagent or 1% BSA. After three washes with PBS-T, the membranes were incubated for 1 h with the secondary antibodies (horseradish peroxidase-conjugated anti-rabbit or anti-mouse IgG) in PBS-T containing 2% blocking agent or 1% BSA. The immunoblots were visualised using a Pierce ECL plus western blotting substrate. The films were scanned and processed with Adobe Photoshop CS6 software.
Gene expression analysis
RNA was extracted from cells using TRIzol reagent (Life Technologies). All of the RNA samples were further treated with DNase I (Fermentas) to remove the residual DNA. RNA (1 μg) was reverse transcribed in a total volume of 20 μl for 1 h at 42°C using 0.4 μg of random hexamer primers and 200 U of reverse transcriptase (Fermentas) in the presence of 20 U of ribonuclease inhibitor (Fermentas). The cDNA obtained was analysed by quantitative polymerase chain reaction (PCR) using the CFX96 real-time PCR detection system (Bio-Rad Laboratories). The PCRs were performed in 20 μl reaction volumes that included 50 mM Tris-HCl (pH 8.6), 50 mM KCl, 1.5 mM MgCl2, 0.1% Tween-20, 0.5 μM of each primer, 0.2 mM of each dNTP, 0.6 μM EvaGreen (Biotium), 0.75 U of Hot Start Taq Polymerase (Sibenzyme) and 50 ng of cDNA. The PCR reactions were performed as follows: initial denaturation for 5 min at 94°C; 50 cycles of 15 s at 94°C, 30 s at 65°C and 15 s at 72°C. The plate was then read. Each PCR was performed in quadruplicate, and the corresponding results were averaged. The primers used for qPCR analysis were as follows: GAPDH–aaactgtggcgtgatggc and cagtggggacacggaagg; p16–acaactgcccccgccacaac and acagtgaaaaggcagaagcggtg; p21–aaggcagggggaaggtgggg and gggggagggacagcagcaga.
Flow cytometry
For the flow cytometry analysis, HeLa cells were trypsinised with 0.25% trypsin for several minutes at 37ºC. The trypsin was inactivated with a 4-fold volume of DMEM. Next the cells were washed in Versen solution and fixed with 70% ice-cold ethanol for 20 min. After fixation, the cells were washed three times with PBS and then incubated for 30 min in staining buffer (0.1% sodium citrate, 0.3% NP-40, 50 μg/ml propidium iodide, 50 μg/ml RNase A). After being washed, the samples were analysed using a MACSQuant flow cytometer.
Neutral SCGE (comet assay)
After treatment, cells were trypsinised with 0.25% trypsin for several minutes at 37ºC. The trypsin was inactivated with a 4-fold volume of DMEM. The cells were resuspended immediately in Versen solution at a concentration of 105 cells/ml. A 50-μl aliquot of this suspension was mixed with 50 μl of prewarmed 2% low-melting point agarose type VII (Sigma-Aldrich), and 90 μl was pipetted immediately onto a 3-mm-thick 2% normal melting point agarose base layer. The slide was kept at 4°C for 10 min. The slide was then immersed in lysis solution (30 mM EDTA, 0.5% SDS, pH 8.0, supplemented with 100 μg/ml proteinase K) at 50°C overnight. After washing with PBS, the slide was subjected to electrophoresis for 30 min at 1.5 V/cm. After electrophoresis, the slide was washed with 96% ethanol, air-dried and stained with a 1:10 000 dilution of SYBR Green. The comets were visualised under a Zeiss AxioScope A.1 fluorescence microscope. The images of the comets were analysed with the CometScore software. For each sample, 100 randomly chosen cells were scored for the tail moment.
Top1 activity assay (plasmid relaxation assay)
Plasmid relaxation assay was performed essentially as described previously (10). Samples containing 107 cells were heat or CPT treated and trypsinised with 0.25% trypsin for several minutes at 37°C. The trypsin was inactivated with a 4-fold volume of DMEM. The cells were resuspended immediately in 180 μl ice-cold low salt buffer (20 mM Tris-HCl pH 7.5, 5 mM KCl, 1 mM MgCl2, 10% glycerol) supplemented with Protease Inhibitor Cocktail, 1 mM DTT and 1 mM PMSF. Then, the nuclei were released from the cells by 15 gentle strokes of a tight fitting pestle in a Dounce homogeniser on ice and centrifuged at 15 000 g for 3 min. The nuclei were resuspended in 180 μl ice-cold high salt buffer (20 mM Tris-HCl pH 7.5, 350 mM KCl, 1 mM MgCl2, 10% glycerol) supplemented with Protease Inhibitor Cocktail, 1 mM DTT, and 1 mM PMSF and incubated on ice for 30 min with gentle mixing. Then, the nuclei were centrifuged at 15 000 g for 10 min, and the supernatant was used for the estimation of enzyme activity. The relaxation activity of top1 was assayed in a volume of 20 μl with 50 mM Tris-HCl, pH 7.5, 100 mM KCl, 1 mM DTT, 10 mM EDTA, 5 μg/ml acetylated BSA and 1 μg of supercoiled pEGFP-N1 plasmid DNA (purified by QIAGEN Plasmid Midi Kit). Relaxation of the supercoiled plasmid was carried out using 0.5 or 1.0 μg nuclear extract. After incubation at 37°C for 10 or 30 min, the reactions were stopped by adding 5 μl of 50 mM EDTA, 50% glycerol and 0.5% bromophenol blue. The DNA was electrophoresed in a 0.8% agarose gel with TAE buffer (50 mM Tris–HCl, pH 8.0 and 2 mM EDTA). The gel was stained with ethidium bromide.
DNA–protein covalent complex isolation and immunodetection (RADAR)
DNA–protein covalent complex (DPCC) isolation and immunodetection were performed as previously described (11) with minor modifications. Samples containing 107 cells were heat or CPT treated and then trypsinised with 0.25% trypsin for several minutes at 37ºC. The trypsin was inactivated with a 4-fold volume of DMEM. The cells were resuspended immediately in 180 μl of ice-cold low salt buffer (20 mM Tris-HCl pH 7.5, 5 mM KCl, 1 mM MgCl2, 10% glycerol) supplemented with Protease Inhibitor Cocktail, 1 mM DTT and 1 mM PMSF. Then, the nuclei were released from the cells by 15 gentle strokes of a tight fitting pestle in a Dounce homogeniser on ice and centrifuged at 15 000 g for 3 min. Next, the nuclei were resuspended in 180 μl of ice-cold high salt buffer (20 mM Tris-HCl pH 7.5, 350 mM KCl, 1 mM MgCl2, 10% glycerol) supplemented with Protease Inhibitor Cocktail, 1 mM DTT, and 1 mM PMSF and incubated on ice for 30 min with gentle mixing. The nuclei were centrifuged at 15 000 g for 10 min, lysed in 1 ml of DNAzol (Invitrogen/Life Technologies) supplemented with 1% N-lauroyl-sarkosyl on ice for 30 min and sonicated using a VirSonic 100 ultrasonic cell disrupter. DPCCs were precipitated by the addition of a  volume of 96% ethanol followed by centrifugation. The precipitate was washed in 75% ethanol and immediately resuspended in 8 mM NaOH. The samples were applied to a PVDF (GE Healthcare) membrane using a vacuum dot-blot device (Bio-Rad). The membrane was blocked for 1 h in 2% ECL Advance blocking reagent (GE Healthcare) in PBS-T and then incubated overnight with the rabbit polyclonal human anti-top1 antibody at a 1:2000 dilution in PBS-T containing 2% blocking reagent. After three washes with PBS-T, the membranes were incubated for 1 h with secondary antibody (horseradish peroxidase-conjugated anti-rabbit IgG) in PBS-T containing 2% blocking agent. The immunoblots were visualised using a Pierce ECL plus western blotting substrate. All procedures were performed using low-binding tubes. Immunoblots were scanned and analysed using ImageJ software (version 1.44).
SDS-K+ precipitation
The precipitation of DPCCs was performed by modified SDS-K+ precipitation protocol (12). The cells were labelled for 24 h with BrdU with a final concentration of 100 μM. Prior to treatment (HS or CPT), the cells were washed with culture medium. Then the cells were trypsinised and resuspended in PBS to a final concentration of 105 cells/ml. The cells were lysed by the addition of 1 ml prewarmed (65°C) lysis solution (1.25% SDS, 5 mM EDTA pH 8.0, 0.4 mg/ml salmon sperm DNA), incubated for 10 min at 65°C and sonicated. Then, 250 μl of KCl (325 mM) was added, and the suspension was vigorously vortexed. One millilitre of the lysate was transferred to a 1.5-ml Eppendorf tube, cooled on ice for 10 min and centrifuged at 4°C for 15 min at 15 000 g. The pellet was resuspended in 1 ml of wash solution (10 mM Tris-HCl pH 8.0, 100 mM KCl, 1 mM EDTA, 0.1 mg/ml salmon sperm DNA) by heating at 65°C for 10 min with mixing. The tubes were then placed on ice for 10 min and centrifuged. The pellet was resuspended in digestion buffer (0.5% SDS, 10 mM Tris-HCl pH 8.0, 50 mM EDTA) supplemented with 10 μg/ml proteinase K at 60°C overnight. Next, the DNA was purified by extraction with phenol/chloroform, precipitated with ethanol and dissolved in 0.4 M NaOH. The DNA samples were denatured in a boiling water bath for 10 min and applied to Hybond-N membrane (GE Healthcare) using a vacuum dot-blot device (Bio-Rad). The membrane was blocked for 1 h in 2% ECL Advance blocking reagent (GE Healthcare) in PBS-T and incubated overnight with a mouse anti-BrdU antibody at a 1:5000 dilution in PBS-T containing 2% blocking reagent. After three washes with PBS-T, the membranes were incubated for 1 h with secondary antibody (horseradish peroxidase-conjugated anti-mouse IgG) in PBS-T containing 2% blocking agent. The immunoblots were visualised using the Pierce ECL plus western blotting substrate. All procedures were performed using low-binding tubes. The immunoblots were scanned and analysed using ImageJ software (version 1.44).
Proteasome activity assay
Proteasome activity was measured using Proteasome-Glo Chymotrypsin-Like and Trypsin-Like Cell-Based Assay (Promega). Briefly, 2×10⁵ cells were plated in 24-well plates in triplicate and heat stressed. Then 104 cells were taken at the indicated times, were resuspended in 100 μl PBS and mixed with an equal volume of assay kit reagent. The plates were then incubated at room temperature for 10 min before being read using a Synergy H4 Hybrid Multi-Mode Microplate Reader.
RESULTS
HS induces senescence-like cell cycle arrest
To investigate the delayed effects of acute HS, we followed heat-stressed (45.5°C, 30 min) HeLa cells for an extended period (up to 96 h). Beginning at 36–48 h after exposure to HS, the cell population became heterogeneous and contained a number of flattened cells with enlarged nuclei in addition to a majority of morphologically normal cells (Figure 1A). The same observations were evident in breast cancer MCF7 cells subjected to acute HS (data not shown). To define whether these enlarged cells were proliferation competent we assessed DNA synthesis at different time points after HS using an EdU incorporation assay. We found that all of the enlarged cells were EdU negative, indicating that HS may inhibit the proliferation of certain cells for a long period (Figure 1A). Taking into consideration the proliferation arrest and the morphological changes, we hypothesised that the cells that acquired these features in response to HS may be senescent. To investigate this hypothesis, we assayed heat-treated (45.5°C, 30 min) and recovered (37°C, 48–72 h) HeLa cells for senescence-associated β-galactosidase (SA-β-gal) activity, which is the most ubiquitous cellular senescence marker (9,13). The enlarged cells exhibited increased SA-β-gal activity (Figure 1B), indicating that HS can induce senescence-like phenotype in cultured human cells. To determine if the phenomenon was restricted to cancer cells, we checked whether HS could induce senescence phenotype in human primary cells. For this purpose, we assayed HS-treated (45.5°C, 30 min) and recovered for 72 h human normal skin fibroblasts for SA-β-gal activity (Supplementary Figure S1A). Evidently, a number of primary fibroblasts acquired senescence-like phenotype in response to HS, as concluded from the increase of SA-β-gal activity and cell morphology changes (enlargement and flattening) arisen (Supplementary Figure S1A).
Figure 1.
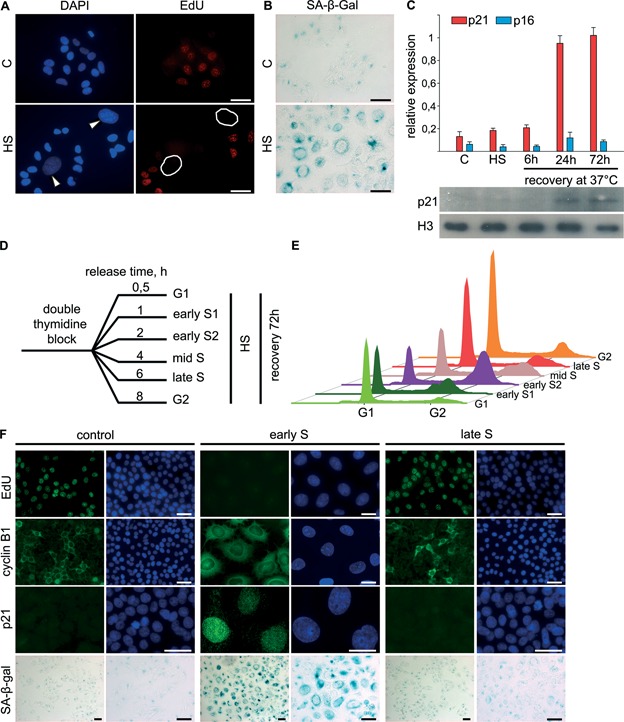
Early S-phase cells undergo senescence-like proliferation arrest in response to HS. (A and B) Human HeLa cells that were untreated or treated with HS (45.5°C, 30 min) were allowed to recover for 72 h and then either pulse-labelled with EdU (A; 10 μM, 30 min) or stained for SA-β-gal activity (B). EdU was revealed by Click Chemistry (red). The DNA was stained with DAPI (blue). Cells with enlarged nuclei are indicated by white arrows or circles. Scale bar: 25 μm. (C) Human HeLa cells that were either untreated, treated with HS (45.5°C, 30 min), or treated with HS and allowed to recover for the indicated time intervals (6, 24 and 72 h) were subjected to gene expression analysis using qRT-PCR and WB. The expression of p21CIP1 and p16INK4a was analysed using EvaGreen-based qRT-PCR. The amplification levels of the cDNA were normalised to the level of GAPDH cDNA. The data are represented as the mean ± SEM. WB was carried out with an antibody against p21; histone H3 was used as the loading control. (D) Experimental design for comparison of the effects HS on HeLa cells at different cell cycle phases. (E) Cell cycle profiles of the cells treated and allowed to recover as in (D). (F) Early and late S-phase HeLa cells obtained using a double-thymidine block were heat treated (45.5°C, 30 min), allowed to recover for 72 h and either pulse-labelled with EdU (10 μM, 30 min) or stained for cyclin B1, p21 or SA-β-gal activity. EdU was revealed by Click Chemistry (red). The DNA was stained with DAPI (blue). The control represents HeLa cells synchronised by a double-thymidine block and released for 72 h. Scale bar: 25 μm.
It is well established that the senescence state is maintained by either the p16INK4A- or the p21CIP1-dependent signalling pathway (5). Using quantitative reverse transcription-PCR (qRT-PCR) and western blotting (WB), we found that only p21CIP1 is upregulated in response to HS (Figure 1C). Interestingly, p21CIP1 expression was upregulated only after a protracted recovery period (24 h) and not immediately after HS (Figure 1C). Collectively, these results demonstrate that HS can induce p21CIP1-dependent senescence-like proliferation arrest.
Only early S-phase cells undergo senescence-like growth arrest in response to HS
Previously, we reported that the immediate effects of HS dramatically differ depending on the cell cycle phase (3). The fact that only a portion of heat-treated cells undergo senescence might also represent the cell cycle phase-dependent multiplicity of delayed HS responses. To investigate this possibility, we synchronised HeLa cells by double-thymidine block, fractionated the cells into G1, G2 and several sub-S populations, subjected them to HS (45.5°C, 30 min) and allowed them to recover (37°C, 72 h) (Figure 1D and Supplementary Figure S2A). We found that only cells that were in the first stage of S phase (1–3 h after release from the double-thymidine block) at the time of HS underwent senescence in response to HS, based on the dramatic increase in the nuclear size of the majority of cells (Supplementary Figure S2B). To elucidate the mechanism of HS-induced senescence-associated proliferation arrest, we analysed the cell cycle profile of fractionated, heat-treated and recovered HeLa cells by flow cytometry. The heat-treated early S-phase cells accumulated in G2 phase (Figure 1E). When HS was applied to cells at the other stages of the cycle, the distribution closely matched this in non-treated cells. To confirm this precise cell cycle phase specificity, we evaluated cells that were heat treated in early and late S-phase and allowed to recover for growth arrest and senescence markers. Only the cells that were heat treated in early S-phase and allowed to recover were proliferation incompetent (EdU-negative), contained elevated amounts of nuclei-localised CDK inhibitor p21CIP1 and exhibited pronounced SA-β-gal activity (Figure 1F). Most of the early S-phase cells exposed to HS and recovered for 72 h were also positive for cyclin B1, indicating that this state did represent senescence-related G2 arrest (Figure 1F). Altogether, these results indicate that only early S-phase cells are hypersensitive to HS in terms of delayed effects and undergo senescence-like G2 arrest in response to HS. This observation is true for primary cells as well. We synchronized human skin fibroblasts to obtain early S-phase population (Supplementary Figure S1B), subjected them to HS (45.5°C, 30 min) and allowed them to recover (37°C, 48 h). We found that only fibroblasts that were in early S phase at the time of HS acquired senescence-like phenotype, based on the increase in the nuclear size and the existence of persistent DDR foci (Supplementary Figure S1D). Furthermore, we demonstrated that the observed in primary cells HS-induced senescence-like state represented G2 arrest using flow cytometry and anti-cyclin B1 immunostaining (Supplementary Figure S1C).
Although acute HS at 45.5°C was used as a model system in numerous studies of heat-induced DNA damage and signalling (14,15), we decided to test mild HS as well. We checked whether lower temperatures or treatment times could trigger development of senescence-like phenotype. Evidently, temperature drop (from 45 to 41 or 43°C) as well as the reducing of heat treatment time (45.5°C for 5 or 15 min) led to dramatic decrease in the number of HeLa cells acquiring senescence-like phenotype in response to HS (Supplementary Figure S3). Nevertheless, even at lower treatment temperature/time early S cells remained more sensitive to HS than late S cells (Supplementary Figure S3).
Top1 is a target of HS
More than 50% of replication origins fire during the first third of S phase in HeLa cells (16). Therefore, the exclusive vulnerability of early S-phase cells to HS suggests that perturbation of DNA replication might trigger senescence-like growth arrest. The fact that acute HS did affect DNA replication process—particularly, inducing a short-term replication arrest ((3,17); for HeLa see Supplementary Figure S4A and B)—supports this possibility. Thus, to further elucidate the mechanisms underlying the hypersensitivity to stress during early S phase, we screened a panel of chemicals known to have direct or indirect effects on DNA replication for their ability to induce senescence. We used the DNA polymerase inhibitor APH (10 μM, 60 min), the ribonucleotide reductase inhibitor HU (10 mM, 60 min) and the top1 inhibitor CPT (0.1 μM, 60 min). The early S-phase HeLa cells were treated with one of the abovementioned drugs and incubated in drug-free media for 48 h followed by evaluation for nuclear enlargement. Surprisingly, only CPT induced development of a senescence-like phenotype (Figure 2A). To check whether the effect of CPT was cell cycle phase specific, we compared HeLa cells that were treated with CPT in early and late S phase and allowed to recover (Figure 2B and C). We found that only early S cells underwent senescence-like cell cycle arrest in response to CPT treatment (Figure 2B and C). Based on the similarity of the effects of HS and CPT treatment, we hypothesized that top1 may be an S-phase-specific target of HS. Indeed, using plasmid relaxation assay, we found that the activity of top1 was suppressed in extracts of HeLa cells subjected to HS (Figure 2D). To make sure that this effect was not related to HS-dependent down-regulation of top1 expression, we performed a western blot analysis to determine the levels of top1 in extracts of control and HS-treated HeLa cells and found them to be essentially the same (Figure 2E). To investigate whether HS induced the formation of stalled DNA–top1 covalent complexes (DPCC), we used two different techniques: a modified SDS-K+ precipitation method ((12) and scheme in Figure 2F) and ethanol precipitation of DPCCs ((11,18) and scheme in Figure 2G). Using both approaches, we demonstrated that HS effectively induced the formation of DPCCs (Figure 2F and G). In contrast to CPT-induced ones, DPCCs that formed in response to HS remained stable (i.e. covalently bound to DNA) even 3 h after the treatment (Figure 2H). This may suggest that HS somehow postpones the removal of DPCCs for several hours (see next Results' sections for further details). To finally ascertain the role of top1 in HS- and CPT-induced senescence-like growth arrest, the top1 was knocked down using small interfering RNA (siRNA) technology. Expectedly, down-regulation of top1 led to a dramatic decrease in the number of HeLa cells acquiring senescence-like phenotype in response both to HS and to CPT (Figure 2I). Collectively, these data suggest that HS inhibits top1 in vivo and induces the formation of stalled top1–DNA complexes which somehow trigger development of senescence-like growth arrest when occur in early S-phase cells.
Figure 2.

Top1 is a target of HS. (A) Early S-phase HeLa cells that were mock-treated and treated with APH (10 μM, 60 min), HU (10 mM, 60 min) or CPT (0.1 μM, 60 min) were allowed to recover for 48 h and stained for γH2AX (green). The DNA was stained with DAPI (blue). Scale bar: 25 μm. (B and C) Early and late S-phase HeLa cells were treated with CPT (0.1 μM, 60 min), allowed to recover for 48 h and stained for γH2AX (B; green) or SA-β-gal activity (C). Scale bar: 25 μm. (D) Plasmid relaxation activity of whole-cell extracts derived from untreated or heat-treated (45.5°C, 30 min) early S-phase HeLa cells. The reaction products were resolved in an agarose gel and visualised with ethidium bromide. NC, nicked circular plasmid DNA; SC, supercoiled plasmid DNA. Results of one representative experiment are shown. (E) WB analysis of top1 in control (untreated, C) and heat-stressed (45.5°C, 30 min; HS) early and late S-phase HeLa cells. (F) Outline of the SDS-K+ precipitation procedure (left). Early S-phase HeLa cells were untreated or treated with HS (45.5°C, 30 min) or CPT (1 μM, 60 min) and then subjected to SDS-K+ precipitation. The resulting dot-blots and their quantitative densitometric analysis are shown (right). Results of one representative experiment are shown. (G) Outline of the procedure for ethanol precipitation of DPCCs (left). Cells treated as in (F) were subjected to the procedure. The resulting dot-blots and their quantitative densitometric analysis are shown (right). Results of one representative experiment are shown. (H) Early S-phase HeLa cells were untreated and treated with HS (45.5°C, 30 min) or CPT (1 μM, 60 min), allowed to recover in fresh medium at 37°C for the indicated time periods (0, 3 and 6 h) and subjected to ethanol precipitation of the DPCCs. The results of quantitative densitometric analysis of the obtained dot-blots are shown. (I) Early S-phase HeLa cells were transfected with siRNA set to knock down top1, HS- (45.5°C, 30 min) or CPT-treated (500 nM, 30 min) and incubated in a fresh medium for 48 h. Senescence-like phenotype was analysed by nuclei enlargement and γH2AX staining. The percentage of senescent cells is shown. The data are represented as the mean ± SEM.
DNA replication is required for the induction of HS- and CPT-stimulated senescence-like cell cycle arrest
Taking into account that HS suppresses DNA replication ((3) and Supplementary Figure S4A and B) and inhibits the activity of top1 (Figure 2), it is possible that DNA replication is affected indirectly through top1 inhibition. Alternatively, the suppression of DNA replication and the inhibition of top1 may occur independently. To characterise the contribution of both processes to the stress-induced cellular senescence, we analysed the ability of HS to induce senescence in early S-phase cells at the moment when DNA replication was chemically inhibited by APH or HU. We found that extension of HS-induced replication arrest by APH or HU prevented the development of the senescence-like phenotype (Supplementary Figure S4C). Similar experiments demonstrated that CPT-induced senescence-like state was abolished when DNA replication was suppressed by the time of CPT treatment (Supplementary Figure S4D). Collectively, these results suggest that HS affects the DNA replication machinery and top1 independently. Taking into account the fact that the inhibition of replication at the time of exposure to HS or CPT prevents the subsequent development of the senescence phenotype, it is possible that the collision of replication forks with top1 DPCCs or top1-generated SSBs is a primary trigger of cellular senescence.
HS and CPT induce persistent DDR in early S-phase cells
DDR activation is essential for the establishment of certain cellular senescence states, particularly the oncogene-induced senescence (19). To elucidate the possible role of DDR in triggering HS-induced senescence-like growth arrest, we assessed the presence of γH2AX foci in early and late S-phase HeLa cells that were heat treated and allowed to recover for 72 h. Only the cells that were in early S phase at the moment of HS possessed significant amount of γH2AX foci during the prolonged recovery period (Figure 3A and B). Precise analysis of the characteristics of the γH2AX foci (foci number and size) suggests the existence of two waves of HS-induced H2AX phosphorylation (Supplementary Figure S5A and B): one associated with HS-induced DNA replication arrest (small numerous foci described in (3)) and another represented by the presence of large irradiation-induced foci-like foci (Supplementary Figure S5A and B). To find out if ‘second wave’ of γH2AX foci represent a DDR, we checked whether well-known repair factors were attracted to these foci. In contrast to the initial HS-induced γH2AX foci, the persistent γH2AX foci, which were formed 3–6 h post-HS, co-localised with the well-known DDR mediator 53BP1 (Figure 3C and Supplementary Figure S5B) and the homologous recombination protein Rad51 (Supplementary Figure S5A).
Figure 3.
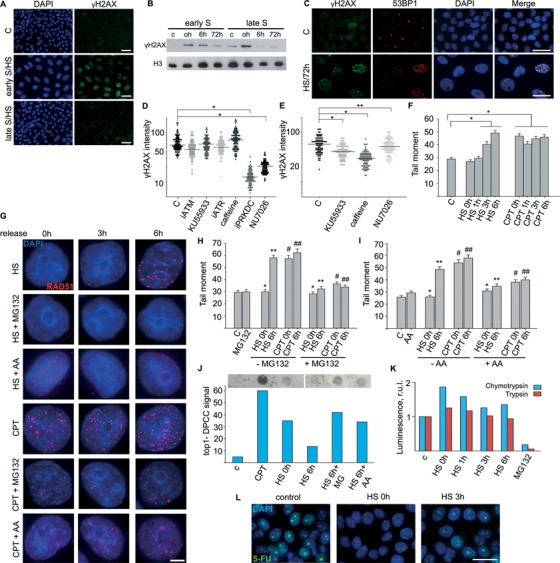
Analysis of DDR activated by HS and CPT. (A) Early and late S-phase HeLa cells were heat treated (45.5°C, 30 min), allowed to recover for 72 h and stained for γH2AX (green). The DNA was stained with DAPI (blue). The control represents HeLa cells synchronised by double-thymidine block and released for 72 h. Scale bar: 25 μm. (B) Early and late S-phase HeLa cells were heat treated (45.5°C, 30 min) and allowed to recover at 37°C for the indicated time periods (0, 6 and 72 h). WB was performed with an anti-γH2AX antibody; histone H3 was the loading control. Control (C) represents untreated early or late S-phase HeLa cells. (C) Early S-phase HeLa cells were treated and allowed to recover as in (A) and stained for γH2AX (green) and 53BP1 (red). Control as in (A). Scale bar: 25 μm. (D and E) Quantification of γH2AX in early S-phase HeLa cells pretreated with siRNAs or chemical compounds to suppress the activity of either ATM (iATM and KU55933), ATR (iATR and caffeine) or DNA-PK (iPRKDC and NU7026), treated with HS (D) and allowed to recover at 37°C for 6 h (E). Dot plots show the γH2AX intensities. Horizontal lines represent the median. *P < 0.0001, **not significant (unpaired t-test, n > 90). (F) Early S-phase HeLa cells were either HS (45.5°C, 30 min) or CPT treated and allowed to recover at 37°C for the indicated time periods (0, 1, 3 and 6 h). Control represents untreated early S-phase HeLa cells. The neutral comet assay was carried out; the tail moment is shown. The data are represented as the mean ± SEM. *P < 0.0001 (unpaired t-test, n > 80). (G) Analysis of Rad51 (red) foci formation in HeLa cells treated with HS (45.5°C, 30 min) and CPT (1 μM, 60 min) in early S-phase, exposed to either the proteasome inhibitor MG132 or RNA polymerase II/III inhibitor α-amanitin (AA), and allowed to recover for 3 or 6 h. The DNA was stained with DAPI (blue). Representative image are shown. Scale bar: 3 μm. (H and I) Early S-phase HeLa cells were either HS (45.5°C, 30 min) or CPT treated (1 μM, 60 min), exposed or not to MG132 (H) or AA (I), and allowed to recover at 37°C for the indicated time periods (0 and 6 h). Control represents untreated early S-phase HeLa cells. The neutral comet assay was carried out; the tail moment is shown. The data are represented as the mean ± SEM. *not significant, **, #, ##P < 0.001 (unpaired t-test, n > 80). (J) Early S-phase HeLa cells were either CPT treated (1 μM, 60 min) or HS treated (45.5°C, 30 min) or HS treated and allowed to recover for 6 h at 37°C in a medium containing or not either MG132 or AA. Then the cells were subjected to ethanol precipitation of the DPCCs. The resulting dot-blots and their quantitative densitometric analysis are shown (right). Results of one representative experiment are shown. (K) Early S-phase HeLa cells were HS treated (45.5°C, 30 min) and allowed to recover for the indicated time periods (0, 1, 3 and 6 h). Proteasome chymotrypsin- and trypsin-like activities were analysed using Proteasome-Glo Cell-Based Assays (Promega). HeLa cells treated with MG132 were used as a negative control. (L) Early S-phase HeLa cells, untreated or HS treated (45.5°C, 30 min) and allowed to recover for 0 or 3 h, were then pulsed with 5-fluorouracil (5-FU; 5 mM) for 3 h. 5-FU was revealed by immunocytochemistry (green). The DNA was stained with DAPI (blue). Scale bar: 25 μm.
It is well established that H2AX may be phosphorylated by three PIKK kinases—ATM, ATR and DNA-PK, which are activated and function in different situations (20). To elucidate the role of different kinases in H2AX phosphorylation during different time intervals after cell exposure to HS, we quantified the γH2AX fluorescence intensity in cells with suppressed PIKK kinase activity. Early S-phase HeLa cells knocked down for ATM, ATR or the catalytic subunit of DNA-PK (PRKDC) were heat treated (45.5°C, 30 min) and immunostained for γH2AX. The γH2AX fluorescence analysis confirmed the primary role of DNA-PK in HS-induced replication arrest-associated phosphorylation of H2AX (Figure 3D). The same results were obtained using cells pretreated with specific kinase inhibitors KU55933 (ATM (21)), caffeine (ATR/ATM (22)) or NU7026 (DNA-PK (23)) (Figure 3D). To identify the kinase involved in the formation of persistent γH2AX foci, we pretreated early S-phase HeLa cells with a specific kinase inhibitor, heat stressed (45.5°C, 30 min), allowed to recover (37°C, 6 h) and immunostained them for γH2AX. Quantification of the γH2AX fluorescence intensity revealed that DNA-PK is the only kinase that does not participate in the persistent γH2AX foci formation (Figure 3E). Collectively, these results clearly demonstrate that HS induces two waves of H2AX phosphorylation in early S-phase cells. The first phosphorylation wave does not depend on DSBs formation and is performed by DNA-PK, whereas the second wave is ATM/ATR-dependent and marks the appearance of DSBs. Thus, the delayed wave represents persistent DDR activation that may trigger senescence-like cell cycle arrest.
The encounter of replication forks with top1-generated SSBs is a source of persistent DDR and subsequent senescence-like cell cycle arrest
We investigated whether HS-induced persistent DDR foci, which are formed 3–6 h after the exposure of the cells to HS, represent sites of DNA damage. The neutral comet assay clearly showed the lack of DSBs immediately after HS and their accumulation 3–6 h post-HS (Figure 3F). It should be mentioned that these DSBs could not be properly repaired even during several days after the treatment (γH2AX/53BP1 immunofluorescence analysis on Supplementary Figure S5A–B and neutral comet assay on Supplementary Figure S6). It is noteworthy that the CPT-treated cells exhibited all of the features of DDR as the heat-treated cells (DSBs, 53BP1, Rad51, γH2AX foci; Figure 3F and Supplementary Figure S5C and D) with the exception that CPT-dependent DDR was induced immediately after the treatment. It kindled our interest that in early S-phase cells time of DSBs (and corresponding DDR foci) formation seems similar to the time of top1–DNA covalent complexes removal (Figure 2H). Together with the results demonstrating the necessity of ongoing replication for the development of senescence phenotype in HS-treated cells, these data suggest that the encounter of replication forks with top1-generated SSBs is a source of DSBs.
It is generally thought that top1–DNA adducts should be first processed to ‘true’ SSBs, and then, when replication forks reach these SSBs, they are converted into DSBs (24). Removal of top1 DPCCs and subsequent generation of SSBs thought to be a transcription- and proteasome-dependent process (25,26). To test whether this is the case for heat-stressed cells, we pre-treated early S-phase HeLa cells with either proteasome inhibitor MG132 or RNA polymerase II/III inhibitor α-amanitin (AA), subjected to either HS (45.5°C, 30 min) or CPT treatment (1 μM, 60 min) and evaluated the appearance of Rad51 foci (Figure 3G). CPT- and HS-induced Rad51 foci formation was attenuated or strongly suppressed by co-treatment with any of these two inhibitors (Figure 3G). Furthermore, pre-treatment of the cells with either MG132 or AA effectively abrogated the formation of HS- and CPT-induced DSBs (Figure 3H and I) as well as extended the life-time of HS-induced top1–DNA covalent complexes (Figure 3J). Thus, it is likely that in both cases (CPT or HS treatment), the encounter of replication forks with top1-generated SSBs, exposed after removal of top1 from DNA, results in DSB formation, persistent DDR and subsequent senescence-like cell cycle arrest. Postponed formation of DSBs in heat-stressed (Figure 3F and H) cells suggests that HS somehow affects the process of top1 DPCCs removal. This HS effect may be explained by a supposition that HS suppress the activity of ubiquitin-proteasome system or transcription machinery which is likely to be a sensor of top1 stalled complexes (25). Here we showed that neither trypsin-like nor chymotrypsin-like activity of proteasome was affected by HS (Figure 3K). The suppression of transcription by HS is well known. We have demonstrated that in our cellular model and under conditions of HS-treatment used in our study the transcription is indeed strongly inhibited by HS (Figure 3L).
SSB-inducing genotoxic stresses stimulate cellular senescence in early S-phase cells
The proposed mechanism of the HS- and CPT-induced cellular senescence suggests that SSB generation is sufficient to induce senescence in cultured S-phase cells (Figure 4A). To confirm this possibility, we treated cells with a well-known SSB inducing agent, hydrogen peroxide (H2O2). As expected, brief treatment of the cells with H2O2 effectively induced senescence-like phenotype (Figure 4B). Interestingly, the senescence-inducing activity of H2O2 was restricted to early S-phase cells (Figure 4B). Finally, we analysed whether the inhibition of DNA replication could abrogate H2O2-induced senescence and found that the effects of H2O2 were suppressed by APH (Figure 4C). Collectively, these results strongly confirm the presented model (Figure 4A) and demonstrate its generality.
Figure 4.
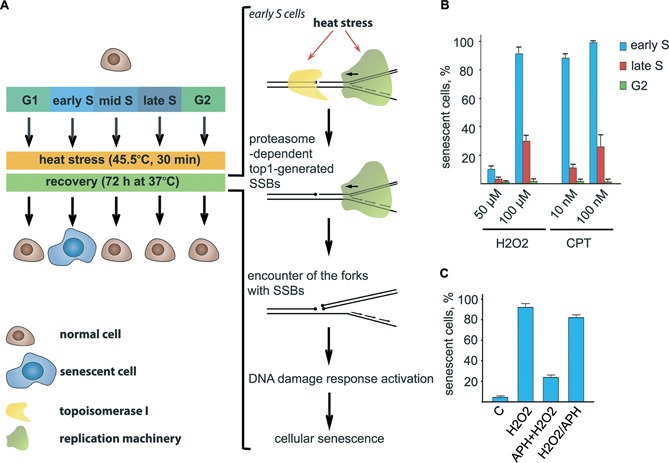
SSB-inducing genotoxic stresses stimulate cellular senescence of early S-phase cells. (A) Model illustrating how HS induces senescence-like cell cycle arrest. (B) G2-, early and late S-phase HeLa cells were treated with either H2O2 (50 and 100 μM) or CPT (10 and 100 nM) for 1 h and then incubated in a fresh medium for 48 h. Senescence-like phenotype was analysed by nuclei enlargement. The percentage of senescent cells is shown. The data are represented as the mean ± SEM. (C) Early S-phase HeLa cells were either treated with H2O2 (100 μM; 1 h), co-treated with H2O2 (100 μM; 1 h) and APH (10 μM; 1 h) or sequentially treated with H2O2 (100 μM; 1 h) and APH (10 μM; 1 h) and then incubated in a fresh medium for 48 h. Senescence-like phenotype was analysed by nuclei enlargement. The percentage of senescent cells is shown. The data are represented as the mean ± SEM.
DISCUSSION
The immediate effects of acute HS have been well studied. These effects include the transcriptional activation of stress response genes, membrane fluidisation, stress granule formation, redistribution of nuclear proteins, etc. (1,2,4). Generally, these processes are normalised in less than 24 h, and thereafter cells seem to be morphologically normal, dividing and metabolically active (3). Here, we studied the delayed effects of HS and showed that HS could induce senescence-like changes in human cells. Although SA-β-gal activity and enlarged morphology are not always associated with cellular senescence (27,28), more reliable markers, such as persistent DDR and upregulated expression of cell cycle inhibitors, were also observed in HS-treated cells. These results led us to propose that HS induces senescence-like cell cycle arrest.
Analysis of mechanisms of the HS-induced senescence-like cell cycle arrest revealed several interesting features of the cell stress response. Particularly, HS induced two waves of DNA damage in S-phase cells corresponding to the initial formation of top1-dependent SSBs and the subsequent formation of DSBs. We have previously reported that DNA replication arrest caused by HS is accompanied by the generation of SSBs and DNA-PK-dependent H2AX phosphorylation (3). Here, we showed that the suppression of replication and the generation of SSBs in cells subjected to HS are not coupled. We have demonstrated that HS induces SSBs by inhibiting top1 activity, resulting in the formation of stalled top1–DNA complexes that are likely converted into ‘true’ SSBs after the removal of stalled top1 by the ubiquitin-proteasome system. When these SSBs are encountered by replication forks, they are likely converted to difficult-to-repair DSBs, which trigger a delayed DDR and the subsequent development of the senescence-like phenotype. The crucial role of top1-generated SSBs in senescence-like phenotype acquisition is supported by the fact that inability of HS at low (41°C) or moderate (43°C) temperatures to induce generation of these complexes (Supplementary Figure S7) strongly correlates with the absence of senescent-like cells 48–72 h after HS (Supplementary Figure S3). The proposed mechanism is also supported by the observation that the chemical inhibition of DNA replication abolishes the development of the senescence phenotype. Thus, both the ongoing replication and the presence of SSBs are necessary to generate DSBs, trigger the DDR and cause the subsequent senescence. In this regard, it should be mentioned that HS per se causes only a short replication arrest. It appears that this short time interval is not sufficient for the repair of all SSBs introduced by top1 under HS conditions. It is thus likely that, after release from this arrest, the restarted replication forks encounter the non-repaired SSBs. This encounter results in generation of DSBs that trigger development of a senescence-like phenotype. In agreement with this supposition, in HS-treated cells, replication inhibitors prevent the development of the senescence phenotype when administered after HS (arrest extension). However, in cells treated with CPT, effective prevention of the development of senescence phenotype was only observed when CPT and APH/HU were administered simultaneously. This is because replication is independently arrested by HS but not by administration of CPT. The delayed DDR in cells treated with HS includes H2AX phosphorylation by ATM/ATR kinases and the assembly of DDR foci containing both 53BP1 and RAD51. These persistent DDRs trigger the development of senescence-like proliferation arrest via the p21CIP1 pathway. Although all the above-described events were strongly confined to early S-phase cells, we think that the difference between these cells and cells at other stages of S-phase is quantitative rather than qualitative. The much higher number of replication forks simultaneously operating in early S-phase cells increases the possibility of encountering top1-generated SSBs by one or several of progressing forks. The proposed mechanism easily explains some old experimental observations related to the increased sensitivity of S-phase cells to heat (29–31). For example, an error-prone DNA repair of S phase-specific difficult-to-repair DSBs might be the source of chromosomal aberrations seen in heat-treated cells (32). Moreover, our hypothesis is indirectly supported by the fact that APH treatment can protect the cells from the lethal effects of HS (33).
It is clear that the key molecular event triggering development of senescence-like phenotype in early S-phase cells subjected to HS is the generation of DSBs by replication forks that encounter top1-generated SSBs (Figure 4A). It appears that the nature of the SSBs encountered by the replication forks is not essential for the occurrence of the subsequent events. Indeed, we were able to stimulate the development of the senescent phenotype in early S-phase cells by treatment with H2O2, which is known to make SSBs in DNA. This observation allows us to propose a general model explaining the exclusive hypersensitivity of early S-phase cells to various genotoxic stresses (Figure 4). The key point of our model is the generation of DSBs by replication forks encountering SSBs that can be caused by a variety of agents. The inability of the cell to repair these DSBs, resulting in persistent DDR, appears to be the main factor triggering delayed cell fate decisions (e.g. senescence). Importantly, very low concentrations of SSB-inducing agents are sufficient to induce senescence in early S-phase cells (Figure 4B); this and the fact that the increase in the number of SSBs sensitises late S-phase cells as well (Figure 4B and data not shown) suggest that the vulnerability of early S-phase cells depends on the statistical probability of that the DNA replication forks will encounter SSBs.
The presented model has a clear predictive potential. First, it states that the resulting senescence of early S-phase cells does not depend on the nature of SSBs. We have already verified this using HS, CPT and H2O2; however, the list of SSB-inducing agents can be extended (ionising radiation, bleomycin, etc.). Second, the model predicts the resistance of non-early S-phase cells to such stresses—SSBs will be formed in such cells but will not lead to DSBs and subsequent cellular senescence. In vivo, such cells are represented by quiescent and terminally differentiated phenotypes as well as by slow growth. This fact and the very high sensitivity of early S-phase cells (CPT induces cellular senescence at nanomolar concentrations) make our findings potentially interesting for translational medicine. It may be speculated that ultra-low doses of SSB-inducing agents might be used to specifically target rapidly growing cells with no effect on slow- or non-dividing ones.
It should be mentioned that SSBs can be induced by physiologically relevant processes, such as the base and nucleotide excision repair pathways (BER and NER). Therefore, the list of SSB-inducing agents may also include factors producing oxidised bases, abasic sites or bases/nucleotides damaged in other ways (34). The BER/NER-produced SSBs are usually short-lived intermediates, which should not lead to drastic consequences; however, if the repair pathways are compromised (e.g. mutations in repair factors), the produced SSBs may be stabilised and hypothetically result in the changes described above (DSBs and subsequent cellular senescence). This mechanism may explain the development of aging/progeria symptoms in some NER-dependent genetic diseases, such as Cockayne syndrome and trichothiodystrophy (34,35).
SUPPLEMENTARY DATA
Supplementary Data are available at NAR Online.
Acknowledgments
We thank Dr Maria Lagarkova for help with primary cell culture and synchronization and Dr Oksana Maksimenko for help with flow cytometry of primary cells.
FUNDING
Russian Science Foundation [14–24–00022]. Funding for open access charge: Russian Science Foundation.
Conflict of interest statement. None declared.
REFERENCES
- 1.Richter K., Haslbeck M., Buchner J. The heat shock response: life on the verge of death. Mol. Cell. 2010;40:253–266. doi: 10.1016/j.molcel.2010.10.006. [DOI] [PubMed] [Google Scholar]
- 2.Morimoto R.I. The heat shock response: systems biology of proteotoxic stress in aging and disease. Cold Spring Harb. Symp. Quant. Biol. 2011;76:91–99. doi: 10.1101/sqb.2012.76.010637. [DOI] [PubMed] [Google Scholar]
- 3.Velichko A.K., Petrova N.V., Kantidze O.L., Razin S.V. Dual effect of heat shock on DNA replication and genome integrity. Mol. Biol. Cell. 2012;23:3450–3460. doi: 10.1091/mbc.E11-12-1009. [DOI] [PMC free article] [PubMed] [Google Scholar]
- 4.Velichko A.K., Markova E.N., Petrova N.V., Razin S.V., Kantidze O.L. Mechanisms of heat shock response in mammals. Cell. Mol. Life Sci. 2013;70:4229–4241. doi: 10.1007/s00018-013-1348-7. [DOI] [PMC free article] [PubMed] [Google Scholar]
- 5.Campisi J. Aging, cellular senescence, and cancer. Annu. Rev. Physiol. 2013;75:685–705. doi: 10.1146/annurev-physiol-030212-183653. [DOI] [PMC free article] [PubMed] [Google Scholar]
- 6.Zhao H., Darzynkiewicz Z. Biomarkers of cell senescence assessed by imaging cytometry. Methods Mol. Biol. 2013;965:83–92. doi: 10.1007/978-1-62703-239-1_5. [DOI] [PMC free article] [PubMed] [Google Scholar]
- 7.Toledo L.I., Altmeyer M., Rask M.B., Lukas C., Larsen D.H., Povlsen L.K., Bekker-Jensen S., Mailand N., Bartek J., Lukas J. ATR prohibits replication catastrophe by preventing global exhaustion of RPA. Cell. 2013;155:1088–1103. doi: 10.1016/j.cell.2013.10.043. [DOI] [PubMed] [Google Scholar]
- 8.Kuilman T., Michaloglou C., Mooi W.J., Peeper D.S. The essence of senescence. Genes Dev. 2010;24:2463–2479. doi: 10.1101/gad.1971610. [DOI] [PMC free article] [PubMed] [Google Scholar]
- 9.Dimri G.P., Lee X., Basile G., Acosta M., Scott G., Roskelley C., Medrano E.E., Linskens M., Rubelj I., Pereira-Smith O., et al. A biomarker that identifies senescent human cells in culture and in aging skin in vivo. Proc. Natl Acad. Sci. U.S.A. 1995;92:9363–9367. doi: 10.1073/pnas.92.20.9363. [DOI] [PMC free article] [PubMed] [Google Scholar]
- 10.Nitiss J.L., Soans E., Rogojina A., Seth A., Mishina M. Topoisomerase assays. Curr. Protoc. Pharmacol. 2012;57:3.3.1–3.3.27. doi: 10.1002/0471141755.ph0303s57. [DOI] [PMC free article] [PubMed] [Google Scholar]
- 11.Kiianitsa K., Maizels N. A rapid and sensitive assay for DNA-protein covalent complexes in living cells. Nucleic Acids Res. 2013;41:e104. doi: 10.1093/nar/gkt171. [DOI] [PMC free article] [PubMed] [Google Scholar]
- 12.Rowe T.C., Chen G.L., Hsiang Y.H., Liu L.F. DNA damage by antitumor acridines mediated by mammalian DNA topoisomerase II. Cancer Res. 1986;46:2021–2026. [PubMed] [Google Scholar]
- 13.Itahana K., Campisi J., Dimri G.P. Methods to detect biomarkers of cellular senescence: the senescence-associated beta-galactosidase assay. Methods Mol. Biol. 2007;371:21–31. doi: 10.1007/978-1-59745-361-5_3. [DOI] [PubMed] [Google Scholar]
- 14.Takahashi A., Mori E., Somakos G.I., Ohnishi K., Ohnishi T. Heat induces gammaH2AX foci formation in mammalian cells. Mutat. Res. 2008;656:88–92. doi: 10.1016/j.mrgentox.2008.07.012. [DOI] [PubMed] [Google Scholar]
- 15.Takahashi A., Matsumoto H., Nagayama K., Kitano M., Hirose S., Tanaka H., Mori E., Yamakawa N., Yasumoto J., Yuki K., et al. Evidence for the involvement of double-strand breaks in heat-induced cell killing. Cancer Res. 2004;64:8839–8845. doi: 10.1158/0008-5472.CAN-04-1876. [DOI] [PubMed] [Google Scholar]
- 16.Picard F., Cadoret J.C., Audit B., Arneodo A., Alberti A., Battail C., Duret L., Prioleau M.N. The spatiotemporal program of DNA replication is associated with specific combinations of chromatin marks in human cells. PLoS Genet. 2014;10:e1004282. doi: 10.1371/journal.pgen.1004282. [DOI] [PMC free article] [PubMed] [Google Scholar]
- 17.Wang Y., Guan J., Wang H., Leeper D., Iliakis G. Regulation of dna replication after heat shock by replication protein a-nucleolin interactions. J. Biol. Chem. 2001;276:20579–20588. doi: 10.1074/jbc.M100874200. [DOI] [PubMed] [Google Scholar]
- 18.Kiianitsa K., Maizels N. Ultrasensitive isolation, identification and quantification of DNA-protein adducts by ELISA-based RADAR assay. Nucleic Acids Res. 2014;42:e108. doi: 10.1093/nar/gku490. [DOI] [PMC free article] [PubMed] [Google Scholar]
- 19.Di Micco R., Fumagalli M., Cicalese A., Piccinin S., Gasparini P., Luise C., Schurra C., Garre M., Nuciforo P.G., Bensimon A., et al. Oncogene-induced senescence is a DNA damage response triggered by DNA hyper-replication. Nature. 2006;444:638–642. doi: 10.1038/nature05327. [DOI] [PubMed] [Google Scholar]
- 20.Durocher D., Jackson S.P. DNA-PK, ATM and ATR as sensors of DNA damage: variations on a theme? Curr. Opin. Cell. Biol. 2001;13:225–231. doi: 10.1016/s0955-0674(00)00201-5. [DOI] [PubMed] [Google Scholar]
- 21.Hickson I., Zhao Y., Richardson C.J., Green S.J., Martin N.M., Orr A.I., Reaper P.M., Jackson S.P., Curtin N.J., Smith G.C. Identification and characterization of a novel and specific inhibitor of the ataxia-telangiectasia mutated kinase ATM. Cancer Res. 2004;64:9152–9159. doi: 10.1158/0008-5472.CAN-04-2727. [DOI] [PubMed] [Google Scholar]
- 22.Sarkaria J.N., Busby E.C., Tibbetts R.S., Roos P., Taya Y., Karnitz L.M., Abraham R.T. Inhibition of ATM and ATR kinase activities by the radiosensitizing agent, caffeine. Cancer Res. 1999;59:4375–4382. [PubMed] [Google Scholar]
- 23.Willmore E., de Caux S., Sunter N.J., Tilby M.J., Jackson G.H., Austin C.A., Durkacz B.W. A novel DNA-dependent protein kinase inhibitor, NU7026, potentiates the cytotoxicity of topoisomerase II poisons used in the treatment of leukemia. Blood. 2004;103:4659–4665. doi: 10.1182/blood-2003-07-2527. [DOI] [PubMed] [Google Scholar]
- 24.Lin C.P., Ban Y., Lyu Y.L., Liu L.F. Proteasome-dependent processing of topoisomerase I-DNA adducts into DNA double strand breaks at arrested replication forks. J. Biol. Chem. 2009;284:28084–28092. doi: 10.1074/jbc.M109.030601. [DOI] [PMC free article] [PubMed] [Google Scholar]
- 25.Desai S.D., Zhang H., Rodriguez-Bauman A., Yang J.M., Wu X., Gounder M.K., Rubin E.H., Liu L.F. Transcription-dependent degradation of topoisomerase I-DNA covalent complexes. Mol. Cell. Biol. 2003;23:2341–2350. doi: 10.1128/MCB.23.7.2341-2350.2003. [DOI] [PMC free article] [PubMed] [Google Scholar]
- 26.Lin C.P., Ban Y., Lyu Y.L., Desai S.D., Liu L.F. A ubiquitin-proteasome pathway for the repair of topoisomerase I-DNA covalent complexes. J. Biol. Chem. 2008;283:21074–21083. doi: 10.1074/jbc.M803493200. [DOI] [PMC free article] [PubMed] [Google Scholar]
- 27.Lee B.Y., Han J.A., Im J.S., Morrone A., Johung K., Goodwin E.C., Kleijer W.J., DiMaio D., Hwang E.S. Senescence-associated beta-galactosidase is lysosomal beta-galactosidase. Aging Cell. 2006;5:187–195. doi: 10.1111/j.1474-9726.2006.00199.x. [DOI] [PubMed] [Google Scholar]
- 28.Imai Y., Takahashi A., Hanyu A., Hori S., Sato S., Naka K., Hirao A., Ohtani N., Hara E. Crosstalk between the Rb pathway and AKT signaling forms a quiescence-senescence switch. Cell. Rep. 2014;7:194–207. doi: 10.1016/j.celrep.2014.03.006. [DOI] [PubMed] [Google Scholar]
- 29.Westra A., Dewey W.C. Variation in sensitivity to heat shock during the cell-cycle of Chinese hamster cells in vitro. Int. J. Radiat. Biol. Relat. Stud. Phys. Chem. Med. 1971;19:467–477. doi: 10.1080/09553007114550601. [DOI] [PubMed] [Google Scholar]
- 30.Dewey W.C., Sapareto S.A., Betten D.A. Hyperthermic radiosensitization of synchronous Chinese hamster cells: relationship between lethality and chromosomal aberrations. Radiat. Res. 1978;76:48–59. [PubMed] [Google Scholar]
- 31.Bhuyan B.K. Kinetics of cell kill by hyperthermia. Cancer Res. 1979;39:2277–2284. [PubMed] [Google Scholar]
- 32.Wong R.S., Thompson L.L., Dewey W.C. Recovery from effects of heat on DNA synthesis in Chinese hamster ovary cells. Radiat. Res. 1988;114:125–137. [PubMed] [Google Scholar]
- 33.VanderWaal R.P., Griffith C.L., Wright W.D., Borrelli M.J., Roti J.L. Delaying S-phase progression rescues cells from heat-induced S-phase hypertoxicity. J. Cell. Physiol. 2001;187:236–243. doi: 10.1002/jcp.1073. [DOI] [PubMed] [Google Scholar]
- 34.Caldecott K.W. Single-strand break repair and genetic disease. Nat. Rev. Genet. 2008;9:619–631. doi: 10.1038/nrg2380. [DOI] [PubMed] [Google Scholar]
- 35.Menck C.F., Munford V. DNA repair diseases: what do they tell us about cancer and aging? Genet. Mol. Biol. 2014;37:220–233. doi: 10.1590/s1415-47572014000200008. [DOI] [PMC free article] [PubMed] [Google Scholar]
Associated Data
This section collects any data citations, data availability statements, or supplementary materials included in this article.