Nucl. Acids Res. 43 (10): 5112–5119. doi: 10.1093/nar/gkv408
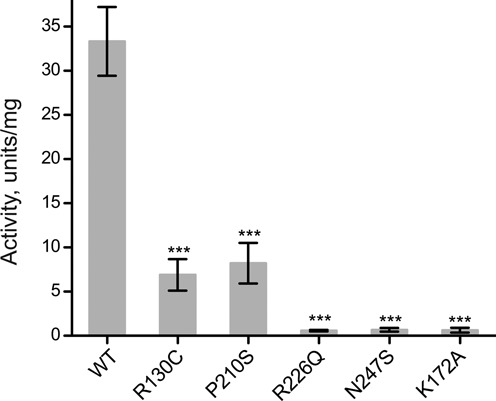
The authors wish to draw attention to an error in their published article. The dehydrogenase activities reported in Figure 1 and Table 1 were based on photometric data that had not been correctly processed after measurement (path length correction not applied), leading to a systematic error in the reported dataset. As a consequence, the dehydrogenase activities reported in Figure 1 and Table 1 were too low by about a factor of 2. A new figure and table are included below.
Figure 1.

Pathogenic mutations in SDR5C1 affect its dehydrogenase activity. The l-3-hydroxyacyl-CoA dehydrogenase activity of wild type (WT) and mutant SDR5C1 was measured with acetoacetyl-CoA as substrate and NADH as cofactor. An active-site mutant (K172A) was included as “dehydrogenase-dead” control. Means and SD of three independent experiments are shown (*** P < 0.001).
Table 1. Molecular characterization of SDR5C1 mutant forms.
| Dehydrogenase activity (units/mg)a | RNase P activity, kobs (min−1)b | m1G9 methyltransferase activity, kobs (min−1)b | Tetramerized SDR5C1a,c | Complexed TRMT10Ca,d | |
|---|---|---|---|---|---|
| wild type | 33.33 ± 3.89 | 4.63 ± 0.61 | 1.05 ± 0.16 | 100% | 43.2% ± 1.7 |
| R130C | 6.90 ± 1.78 | n.d. | n.d. | 100% | 28.7% ± 3.5 |
| P210S | 8.21 ± 2.29 | 0.59 ± 0.07 | 0.12 ± 0.02 | 100% | 39.7% ± 0.6 |
| R226Q | 0.58 ± 0.09 | n.d. | n.d. | 26.0% ± 9.5 | 14.3% ± 4.0 |
| N247S | 0.67 ± 0.21 | n.d. | n.d. | 25.8% ± 6.1 | 9.3% ± 6.7 |
| K172A | 0.63 ± 0.28 | 5.13 ± 0.60 | 0.90 ± 0.18 | 100% | 43.0% ± 3.5 |
Summary of SDR5C1-dependent enzymatic activities, SDR5C1 tetramerization, and interaction with TRMT10C. Data as illustrated in Figures 1, 2, and 4 (n.d., not determined); corrected values in bold.
aMean and SD.
bRate and standard error derived by non-linear regression.
cEstimated from four independent blue native PAGE experiments.
dMass percentage of the complex.
The findings and conclusion of the article are not affected and remain valid.
The authors apologise to the readers for this error and any inconvenience caused.


