

Abstract
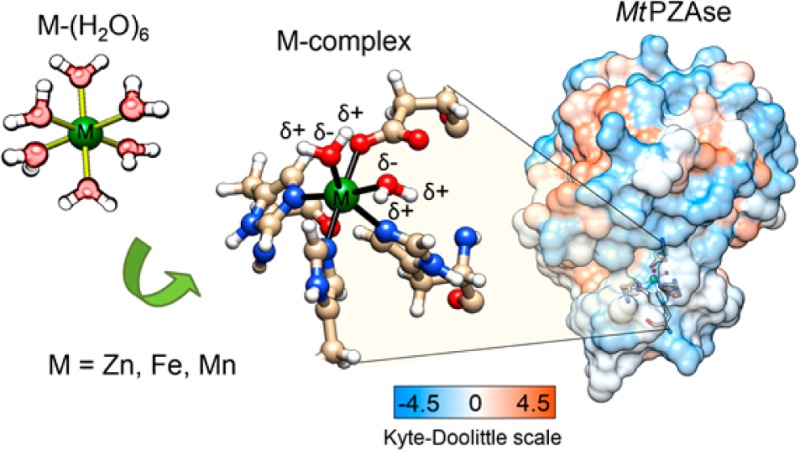
Mycobacterium tuberculosis pyrazinamidase (PZAse) is a key enzyme to activate the pro-drug pyrazinamide (PZA). PZAse is a metalloenzyme that coordinates in vitro different divalent metal cofactors in the metal coordination site (MCS). Several metals including Co2+, Mn2+, and Zn2+ are able to reactivate the metal-depleted PZAse in vitro. We use quantum mechanical calculations to investigate the Zn2+, Fe2+, and Mn2+ metal cofactor effects on the local MCS structure, metal–ligand or metal–residue binding energy, and charge distribution. Results suggest that the major metal-dependent changes occur in the metal–ligand binding energy and charge distribution. Zn2+ shows the highest binding energy to the ligands (residues). In addition, Zn2+ and Mn2+ within the PZAse MCS highly polarize the O–H bond of coordinated water molecules in comparison with Fe2+. This suggests that the coordination of Zn2+ or Mn2+ to the PZAse protein facilitates the deprotonation of coordinated water to generate a nucleophile for catalysis as in carboxypeptidase A. Because metal ion binding is relevant to enzymatic reaction, identification of the metal binding event is important. The infrared vibrational mode shift of the C=Nε (His) bond from the M. tuberculosis MCS is the best IR probe to metal complexation.
1. Introduction
Metal ions in proteins participate in a wide variety of structural1,2 and catalytic functions.3 Metal ions could act as nucleophilic catalysts such as Zn2+ in carbonic anhydrases4 or as electron donors, for instance, when the oxidation state of the central Fe ion changes from +2 to +3 in rubredoxin.5,6 Eventually, the combination of specific ligands and the surrounding hydrogen bonding network controls the metal center characteristics such as its redox potential.7−9 The coordination of metal ions in proteins affects the local electron distribution.10,11 Once the transfer of electrons from the ligands to the metal ion takes place, the coordination bonds are formed. Then, another charge flow occurs when the enzyme binds the substrate, inducing changes in the electrical dipole and its angular direction, which rotates as the reaction progresses.12 Studies suggest that some enzymes are active (ready to react with the substrate) due to a vacant coordination position at the metal center. A coordination position is considered free if it is occupied by a water molecule, which is a weak ligand that can be easily replaced.13,14 However, some enzymes require the water coordination to act as a nucleophile at the active site upon activation.15
Tuberculosis (TB) is the most leading cause of death in developing countries and is considered a reemerging disease in the developed world.16 Pyrazinamide (PZA) is an important prodrug against latent TB infection17−20 and is activated by nicotinamidase/pyrazinamidase (PZAse) enzyme.21,22 PZAse is a nonessential metalloenzyme, which coordinates a metal ion in the region known as the metal coordination site (MCS). The three-dimensional structure of M. tuberculosis PZAse has been elucidated after its cocrystallization with Fe2+ (PDB ID code 3PL1). The MCS comprises Asp49, His51, His57, and His71 residues and two coordinated water molecules.23 Our previous experiments showed that metal-depleted M. tuberculosis PZAse has a different reactivation pattern depending on the metal ion substitution.24 Moreover, the kcat and Km values showed that the affinity for the substrate depends on the coordinated metal. Among a wide variety of metal ions, Co2+, Mn2+, and Zn2+ reactivated the metal-depleted M. tuberculosis PZAse.24 Other similar studies showed that Mn2+ and Fe2+ reactivate metal-depleted M. tuberculosis PZAse.25 However, we do not know exactly how the metal ion is involved in the reaction of M. tuberculosis PZAse. Du et al.26 proposed a mechanism of catalysis of Pyrococcus horikoshii pyrazinamidase, which has a zinc metal ion in coordination with the protein (37% amino acid sequence identity with M. tuberculosis PZAse). They suggested that a cysteine residue of the binding site nucleophilically attacks the carbonyl carbon of PZA via the thiolate forming an acylated enzyme (first tetrahedral intermediate) after being activated by an aspartic acid residue, releasing ammonia. Then, zinc-activated water attacks the carbonyl carbon of the thioester bond (second tetrahedral intermediate). Finally, the pyrazinoic acid is released from the enzyme pocket through the binding of another water molecule to the metal.26M. tuberculosis PZAse has a different metal binding motif and has been reported with Fe2+ instead of Zn+2 complexes.23 The M. tuberculosis PZAse MCS is constituted by Asp49, His51, His57, and His71 (Asp52, His54, and His71, in P. horikoshii). However, in both cases the water molecules complete the coordination sphere of the metal ion: two water molecules in M. tuberculosis and three water molecules in P. horikoshii. Thus, the coordinated water molecules could play an important role on the enzymatic activity in both enzymes.
IR spectroscopy techniques have been used to monitor local electrostatic potential,12,27 hydrogen bonding,28 water interface,29 drug–protein interaction, protein dynamics30−32 and enzymatic reaction progression.33 Unfortunately, IR experiments have technical limitations due to the short lifetime of transition states34,35 and measuring range limits.36 However, sophisticated DFT calculations can predict vibrational IR spectra with chemical accuracy.37,38 In this study, we calculate the stretching modes to evaluate the metal-dependent bond strength. In addition, we evaluate the binding energy of several metal ions to the M. tuberculosis PZAse MCS and the metal-dependent water polarization. Our results reveal that metal substitution leads a major change in the polarization of coordinated water molecules and the MCS flexibility, which could affect the substrate binding and enzyme reactivity. A better understanding of the functional role of metal ions in the PZAse activity is relevant considering that abnormalities in the PZAse activity are highly associated with the PZA resistance.39,40
2. THEORETICAL METHODS
The M. tuberculosis PZAse MCS comprises four residues (His51, His57, His71, and Asp49), two water molecules, and a divalent metal atom. The initial MCS structure is adopted from the crystallized PZAse structure of M. tuberculosis H37Rv strain (3PL1 PDB code).23 In this crystalline structure, the MCS is coordinated with Fe2+. Using the MCS-Fe2+ model, we construct two more complexes by the substitution of Fe2+ with Zn2+ and Mn2+. The MCS structure is separated from the entire enzyme, and dangling bonds are completed with hydrogen atoms.
Density functional theory (DFT)41,42 is used to find the ground state of all coordinated complexes.43−46 We use Becke-3 exchange functional47 with the Perdew–Wang 91 correlation functional.48 In DFT, the Schrödinger equation is transformed to an energy functional of the electron density. We use the atom-centered split valence with polarization functions 6-31G(d,p)49 for C, H, O, and N; and the LANL2DZ basis set50 with effective core potentials (ECP) for the metal atoms. In the ECP, the core electrons are replaced by an effective potential that speeds up calculations with little loss of accuracy. All these procedures have provided accurate results in a wide range of applications including those with organic and inorganic moieties.51−56 The three metal complexes are optimized in the gas and aqueous phases using the polarizable continuum model (PCM).57 The PCM mimics the water solvent effect on the compounds, yielding the molecular free energy in solution as the sum of the electrostatic, distribution-repulsion, and cavitation energies.57 The cavities are defined by van der Waals radii spheres centered at the atomic positions. All optimizations are performed without geometrical symmetry constraints; the C1 point group is used, to find out whether unsymmetrical structures are local minima. To determine whether a structure is a local minimum, we calculate the second derivative of the energy with respect to all spatial coordinates to safeguard that Hessian matrix eigenvalues are all real. Diagonalization of the mass weighted Hessian yields the harmonic vibrational frequencies.58 Mulliken population analysis59 is used to determine equivalent charges on all atoms from the metal complexes.
Some physical properties depend upon a system response to some form of perturbation. IR intensities result from electric field perturbations to the molecular system. The response to an electric field is described as a nonlinear function, which can be represented by a Taylor expansion involving coefficients identified as the permanent dipole moment (μ), polarizability (α), and hyperpolarizability (β). As a result, IR intensities can be calculated as the derivative of the dipole moment with respect to the coordinates of the normal modes of vibration.60 Validation of the theoretical frequency values is done using experimental spectroscopy data of analogue complexes.36,61−65 Binding energy values are obtained from the difference between the energy of the optimized complex and the sum of single point energies of each complex component. All the binding energy calculations consider the system in the gas phase.66 Thermal, zero point vibrational energy (ZPVE),67 basis set superposition error (BSSE),68 and Grimme dispersion (GD3)69 corrections are added to the binding energy calculation. BSSE correction of a system with two fragments (Δ) considers the calculation of each fragment energy using full set of expansion functions of the entire system energy calculation. This is done by taking each complementary fragment orbital as ghost:
All calculations are performed using the Gaussian 09 program.70 Jmol is used to visualize the optimized structures.71 The enzyme hydrophobicity is estimated using the Kyte and Doolittle hydrophobic index, and the graphical model is done using Chimera software.72 The hydrophobic index depends on the free energy transfer from vapor to water of amino acids and amino acid distribution. The calculation of the root-mean-square distance (RMSD) is done by the VMD program.73 The stretching modes are assigned using isotopically substituted species such as nitrogen (15N) and oxygen (17O). The force constant of bonds have been calculated from the Hessian matrix using the FUERZA procedure.74,75 Our spectroscopy analysis is focused on the region 0–500 cm–1 because all the stretching modes of the coordination bonds rely on this region. The IR signatures have been plotted using pure Lorentzian functions with a full width at half maximum (fwhm) of 10 cm–1.
3. Results and Discussion
3.1. Hydrophobicity of PZAse
Water plays an important role in molecular recognition. It mediates the interaction between binding partners and contributes to either enthalpic or entropic stabilization. The affinity to water is very important to enzymes. Usually, the enzymatic reactions occur by the mediation of water molecules, e.g., proton transfer. Figure 1 shows the Kyte and Doolittle hydrophobic scale values for the PZAse amino acids.
Figure 1.
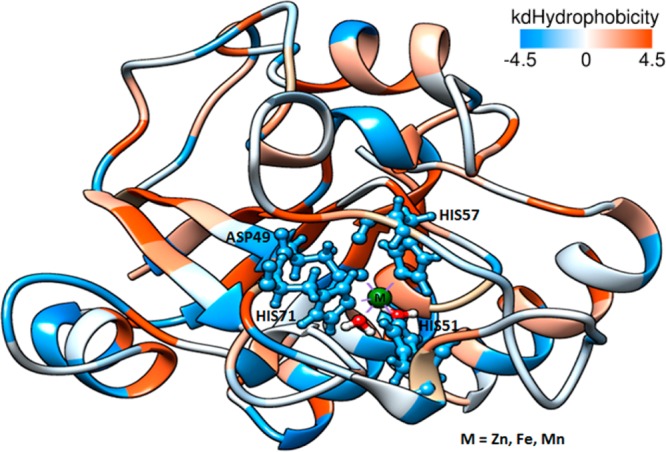
Hydrophobicity surface of PZAse. The blue region means highly hydrophilic characteristic. Dodger blue for the most hydrophilic, to white, to orange red for the most hydrophobic.
The amino acids from the MCS are primarily blue, indicating that they have hydrophilic character. This fact favors the metal free ion approaching toward the MCS, because free metal ions are into a hydration shell.76−79 The water affinity of the MCS surrounding could attenuate the metal-solvent interaction, facilitating the ligand exchange.
3.2. Optimization of Structures
Zn-, Fe-, and Mn-coordinated complexes are optimized in the gas and aqueous phases. Table 1 shows the total free energy for the PZAse–metal complexes under study. Energies are lower in aqueous phase than in gas phase. This fact indicates that the PZAse–metal complexes have greater polar character and consequently show greater affinity to water. The energy difference between complexes in the aqueous and gas phases is around 57 kcal/mol, which in comparison to the hydrogen bond energy O–H···N (6.9 kcal/mol) and O–H···O (5.0 kcal/mol), corresponds to approximately ten hydrogen bonds. The Fe-coordinated complex has the lowest free energy in the aqueous phase, which means it has a higher hydrophilic property than Zn- and Mn-coordinated complexes. Fe- and Mn-coordinated complexes are high spin systems. The highest multiplicity is sextet and corresponds to the Mn-coordinated complex. It is because the Mn-coordinated complex has a higher repulsive energy than the energy required to place an electron on the eg orbital. It means that the energy cost of placing an electron into an already singly occupied orbital must be higher than the cost of placing the additional electron into an eg orbital.
Table 1. Ground State Energy of the Coordinated Complexes in Gas and Aqueous Phases.
| free energy 298 K (Ha) |
|||||
|---|---|---|---|---|---|
| compound | multiplicitya | system | gas phase | aqueous phaseb | ΔEc (kcal/mol) |
| Zn complex | singlet | d10 | –2074.18611 | –2074.27814 | 57.7 |
| Fe complex | quintet | d6 | –2132.07416 | –2132.16407 | 56.4 |
| Mn complex | sextet | d5 | –2112.58723 | –2112.67895 | 57.6 |
Multiplicity (2S+1), S is the total spin.
Aqueous phase effect is calculated with the polarizable continuum model.
Gas-aqueous phase free energy difference.
It is known that the split of d-orbital energy levels of the transition metal under the interaction with ligand fields governs the symmetry of the coordination complexes. The optimized structures of Zn-, Fe-, and Mn-coordinated complexes show small distorted octahedral structures. This is because the electron–electron repulsion between metal and ligands orbitals does not largely disturb the symmetry. The 3d-orbital energy splitting of metal-coordinated complexes is small because His, Asp, and water have a weak field ligand. Figure 2 shows the optimized structures of the Zn-, Fe-, and Mn-coordinated complexes. Metal ions coordinate with three N-donor ligands (imidazolyl group from histidine residues) and three O-donor ligands (carboxylate from aspartic acid residue and water molecules). The metal-coordinated complexes have two coordinated water molecules as endogenous ligands, which are important to the enzymatic reaction understanding, because usually coordinated water results in a better Lewis acid than free water.
Figure 2.
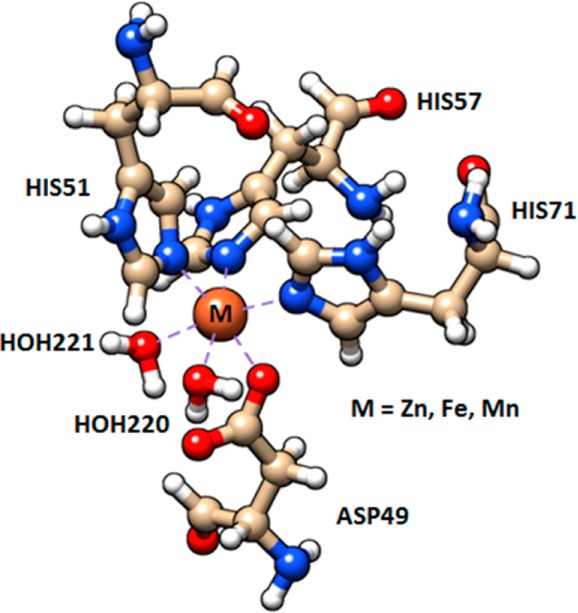
Optimized structure of the Zn2+-, Fe2+-, and Mn2+-coordinated complexes. These complexes have the same ligands: the imidazole of histidine (His51, His57, and His71), the aspartic acid (Asp49) and two water molecules (HOH 220–221). [M(His)3(Asp)2H2O]+1, where M = Zn, Fe, and Mn. Dashed lines represent the coordination bonds.
To determine the actual hydrophilic character of the metal within the protein, we calculate the binding energy of the two coordinated water molecules to the metal ion when it is part of the complex with the amino acids (Table 2). Each coordinated water molecule in the overall metal-coordinated complex is fixed by a coordination bond to the central metal and a hydrogen bond to the carboxylate oxygen of Asp49. Zn-coordinated complex has the highest interaction energy between the two coordinated water molecules and [Zn(His)3(Asp)]+1.
Table 2. Binding Energya of Two-Coordinated Water Molecules to the Metal Complex in PZAse in Gas Phase.
| complex | binding energy | ZPEV | BSSE | GD3 |
|---|---|---|---|---|
| Zn complex | –59.82 | 4.85 | 11.61 | –23.11 |
| Fe complex | –56.81 | 4.64 | 12.49 | –22.70 |
| Mn complex | –59.57 | 4.63 | 12.39 | –21.18 |
Binding energy and correction values in kcal/mol.
Zn2+ Coordination Complex
The ground state is a singlet, meaning that all the electrons are paired. Table 3 shows the calculated length of the coordination bonds and their comparison with averaged experimental values obtained from zinc metalloenzyme database.80 The lengths of the Zn–Nε coordination bonds are shorter in the aqueous phase than in the gas phase, whereas Zn–O bonds are larger, except for Zn–O (H2O220). All the calculated coordination bond length values are higher than the average bond length of the corresponding bond type from the zinc metalloenzyme database.
Table 3. Calculated Coordination Bond Lengths in the Zn-, Fe-, and Mn-Coordinated Complexes and Mean Error (ME).
| length
(Å) |
ME |
||||
|---|---|---|---|---|---|
| bond | gas phase | aqueous phase | exp lengtha (Å) | gas phase | aqueous phase |
| Zn–Nε (His51) | 2.167 | 2.160 | 2.120a | 0.047 | 0.040 |
| Zn–Nε (His57) | 2.199 | 2.183 | 2.120a | 0.079 | 0.063 |
| Zn–Nε (His71) | 2.160 | 2.158 | 2.120a | 0.040 | 0.038 |
| Zn–O (Asp49) | 2.116 | 2.150 | 2.070a | 0.046 | 0.080 |
| Zn–O (H2O221) | 2.222 | 2.227 | 2.220a | 0.002 | 0.007 |
| Zn–O (H2O220) | 2.265 | 2.257 | 2.220a | 0.045 | 0.037 |
| Fe–Nε (His51) | 2.172 | 2.154 | 2.302b | –0.130 | –0.148 |
| Fe–Nε (His57) | 2.191 | 2.197 | 2.326b | –0.135 | –0.129 |
| Fe–Nε (His71) | 2.187 | 2.163 | 2.234b | –0.047 | –0.071 |
| Fe–O (Asp49) | 2.063 | 2.176 | 2.150b | –0.087 | 0.026 |
| Fe–O (H2O221) | 2.279 | 2.233 | 2.260b | 0.019 | –0.027 |
| Fe–O (H2O220) | 2.289 | 2.239 | 2.872b | –0.583 | –0.633 |
| Mn–Nε (His51) | 2.233 | 2.225 | 2.200c | 0.033 | 0.025 |
| Mn–Nε (His57) | 2.262 | 2.244 | 2.200c | 0.062 | 0.044 |
| Mn–Nε (His71) | 2.220 | 2.220 | 2.200c | 0.020 | 0.020 |
| Mn–O (Asp49) | 2.147 | 2.181 | 2.151d | –0.004 | 0.030 |
| Mn–O (H2O221) | 2.295 | 2.306 | 2.226d | 0.069 | 0.080 |
| Mn–O (H2O220) | 2.345 | 2.334 | 2.226d | 0.119 | 0.108 |
Average bond length data from 994 Protein Data Bank structures.80
Crystallized pyrazinamidase enzyme belonging to M. tuberculosis (PDB code, 3PL1).23
Average bond length data from Protein Data Bank structures and the Cambridge Structural Database with resolution <1.50 Å.32
Average bond length data from Protein Data Bank structures and the Cambridge Structural Database with resolution <1.25 Å.33
Fe2+ Coordination Complex
The ground state is quintet. Table 3 shows the calculated length of coordination bonds in comparison with experimental values obtained from PZAse structure cocrystallized with Fe.23 Coordination bonds of the optimized Fe complex are shorter than in the MCS of the PZAse crystal. One of the experimental bond lengths of Fe–O(H2O) differs more than 0.6 Å from theoretical values because the position of a MCS surrounding water molecule from the crystallized enzyme does not correspond to the optimized complex at the minimum energy level. In the crystal, the two surrounding water molecules (H2O220 and H2O221) are localized distinctively, H2O220 is close to Fe–O coordination bond distance but H2O221 is not. Displacement of interstitial water during a protein crystallization is common. The crystallized protein structure depends on particular environment and operating conditions such as pH and salt in the buffer, temperature, and supersaturation. These conditions restrain atoms positions in different ways than in the gas/aqueous phase calculated here.
Mn2+ coordination complex
The ground state is sextet; i.e., five electrons are unpaired. Structurally, the paramagnetic effects offer a rich source of long-range structural restraints. The paramagnetic effect of Mn2+ on the proton relaxation rate of water at different magnetic fields strengths could allow us to elucidate the exact role of the metal-bound water molecule in the reaction. Table 3 shows the comparison of calculated and averaged experimental coordination bond length values from the manganese metalloprotein database.81 We notice that the calculated coordination bond length values are higher than the average ones from crystallized Mn metalloproteins.
From Table 3, the Fe-coordinated complex shows the highest bond length mean errors from optimized structures and crystallized enzyme. The metal atoms differ in the ionic radius for six-coordination: Mn2+, 0.83 nm (high spin); Fe2+, 0.78 nm (high spin); Zn2+, 0.74 nm (low spin).82 The small ionic radius of the metal center allows the formation of short coordination bonds between the metal and its ligands. Calculated coordination bonds affirm this hypothesis. Smaller coordination bonds are present in the Zn complex, and longer bonds are in Mn complex. Results show that the Me–O (Asp) bond type is shorter than Me–O (H2O) probably because the oxygen of the aspartic acid residue has higher electron density than the oxygen atom belonging to water. It is because the resonant effect of the carboxylate terminal allows a more intense Coulomb interaction with the divalent cation. In addition, among the M–Nε bond type, the Me–Nε (His57) bond at the axial location is longer than the Me–Nε (His51 and His71) at the equatorial. Figure 3 shows that the optimized metal complex structures do not differ notoriously (RMSD 0.088 Å). The optimized MCS structures differ from the crystallized PZAse enzyme MCS, PDB code 3PL1 (overall RMSD 1.092 Å). This structural difference could be due to the steric effect by bulky amino acids from the second coordination sphere and the electrostatic environment of the enzyme. However, the RMSD value is into the acceptable range (<2 Å). It suggests that metal ion replacement does not disturb the 3D orientation of endogenous ligands (amino acids).
Figure 3.
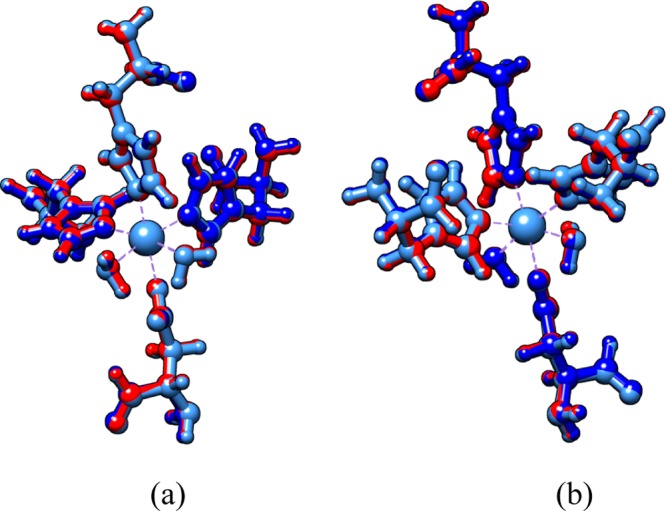
Superimposed complexes of Zn2+ (red), Fe2+ (dark blue), and Mn2+ (cyan) in the aqueous phase. (b) is the view rotated 180° from (a). The overall RMSD of the three optimized metal complexes is 0.088 Å.
Studies of coordination event in M. tuberculosis PZAse have been done with the metal ions addition in the metal-depleted PZAse sample. These studies showed that metal ions reactivate the PZAse enzymatic activity, which mean that ligands from protein are able to coordinate metal ions in solution.24 To understand this event, we calculate the binding energy of different metal ions to ligands. Table 4 shows the binding energy values of the metals when they are fully coordinated to water molecules and when they are coordinated at the PZAse MCS.
Table 4. Binding Energya of Metal Ion to Six Ligands in the Gas Phasea.
| complex | binding energy | ZPEV | BSSE | GD3 |
|---|---|---|---|---|
| Zn(H2O)6 | –387.26 | 9.67 | 12.74 | –19.94 |
| Fe(H2O)6 | –381.85 | 9.18 | 12.96 | –20.09 |
| Mn(H2O)6 | –356.39 | 9.35 | 12.89 | –18.86 |
| Zn complex | –603.01 | 8.07 | 8.60 | –19.90 |
| Fe complex | –600.94 | 8.05 | 12.30 | –18.87 |
| Mn complex | –569.05 | 7.78 | 11.02 | –18.50 |
Binding energy and correction values in kcal/mol.
Results from Table 4 explain why the complexation of metal ions is possible within the PZAse MCS. The binding energy of metal to ligands is higher when the MCS coordinates the ion metal complex than when just water molecules coordinate it. It is important to understand that protein environment provides a means of stabilizing a coordination with specific biological function, in this case to ensure the nonredox role of metal ion. Zn2+ shows the highest binding energy to the ligands from protein, but it has the highest energetic cost to displace the water molecules from first hydration shell. However, it is not considered the effect of the hydrophilic MCS surrounding (Figure 1), which could affect the metal−water affinity and favors the ligand exchange.
Experiments have shown that the pKa value of water (pKa = 15.74) decreases when it forms part of a metal complex such as [Zn(H2O)6]2+ (pKa = 9.0). In addition, it is possible for a zinc-bound water molecule to have a pKa as low as 7 in carbonic anhydrase to enable the deprotonation at neutral pH.83 It is known that the pKa of metal-bound water is influenced by the coordination number and charge distribution of the complex. Table 5 shows the partial charges of the atoms from the metal-coordinated complexes. Results indicate that the charge transfer from identical ligands to different metal ions varies. It means that metal ions have different electron acceptor characteristic (Lewis acid). Fe2+ easily accepts electrons from ligands, whereas Zn2+ does not. Additionally, the metal ions induce a differential polarization of the metal-bound water as following Zn2+ > Mn2+ > Fe2+. This effect plays an important role in the enzymatic reaction because the coordinated water polarization could facilitate a deprotonation event under a basic residue interaction.
Table 5. Atomic Partial Charges of Some Atoms from Optimized Metal-Coordinated Complexes in Aqueous Phase.
| atom | Zn complex | Fe complex | Mn complex |
|---|---|---|---|
| Me | 0.993 | 0.664 | 0.801 |
| Nε (His51) | –0.557 | –0.527 | –0.540 |
| Nε (His57) | –0.554 | –0.496 | –0.529 |
| Nε (His71) | –0.570 | –0.523 | –0.547 |
| O (Asp49) | –0.588 | –0.546 | –0.571 |
| O66 (H2O221) | –0.659 | –0.620 | –0.634 |
| H67a (H2O221) | 0.368 | 0.371 | 0.369 |
| H68 (H2O221) | 0.369 | 0.369 | 0.366 |
| O77 (H2O220) | –0.660 | –0.626 | –0.634 |
| H76 (H2O220) | 0.371 | 0.371 | 0.367 |
| H78a (H2O220) | 0.369 | 0.376 | 0.369 |
Hydrogen donor, OH···OC.
3.3. IR Spectra Analysis
Vibrational spectroscopy is very sensitive to changes in bond strength. The vibrational spectra can be obtained from the absorption of IR, Raman scattering or differential absorption of polarized light. Table 6 shows the validation of the chosen level of theory for the calculations, by the comparison of the calculated (calc) stretching vibrational mode frequency of the coordination bonds of the three metal complexes with their corresponding experimental (exp) values.
Table 6. Comparison of Calculated and Experimental Vibrational Frequencies for Metal–Nε and Metal–O Bonds of the Zn+2-, Fe+2-, and Mn+2-Coordinated Complexes in the Gas and Aqueous Phases.
| calc |
mean error |
||||
|---|---|---|---|---|---|
| stretching vibrational mode (ν) | gas phase | aqueous phase | exp | gas phase | aqueous phase |
| Zn–Nε (His) | 208 | 210 | 208a | 0 | 2 |
| Fe–Nε (His) | 220 | 225 | 231b | –11 | –6 |
| Mn–Nε (His) | 215 | 212 | 211c | 4 | 1 |
| Zn–O (Asp) | 224 | 250 | 249d | –25 | 1 |
| Fe–O (Asp) | 302 | 290 | 315e | –13 | –25 |
| Mn–O (Asp) | 218 | 246 | 245f | –27 | 1 |
| Zn–O (H2O) | 275 | 271 | |||
| Fe–O (H2O) | 268 | 279 | |||
| Mn–O (H2O) | 264 | 258 | |||
The calculated frequencies (Table 6) of the Me–Nε (His) bond stretching modes are closer to experimental values than Me–O (Asp and H2O). The stretching modes of coordination bonds from calculations at aqueous phase show closer values to the experiments than at gas phase (∼5% accuracy with experimental values). However, there are still differences between calculated and experimental frequencies of the MCS. Two main factors may be responsible for these differences, the environment and the harmonic approximation limitations.
Bond force constants determine the bond stiffness and are calculated from the second derivative of the energy with respect to the Cartesian coordinates or Hessian tensor. Table 7 shows the force constant for coordination and O–H(H2O) bonds, which are calculated from the Hessian of metal complexes in the aqueous phase.
Table 7. Force Constant Values of Coordination and O–H(H2O) Bonds of Metal Complexes in Aqueous Phase.
| bond | length (Å) | force constant [kcal/(mol·Å2)] |
|---|---|---|
| Zn–Nε (His51) | 2.160 | 43.59 |
| Zn–Nε (His57) | 2.183 | 38.46 |
| Zn–Nε (His71) | 2.158 | 44.01 |
| Zn–O (Asp49) | 2.150 | 15.56 |
| Zn–O66 (H2O221) | 2.227 | 15.31 |
| Zn–O77 (H2O220) | 2.257 | 14.95 |
| Fe–Nε (His51) | 2.154 | 47.43 |
| Fe–Nε (His57) | 2.197 | 36.37 |
| Fe–Nε (His71) | 2.163 | 43.81 |
| Fe–O (Asp49) | 2.176 | 17.42 |
| Fe–O66 (H2O221) | 2.233 | 17.91 |
| Fe–O77 (H2O220) | 2.239 | 20.33 |
| Mn–Nε (His51) | 2.225 | 39.29 |
| Mn–Nε (His57) | 2.244 | 35.71 |
| Mn–Nε (His71) | 2.220 | 40.59 |
| Mn–O (Asp49) | 2.180 | 13.92 |
| Mn–O66 (H2O221) | 2.306 | 11.52 |
| Mn–O77 (H2O220) | 2.338 | 12.30 |
| (Zn complex) O77–H76 (H2O220) | 0.965 | 588.48 |
| (Zn complex) O77–H78a (H2O220) | 0.988 | 469.44 |
| (Zn complex) O66–H67a (H2O221) | 0.988 | 468.38 |
| (Zn complex) O66–H68 (H2O221) | 0.965 | 591.54 |
| (Fe complex) O77–H76 (H2O220) | 0.966 | 587.00 |
| (Fe complex) O77–H78a (H2O220) | 0.992 | 450.35 |
| (Fe complex) O66–H67a (H2O221) | 0.988 | 470.68 |
| (Fe complex) O66–H68 (H2O221) | 0.965 | 591.75 |
| (Mn complex) O77–H76 (H2O220) | 0.965 | 588.18 |
| (Mn complex) O77–H78a (H2O220) | 0.988 | 473.04 |
| (Mn complex) O66–H67a (H2O221) | 0.988 | 469.47 |
| (Mn complex) O66–H68 (H2O221) | 0.965 | 591.25 |
Hydrogen bonded O—H bond, O—H···O=C.
Among coordination bonds, the Me-Nε bond type is much tighter than Me-O (Table 7). The bond force constant for Me–Nε bond type decreases as Fe–Nε > Zn–Nε > Mn–Nε, and for the Me–O(Asp/H2O) bond type as Fe–O > Zn–O > Mn–O. The O66–H67 and O77–H78 bonds are significantly more flexible than the other O–H bond from the corresponding coordinated water molecule, because the hydrogen atom of these bonds (H67 and H78) forms a hydrogen bond with Asp49. Results suggest that H67 and H68 are more feasible to be donated. Figure 4 compares the calculated IR spectra of metal complexes in the gas and aqueous phases.
Figure 4.

Comparison of far-infrared intensity spectra for (a) Zn-, (b) Fe-, and (c) Mn-coordinated complexes in aqueous and gas phases in the 500–0 cm–1 region. Calculated bond stretching modes from metal-coordinated complexes are indicated by arrows, as well as experimental bond stretching from analogue structures. The stretching mode of metal–O(H2O) is represented by ν1, metal–O(Asp) by ν2 and metal–Nε (His) by ν3. Experimental values are denoted by single prime mark.
The calculated stretching vibrational mode of the Me–O bond type is higher than for the Me–Nε bond, and the wavenumber values corresponding to the stretching vibrational modes of coordination bonds of metal complexes in the aqueous phase are in closer agreement with experimental data than the corresponding ones in the gas phase (Figure 4). Also, the stretching wavenumber values of the coordination bonds depend upon the environment. The Me–O(Asp) band is the most “solvent-sensitive” band in the far-infrared spectra. Intensity in a molecular spectrum is as important as the wavenumber. High IR intensities are located at 400–500 cm–1 and the intermediate ones are at 200–300 cm–1 for both spectra (metal-coordinated complexes in the gas and aqueous phases). Generally, the IR intensity is higher when the metal-coordinated complex is in the aqueous phase because the increment of the dipole moment under a dielectric environment further polarizes the molecule. Among the metal complexes, the Fe-coordinated complex has the highest IR intensities in the aqueous phase. It is because the dipole moment difference of the Fe-coordinated complex in the aqueous and gas phases is 34.97 D, whereas for Zn- and Mn-coordinated complexes the differences are around 1.76 D. This suggests that the induced dipole moment by dielectric polarization is highly susceptible to increase when Fe2+ is coordinated to the MCS. In general, the measurement of solvent dependence of stretching frequency, line shape, and absorbance intensity represents a model to identify the local environment of proteins (hydrophilic/hydrophobic region).
It is known that water dynamics is coupled to the catalytic reaction coordinate.85 Thus, it is interesting to evaluate the metal–water bond strength. Table 8 shows the wavenumber values of stretching modes of the Me–O(H2O), hydrogen bonded O–H(H2O), and free O–H(H2O) bonds of several metal-coordinated systems. The tetrahedral arrangement was selected to represent the liquid water, because it is comparable to the local coordination of the water molecule at room temperature.67 Results show that the stretching mode of the same type of Me–O(H2O) bond varies according to the coordinated metal system. Values are lower in the metal complex within the MCS (metal complex) than in free metal in aqueous phase (metal hexaquo). In addition, considering the binding energy per water molecule of the free metal and metal-bound MCS to water molecules, the Me–O(H2O) is weaker when the metal is in complex with the protein. Results shows that the O–H(H2O) stretching wavenumber is also lower when the coordinated water molecule forms part of the first coordination shell of the metal within the MCS than when it is coordinated to free metal ion in the aqueous phase.
Table 8. Stretching Frequencies of the Me–O(H2O) Coordination Bond and O–H Bond from Water Molecules of Several Hydrogen Bonded Systems at Aqueous Phase.
| complex | wavenumber (cm–1) |
|---|---|
| (Zn complex) Zn–O(H2O) | 271 |
| (Fe complex) Fe–O(H2O) | 279 |
| (Mn complex) Mn–O(H2O) | 258 |
| (Zn hexaquo) Zn–O(H2O)a | 331 |
| (Fe hexaquo) Fe–O(H2O)a | 352 |
| (Mn hexaquo) Mn–O(H2O)a | 320 |
| (Zn complex) O–H(H2O)b | 3428 |
| (Fe complex) O–H(H2O)b | 3416 |
| (Mn complex) O–H(H2O)b | 3438 |
| (Zn hexaquo) O–H(H2O)c | 3833 |
| (Fe hexaquo) O–H(H2O)c | 3823 |
| (Mn hexaquo) O–H(H2O)c | 3822 |
| (tetrahedral water) O–H(H2O)b | 3450 |
Experimental stretching mode of Me–-O(H2O) from fully hydrated metal ions: [Zn(H2O)6]SO4·H2O, 364 cm–1; [Fe(H2O)6]SiF6, 384 cm–1; [Mn(H2O)6]SiF6, 395 cm–1.36
Hydrogen bonded OH.
Free OH.
Table 9 shows the force constant of Me–O(H2O) and O–H(H2O) bonds for all metal-coordinated systems. Results show that Me–O(H2O) is tighter when the metal is in free solution than when it is within the MCS. The Me–O(H2O) bond force constant decreases as Fe–O(H2O) > Zn–O(H2O) > Mn–O(H2O). This trend responds to the partial ionic character of the Me–O(H2O) bond in the metal–PZAse complex. Results suggest that water molecules are more labile when they are coordinated with the protein, which could facilitate the enzymatic reaction. In addition, the Me–O(H2O) bond is weaker when the metal is coordinated with PZAse instead of with only water molecules. Studies have found the presence of rigid water molecules at the active site during electrostatic environment changes.85 It has been suggested that water dipole at the active site favors the enzymatic reaction by the preorganized electrostatic maintenance.85 Results show that the O–H bond of the water molecule is tighter when the water molecule fully coordinates the metal ion than when it completes the first hydration shell of the metal within the MCS. It suggests that the protein provides the environment to favor the deprotonation of the metal-bound water molecule at neutral pH. However, the metal-bound hydroxide generation should be part of further events such as the strong basic residue interaction. In addition, the difference in the O–H stretching mode allows us to identify the hydrogen bonded system. The O–H bond strength is lower when the water molecule forms one hydrogen bond and one coordination bond than when it forms four hydrogen bonds in liquid [water tetrahedral 549.20 ± 47.60 kcal/(mol·Å2)].
Table 9. Average Me–O(H2O) and O–H Bond Force Constantsa of the Metal Coordination Site of PZAse (Me at the MCS) and Fully Hydrated Metal Ions (Hexaquo Me) at Aqueous Phase.
| bond | Me at the MCS | hexaquo Me |
|---|---|---|
| Zn–O(H2O) | 15.13 ± 0.18 | 40.59 ± 3.71 |
| Fe–O(H2O) | 19.12 ± 1.21 | 45.09 ± 2.72 |
| Mn–O(H2O) | 11.91 ± 0.39 | 37.69 ± 0.82 |
| O–H(H2O) in Zn complex | 529.46 ± 60.56 | 578.98 ± 6.54 |
| O–H(H2O) in Fe complex | 524.95 ± 64.85 | 589.03 ± 2.12 |
| O–H(H2O) in Mn complex | 530.49 ± 59.25 | 589.21 ± 1.73 |
Force constant values in kcal/(mol·Å2).
Study of the HOH bending mode of water molecule is important as the OH stretching. The analysis of the HOH bending vibration represents an important gateway for transferring intramolecular energy trough the hydrogen bond network.68 Table 10 shows the wavenumber values of the HOH bending of water from liquid bulk, fully hydrated metal ion, and metal complex (metal within M. tuberculosis PZAse MCS). Results show that ligands from protein favor the decrease of the vibrational energy of the HOH bending mode, because the stretching of the C=O(Asp) is coupled to the HOH bending of coordinated water molecules. Finally, some energy is transferred between Asp and coordinated water molecules.
Table 10. HOH Bending of Coordinated Water of Several Systems in the Aqueous Phase.
| complex | wavenumber (cm–1) |
|---|---|
| (Zn complex) HOH | 1619 |
| (Fe complex) HOH | 1611 |
| (Mn complex) HOH | 1615 |
| (Zn hexaquo) HOH | 1637 |
| (Fe hexaquo) HOH | 1643 |
| (Mn hexaquo) HOH | 1627 |
| tetrahedral water | 1677 |
Table 11 shows the stretching mode wavenumber of particular bonds of the ligands. Results show that the stretching mode of C=O(Asp) and C=N(His) varies when the metal ion is within the MCS. The coordination of different metal ions causes specific effect on some stretching bonds in ligands. In general, after metal complexation some bonds from the MCS amino acids become tighter. Shift on the C=O and C=N bands toward higher wavenumber indicates metal coordination. Fe2+ complexation causes a small effect over the C=O(Asp) and C=N(His) in comparison to Zn2+ and Mn2+. The hydrogen bond between Asp to each coordinated water molecule decreases the electron density in the C=O bond. Thus, the hydrogen bond increases the covalent character of C=O (Asp). There is a linear correlation between the partial charge of the coordinated metal and the stretching of C=O from Asp49. The C=O stretching decreases as Zn complex (Zn charge 0.993) > Mn complex (Mn charge 0.801) > Fe complex (Fe charge 0.664). The highest shift on IR bands corresponds to the νC=N bond from histidine residue. It means that it is possible to track the coordination by measuring the stretching mode of the C=N bond.
Table 11. Wavenumber Valuesa of Selected Bonds from the PZAse MCS in the Aqueous Phase.
| complex | νC=O (Asp–1) | νC=N (His) |
|---|---|---|
| Zn complex | 1619 | 1546 |
| Fe complex | 1611 | 1540 |
| Mn complex | 1615 | 1543 |
| proteinb | 1732–1763 | 1617 |
Wavenumber in cm–1.
Experimental values of stretching modes of amino acids in protein in the aqueous phase.33
Studies have shown that a high mobility/disorder at the catalytic site might be detrimental. The hypothesis is that catalytic residues are immobilized to protect the delicate arrangement of functional groups.86 It suggests that metal complexation favors the needed rigidity of the PZAse active site.
4. Conclusions
The Zn2+, Fe2+, and Mn2+ transition metal ions form an octahedral complex with M. tuberculosis PZAse MCS. Structurally, the replacement of metal ions does not cause severe structural changes. However, there is an important charge distribution change. The O–H bond of the two coordinated water molecules is highly polarized when Zn2+ or Mn2+ is coordinated with the PZAse MCS. This report suggests that M. tuberculosis PZAse is more feasible to coordinate Zn2+ than Fe2+ and Mn2+. One possible explanation about the driving force to coordinate preferentially Zn2+ with metal-depleted M. tuberculosis PZAse is the highest affinity of the metal ion to the MCS amino acids. Metal complexation affects also the MCS flexibility, for instance, coordination bonds of the Fe complex are stronger in comparison to their counterparts. However, interestingly, the metal within the MCS does not diminish the water lability, because the Me—O(H2O) bond force constant is actually higher when the metal is free in solution than when it is within the MCS. The vibrational coupling between the C=O(Asp49) and O—H(H2O) stretching modes could be considered a proton shuttle. Results suggest that deprotonation of the water molecule is favored by the specific metal complexation within PZAse due to the effect of polarization on the OH bond. Further events such as a strong basic molecule interaction could finally deprotonate the coordinated water molecule. Thus, the water deprotonation could be part of serial events. IR spectroscopy is used as a tool to study the coordination event over the PZAse MCS, in which the C=N (His) stretching is the most responsive mode to identify the coordination of metal ions. Movement of water could be also identified due to the OH stretching difference of the water in bulk and the coordinated water molecules within the metal-bound protein and free metal in solution. Zn possesses the best affinity for the coordination site, and has the capacity for maximum OH polarization of coordinated water molecules. The water OH energization being crucial for the functional activity of PZAse (hydrolysis of PZA in POA) suggests that Zn is very important from a functional point of view.
Acknowledgments
This research was funded by the National Institute of Allergy and Infectious Diseases, National Institutes of Health US, under the terms of Award 1R01TW008669-01. P.S. and M.Z. were supported by TMRC New Tools to Understand and Control Endemic Parasites # 1 P01 AI51976 and Global Research Training Grant # 3 D43 TW006581. Analysis of the hydrophobic index was performed with the UCSF Chimera package. Chimera is developed by the Resource for Biocomputing, Visualization, and Informatics at the University of California, San Francisco (supported by NIGMS P41-GM103311). J.M.S. acknowledges the high performance computing support provided by the Texas A&M Supercomputer Facility and the Texas Advanced Computing Center as well as support from the Lanatter and Herb Fox Professorship.
Author Contributions
§ These authors contributed equally to this work.
The authors declare no competing financial interest.
Funding Statement
National Institutes of Health, United States
References
- Dahms S. O.; Könnig I.; Roeser D.; Gührs K.-H.; Mayer M. C.; Kaden D.; Multhaup G.; Than M. E. Metal Binding Dictates Conformation and Function of the Amyloid Precursor Protein (APP) E2 Domain. J. Mol. Biol. 2012, 4163438–452. [DOI] [PubMed] [Google Scholar]
- Carrell A. B.; Shimoni L.; Carrell C. J.; Bock C. W.; Murray-Rust P.; Glusker J. P. The stereochemistry of the recognition of nitrogen-containing heterocycles by hydrogen bonding and by metal ions. Receptor 1993, 3157–76. [PubMed] [Google Scholar]
- Guengerich F. P. Thematic minireview series: metals in biology 2013. J. Biol. Chem. 2013, 2881913164. [DOI] [PMC free article] [PubMed] [Google Scholar]
- Rowlett R. S. Structure and catalytic mechanism of the β-carbonic anhydrases. Biochimica et Biophysica Acta (BBA) - Proteins and Proteomics 2010, 18042362–373. [DOI] [PubMed] [Google Scholar]
- Zheng P.; Chou C.-C.; Guo Y.; Wang Y.; Li H. Single Molecule Force Spectroscopy Reveals the Molecular Mechanical Anisotropy of the FeS4Metal Center in Rubredoxin. J. Am. Chem. Soc. 2013, 1354717783–17792. [DOI] [PubMed] [Google Scholar]
- Luo Y.; Niu S.; Ichiye T. Understanding Rubredoxin Redox Sites by Density Functional Theory Studies of Analogues. J. Phys. Chem. A 2012, 116358918–8924. [DOI] [PMC free article] [PubMed] [Google Scholar]
- Leferink N. G. H.; Pudney C. R.; Brenner S.; Heyes D. J.; Eady R. R.; Samar Hasnain S.; Hay S.; Rigby S. E. J.; Scrutton N. S. Gating mechanisms for biological electron transfer: Integrating structure with biophysics reveals the nature of redox control in cytochrome P450 reductase and copper-dependent nitrite reductase. FEBS Lett. 2012, 5865578–584. [DOI] [PubMed] [Google Scholar]
- Lee H.-m.; Das T. K.; Rousseau D. L.; Mills D.; Ferguson-Miller S.; Gennis R. B. Mutations in the Putative H-Channel in the Cytochrome c Oxidase from Rhodobacter sphaeroides Show That This Channel Is Not Important for Proton Conduction but Reveal Modulation of the Properties of Heme a†. Biochemistry 2000, 39112989–2996. [DOI] [PubMed] [Google Scholar]
- Ricoux R.; Allard M.; Dubuc R.; Dupont C.; Marechal J.-D.; Mahy J.-P. Selective oxidation of aromatic sulfide catalyzed by an artificial metalloenzyme: new activity of hemozymes. Org. Biomol. Chem. 2009, 7163208–3211. [DOI] [PubMed] [Google Scholar]
- Shelnutt J. A. Correlation between metal stability, charge transfer, and Raman frequencies in metalloporphyrins and their π-π complexes. J. Am. Chem. Soc. 1983, 1054774–778. [Google Scholar]
- Borreguero J. M.; He J.; Meilleur F.; Weiss K. L.; Brown C. M.; Myles D. A.; Herwig K. W.; Agarwal P. K. Redox-Promoting Protein Motions in Rubredoxin. J. Phys. Chem. B 2011, 115288925–8936. [DOI] [PubMed] [Google Scholar]
- Jha S. K.; Ji M.; Gaffney K. J.; Boxer S. G. Direct measurement of the protein response to an electrostatic perturbation that mimics the catalytic cycle in ketosteroid isomerase. Proc. Natl. Acad. Sci. U. S. A. 2011, 1084016612–16617. [DOI] [PMC free article] [PubMed] [Google Scholar]
- Moura I.; Pauleta S.; Moura J. G. Enzymatic activity mastered by altering metal coordination spheres. J. Biol. Inorg. Chem. 2008, 1381185–1195. [DOI] [PubMed] [Google Scholar]
- Carrell C. J.; Carrell H. L.; Erlebacher J.; Glusker J. P. Structural aspects of metal ion carboxylate interactions. J. Am. Chem. Soc. 1988, 110268651–8656. [Google Scholar]
- Kovalevsky A. Y.; Hanson L.; Fisher S. Z.; Mustyakimov M.; Mason S. A.; Forsyth V. T.; Blakeley M. P.; Keen D. A.; Wagner T.; Carrell H. L.; et al. Metal ion roles and the movement of hydrogen during reaction catalyzed by D-xylose isomerase: a joint x-ray and neutron diffraction study. Structure 2010, 186688–99. [DOI] [PMC free article] [PubMed] [Google Scholar]
- Bloom B. R.; Murray C. J. Tuberculosis: commentary on a reemergent killer. Science 1992, 25750731055–64. [DOI] [PubMed] [Google Scholar]
- WHO. Management of chronic and multidrug-resistant cases. In Treatment of tuberculosis: Guidelines for national programmes, third ed.; Jotto Associati s.a.s.- Biella-Italy: Geneva, 2003; pp 43–45. [Google Scholar]
- Konno K.; Feldmann F. M.; McDermott W. Pyrazinamide susceptibility and amidase activity of tubercle bacilli. Am. Rev. Respir. Dis. 1967, 953461–9. [DOI] [PubMed] [Google Scholar]
- Mitchison D. A. The action of antituberculosis drugs in short-course chemotherapy. Tubercle 1985, 663219–25. [DOI] [PubMed] [Google Scholar]
- Steele M. A.; Des Prez R. M. The role of pyrazinamide in tuberculosis chemotherapy. Chest 1988, 944845–50. [DOI] [PubMed] [Google Scholar]
- Scorpio A.; Lindholm-Levy P.; Heifets L.; Gilman R.; Siddiqi S.; Cynamon M.; Zhang Y. Characterization of pncA mutations in pyrazinamide-resistant Mycobacterium tuberculosis. Antimicrob. Agents Chemother. 1997, 413540–3. [DOI] [PMC free article] [PubMed] [Google Scholar]
- Zhang Y.; Wade M. M.; Scorpio A.; Zhang H.; Sun Z. Mode of action of pyrazinamide: disruption of Mycobacterium tuberculosis membrane transport and energetics by pyrazinoic acid. J. Antimicrob. Chemother. 2003, 525790–5. [DOI] [PubMed] [Google Scholar]
- Petrella S.; Gelus-Ziental N.; Maudry A.; Laurans C.; Boudjelloul R.; Sougakoff W. Crystal structure of the pyrazinamidase of Mycobacterium tuberculosis: insights into natural and acquired resistance to pyrazinamide. PLoS One 2011, 61e15785. [DOI] [PMC free article] [PubMed] [Google Scholar]
- Sheen P.; Ferrer P.; Gilman R. H.; Christiansen G.; Moreno-Roman P.; Gutierrez A. H.; Sotelo J.; Evangelista W.; Fuentes P.; Rueda D.; et al. Role of metal ions on the activity of Mycobacterium tuberculosis pyrazinamidase. Am. J. Trop Med. Hyg 2012, 871153–61. [DOI] [PMC free article] [PubMed] [Google Scholar]
- Zhang H.; Deng J. Y.; Bi L. J.; Zhou Y. F.; Zhang Z. P.; Zhang C. G.; Zhang Y.; Zhang X. E. Characterization of Mycobacterium tuberculosis nicotinamidase/pyrazinamidase. FEBS J. 2008, 2754753–62. [DOI] [PubMed] [Google Scholar]
- Du X.; Wang W.; Kim R.; Yakota H.; Nguyen H.; Kim S.-H. Crystal Structure and Mechanism of Catalysis of a Pyrazinamidase from Pyrococcus horikoshii. Biochemistry 2001, 404714166–14172. [DOI] [PubMed] [Google Scholar]
- Choi J.-H.; Raleigh D.; Cho M. Azido Homoalanine is a Useful Infrared Probe for Monitoring Local Electrostatistics and Side-Chain Solvation in Proteins. J. Phys. Chem. Lett. 2011, 2172158–2162. [DOI] [PMC free article] [PubMed] [Google Scholar]
- Fafarman A. T.; Sigala P. A.; Herschlag D.; Boxer S. G. Decomposition of vibrational shifts of nitriles into electrostatic and hydrogen-bonding effects. J. Am. Chem. Soc. 2010, 1323712811–3. [DOI] [PMC free article] [PubMed] [Google Scholar]
- la Cour Jansen T.; Knoester J. A transferable electrostatic map for solvation effects on amide I vibrations and its application to linear and two-dimensional spectroscopy. J. Chem. Phys. 2006, 1244044502. [DOI] [PubMed] [Google Scholar]
- Thielges M. C.; Fayer M. D. Protein dynamics studied with ultrafast two-dimensional infrared vibrational echo spectroscopy. Acc. Chem. Res. 2012, 45111866–74. [DOI] [PMC free article] [PubMed] [Google Scholar]
- Chung J. K.; Thielges M. C.; Fayer M. D. Dynamics of the folded and unfolded villin headpiece (HP35) measured with ultrafast 2D IR vibrational echo spectroscopy. Proc. Natl. Acad. Sci. U. S. A. 2011, 10893578–3583. [DOI] [PMC free article] [PubMed] [Google Scholar]
- Kötting C.; Suveyzdis Y.; Bojja R. S.; Metzler-Nolte N.; Gerwert K. Label-free screening of drug–protein interactions by time-resolved fourier transform infrared spectroscopic assays exemplified by ras interactions. Appl. Spectrosc. 2010, 649967–972. [DOI] [PubMed] [Google Scholar]
- Barth A. The infrared absorption of amino acid side chains. Prog. Biophys. Mol. Biol. 2000, 743–5141–173. [DOI] [PubMed] [Google Scholar]
- Hehre W. J. Ab initio molecular orbital theory. Acc. Chem. Res. 1976, 911399–406. [Google Scholar]
- Kleifeld O.; Frenkel A.; Martin J. M.; Sagi I. Active site electronic structure and dynamics during metalloenzyme catalysis. Nat. Struct. Biol. 2003, 10298–103. [DOI] [PubMed] [Google Scholar]
- Nakamoto K.Infrared and Raman spectra of inorganic and coordination compounds, 6th ed.; Wiley: Hoboken, NJ, 2009. [Google Scholar]
- Rieff B.; Bauer S.; Mathias G.; Tavan P. IR spectra of flavins in solution: DFT/MM description of redox effects. J. Phys. Chem. B 2011, 11592117–23. [DOI] [PubMed] [Google Scholar]
- Spillebout F.; Bégué D.; Baraille I.; Shaw J. M.. On Discerning Intermolecular and Intramolecular Vibrations in Experimental Acene Spectra. Energy Fuels 2014. [Google Scholar]
- Sheen P.; Ferrer P.; Gilman R. H.; Lopez-Llano J.; Fuentes P.; Valencia E.; Zimic M. J. Effect of pyrazinamidase activity on pyrazinamide resistance in Mycobacterium tuberculosis. Tuberculosis (Edinb) 2009, 892109–13. [DOI] [PMC free article] [PubMed] [Google Scholar]
- Zimic M.; Sheen P.; Quiliano M.; Gutierrez A.; Gilman R. H. Peruvian and globally reported amino acid substitutions on the Mycobacterium tuberculosis pyrazinamidase suggest a conserved pattern of mutations associated to pyrazinamide resistance. Infect. Genet. Evol. 2010, 102346–9. [DOI] [PMC free article] [PubMed] [Google Scholar]
- Hohenberg P. Inhomogeneous Electron Gas. Phys. Rev. 1964, 1363BB864–B871. [Google Scholar]
- Kohn W.; Sham L. J. Self-Consistent Equations Including Exchange and Correlation Effects. Phys. Rev. 1965, 1404AA1133–A1138. [Google Scholar]
- Siegbahn P. E.; Blomberg M. R. Transition-metal systems in biochemistry studied by high-accuracy quantum chemical methods. Chem. Rev. 2000, 1002421–438. [DOI] [PubMed] [Google Scholar]
- Bühl M.; Reimann C.; Pantazis D. A.; Bredow T.; Neese F. Geometries of third-row transition-metal complexes from density-functional theory. J. Chem. Theory Comput. 2008, 491449–1459. [DOI] [PubMed] [Google Scholar]
- Lo H. C.; Iron M. A.; Martin J. M. L.; Keinan E. Proton Walk in the Aqueous Platinum Complex [TpPtMeCO] via a Sticky σ-Methane Ligand. Chem.—Eur. J. 2007, 13102812–2823. [DOI] [PubMed] [Google Scholar]
- Lai W.; Yao J.; Shaik S.; Chen H. Which Density Functional Is the Best in Computing C–H Activation Energies by Pincer Complexes of Late Platinum Group Metals?. J. Chem. Theory Comput. 2012, 892991–2996. [DOI] [PubMed] [Google Scholar]
- Becke A. D. Density-functional thermochemistry. III. The role of exact exchange. J. Chem. Phys. 1993, 9875648. [Google Scholar]
- Perdew J. P.; Wang Y. Accurate and simple analytic representation of the electron-gas correlation energy. Phys. Rev. B 1992, 452313244–13249. [DOI] [PubMed] [Google Scholar]
- Hehre W. J. Self-Consistent Molecular-Orbital Methods. I. Use of Gaussian Expansions of Slater-Type Atomic Orbitals. J. Chem. Phys. 1969, 5162657. [Google Scholar]
- Couty M.; Hall M. B. Basis sets for transition metals: Optimized outerp functions. J. Comput. Chem. 1996, 17111359–1370. [DOI] [PubMed] [Google Scholar]
- Balbuena P. B.; Calvo S. R.; Lamas E. J.; Salazar P. F.; Seminario J. M. Adsorption and Dissociation of H2O2 on Pt and Pt-alloy clusters and surfaces. J. Phys. Chem. B 2006, 110, 17452–17459. [DOI] [PubMed] [Google Scholar]
- Seminario J. M.; Zacarias A. G.; Castro M. Systematic Study of the Lowest Energy States of Pd, Pd2, and Pd3. Int. J. Quantum Chem. 1997, 61, 515–523. [Google Scholar]
- Seminario J. M.; Tour J. M. Systematic Study of the Lowest Energy States of Aun (n=1–4) Using DFT. Int. J. Quantum Chem. 1997, 65, 749–758. [Google Scholar]
- Rangel N. L.; Sotelo J. C.; Seminario J. M. Mechanism of carbon-nanotubes unzipping into graphene ribbons. J. Chem. Phys. 2009, 131, 031105:1–4. [DOI] [PubMed] [Google Scholar]
- Sotelo J. C.; Yan L.; Wang M.; Seminario J. M. Field Induced Conformational Changes in Bimetallic Oligoaniline Junctions. Phys. Rev. A 2007, 752022511.(13 pages).. [Google Scholar]
- Yan L.; Seminario J. M. Electron Transport in Nano-Gold--Silicon Interfaces. Int. J. Quantum Chem. 2007, 1072440–450. [Google Scholar]
- Tomasi J.; Mennucci B.; Cancès E. The IEF version of the PCM solvation method: an overview of a new method addressed to study molecular solutes at the QM ab initio level. J. Mol. Struct.: THEOCHEM 1999, 4641–3211–226. [Google Scholar]
- Jalkanen K. J.; Degtyarenko I. M.; Nieminen R. M.; Cao X.; Nafie L. A.; Zhu F.; Barron L. D. Role of hydration in determining the structure and vibrational spectra of L-alanine and N-acetyl L-alanine N′-methylamide in aqueous solution: a combined theoretical and experimental approach. Theor. Chem. Acc. 2008, 1191–3191–210. [Google Scholar]
- Mulliken R. S. Electronic Population Analysis on LCAO–MO Molecular Wave Functions. I. J. Chem. Phys. 1955, 23101833–1840. [Google Scholar]
- Sato H.; Yamagishi A. VCD Studies on Chiral Characters of Metal Complex Oligomers. Int. J. Mol. Sci. 2013, 141964–78. [DOI] [PMC free article] [PubMed] [Google Scholar]
- Cornilsen B. C.; Nakamoto K. Metal isotope effect on metal-ligand vibrations—XII: Imidazole complexes with Co(II), Ni(II), Cu(II) and Zn(II). J. Inorg. Nucl. Chem. 1974, 36112467–2471. [Google Scholar]
- Hodgson J. B.; Percy G. C.; Thornton D. A. The infrared spectra of imidazole complexes of first transition series metal(ii) nitrates and perchlorates. J. Mol. Struct. 1980, 66081–92. [Google Scholar]
- Niven M. L.; Thornton D. A. The infrared spectra of trans-bis(glycinato)zinc(II) monohydrate and its isotopically labelled analogues: Assignments, structure and bonding. J. Mol. Struct. 1979, 5501–6. [Google Scholar]
- Massabni A. C.; Corbi P. P.; Melnikov P.; Zacharias M. A.; Rechenberg H. R. Four new metal complexes with the amino acid deoxyalliin. J. Braz. Chem. Soc. 2005, 16, 718–722. [Google Scholar]
- Mrozek R.; Rza̧czyńska Z.; Sikorska-Iwan M.; Jaroniec M.; Głowiak T. A new complex of manganese(II) with l-α-alanine: structure, spectroscopy and thermal study. Polyhedron 1999, 18172321–2326. [Google Scholar]
- Marenich A. V.; Cramer C. J.; Truhlar D. G. Universal Solvation Model Based on Solute Electron Density and on a Continuum Model of the Solvent Defined by the Bulk Dielectric Constant and Atomic Surface Tensions. J. Phys. Chem. B 2009, 113186378–6396. [DOI] [PubMed] [Google Scholar]
- Hu Y.; Ma H.-X.; Li J.-F.; Gao R.; Song J.-R. Density Functional Theoretical Study on Intermolecular Interactions of 3,6-Dihydrazino-1,2,4,5-tetrazine Dimers. Bull. Korean Chem. Soc. 2010, 31102897–2902. [Google Scholar]
- Boys S. F.; Bernardi F. The calculation of small molecular interactions by the differences of separate total energies. Some procedures with reduced errors. Mol. Phys. 1970, 194553–566. [Google Scholar]
- Grimme S.; Antony J.; Ehrlich S.; Krieg H. A consistent and accurate ab initio parametrization of density functional dispersion correction (DFT-D) for the 94 elements H-Pu. J. Chem. Phys. 2010, 13215154104. [DOI] [PubMed] [Google Scholar]
- Frisch M. J.; Trucks G. W.; Schlegel H. B.; Scuseria G. E.; Robb M. A.; Cheeseman J. R.; Scalmani G.; Barone V.; Mennucci B.; Petersson G. A.; et al. Gaussian 09, Revision A.02; Gaussian Inc.: Wallingford, CT, 2009. [Google Scholar]
- Neeman A.Jmol: 3D viewer for chemical structures in 3D. 2011.
- Pettersen E. F.; Goddard T. D.; Huang C. C.; Couch G. S.; Greenblatt D. M.; Meng E. C.; Ferrin T. E. UCSF Chimera--a visualization system for exploratory research and analysis. J. Comput. Chem. 2004, 25131605–12. [DOI] [PubMed] [Google Scholar]
- Humphrey W.; Dalke A.; Schulten K. VMD: visual molecular dynamics. J. Mol. Graph 1996, 14133–8, 27–8.. [DOI] [PubMed] [Google Scholar]
- Seminario J. M. Calculation of intramolecular force fields from second-derivative tensors. Int. J. Quantum Chem. 1996, 6071271–1277. [Google Scholar]
- Reyes L. H.; Seminario J. M. Determination of precise harmonic force constants for alanine polypeptides. J. Mol. Struct.: THEOCHEM 2007, 8181–3125–129. [Google Scholar]
- Cauet E.; Bogatko S.; Weare J. H.; Fulton J. L.; Schenter G. K.; Bylaska E. J. Structure and dynamics of the hydration shells of the Zn(2+) ion from ab initio molecular dynamics and combined ab initio and classical molecular dynamics simulations. J. Chem. Phys. 2010, 13219194502. [DOI] [PubMed] [Google Scholar]
- Mohammed A. M. Hydration structure and water exchange dynamics of Fe(II) ion in aqueous solution. Bull. Chem. Soc. Ethiopia 2010, 24212. [Google Scholar]
- Duncombe B. J.; Ryden J. O.; Puskar L.; Cox H.; Stace A. J. A gas-phase study of the preferential solvation of Mn(2+) in mixed water/methanol clusters. J. Am. Soc. Mass Spectrom. 2008, 194520–30. [DOI] [PubMed] [Google Scholar]
- Rudolph W. W.; Irmer G. Hydration and speciation studies of Mn2+ in aqueous solution with simple monovalent anions (ClO4-, NO3-, Cl-, Br-). Dalton Trans 2013, 424014460–72. [DOI] [PubMed] [Google Scholar]
- Tamames B.; Sousa S. F.; Tamames J.; Fernandes P. A.; Ramos M. J. Analysis of zinc-ligand bond lengths in metalloproteins: Trends and patterns. Proteins: Struct., Funct., Bioinf. 2007, 693466–475. [DOI] [PubMed] [Google Scholar]
- Dokmanić I.; Šikić M.; Tomić S. Metals in proteins: correlation between the metal-ion type, coordination number and the amino-acid residues involved in the coordination. Acta Crystallogr. Sect. D Biol. Crystallogr. 2008, 643257–263. [DOI] [PubMed] [Google Scholar]
- Housecroft C. E.; Sharpe A. G.. Inorganic chemistry, 2nd ed.; Pearson Prentice Hall: Upper Saddle River, NJ, 2005; p xxxvi, 949 pp. [Google Scholar]
- Parkin G. Synthetic analogues relevant to the structure and function of zinc enzymes. Chem. Rev. 2004, 1042699–767. [DOI] [PubMed] [Google Scholar]
- Morzyk-Ociepa B.; Kokot M.; Różycka-Sokołowska E.; Giełzak-Koćwin K.; Filip-Psurska B.; Wietrzyk J.; Michalska D. Crystal structure, infrared and EPR spectra and anticancer activity in vitro of the novel manganese(II) complexes of indolecarboxylic acids. Polyhedron 2014, 670464–470. [Google Scholar]
- Jha S. K.; Ji M.; Gaffney K. J.; Boxer S. G. Site-Specific Measurement of Water Dynamics in the Substrate Pocket of Ketosteroid Isomerase Using Time-Resolved Vibrational Spectroscopy. J. Phys. Chem. B 2012, 1163711414–11421. [DOI] [PMC free article] [PubMed] [Google Scholar]
- Yang L.-W.; Bahar I. Coupling between catalytic site and collective dynamics: a requirement for mechanochemical activity of enzymes. Structure 2005, 136893–904. [DOI] [PMC free article] [PubMed] [Google Scholar]