Abstract
Surface topography has significant influence on good and fast osseointegration of biomedical implants. In this work, ultrasonic shot peening was conducted to modify titanium to produce nanograined (NG) surface. Its ability to induce new bone formation was evaluated using an in vivo animal model. We demonstrated that the NG surface enhanced osteoblast adhesion, proliferation, differentiation, and mineralization in in vitro experiments compared to coarse-grained titanium surface. Push-out test, histological observations, fluorescent labeling, and histomorphometrical analysis consistently indicated that the NG surfaces developed have the higher osseointegration than coarse-grained surfaces. Those results suggest that ultrasonic shot peening has the potential for future use as a surface modification method in biomedical application.
Keywords: ultrasonic shot peening, titanium, in vivo, osseointegeration
Introduction
Successful integration of orthopedic implants with the host bone needs initial stability supported by enough bone stock as well as rapid osseointegration. It has been proved that the osseointegration between bone tissue and materials is determined by materials’ surface properties, such as grain size, chemical composition, and roughness.1–4 In recent years, nanograined (NG) materials have attracted an increased interest due to their excellent biological properties compared to coarse-grained (CG) materials.5,6 Researchers have shown that the NG materials are effective in improving the osseointegration between bone-forming cell and material surface since they have a similar topography scale with bone, which is also a nanostructured material mainly composed of collagen fibrils with a diameter of 20–80 nm and hydroxyapatite nanocrystals.7,8 Webster and Ejiofor9 demonstrated that the NG metal compacts such as Ti, Ti6Al4V, and CoCrMo fabricated by traditional powder metallurgy procedures improved osteoblast adhesion, while NG ceramic compacts such as alumina, titania, and hydroxyapatite produced by sintering promoted in vitro osteoblast adhesion and proliferation compared to their respective CG compacts.10 Osteoblast mineralization was improved on NG surface (20–40 nm in grain size) of Ti6Al4V alloy.11 Additionally, Faghihi et al12 reported that a nanostructured titanium (Ti) with grain size of 10–50 nm fabricated by high-pressure torsion notably enhanced the attachment and activity of preosteoblasts compared to the CG one.
Conventionally, the NG materials or surfaces can be created by many ways such as ultrasonic shot peening (USP), severe plastic deformation (SPD), and electrodeposition.13–15 Among these techniques, USP method has drawn a lot of attention since it is a one-step method that does not change the chemical compositions of the substrate and is capable of avoiding the bonding issue between the coated layer and the matrix induced by other methods. Jindal et al16 produced NG titanium with an average grain size of 14–20 nm by USP and observed that cell proliferation was enhanced to approximately 50% as compared with unshot peened material. However, the adhesion, morphology, spread, ALP (alkaline phosphatase) activity, mineralization, and in vivo ossteointegration between osteoblasts and NG surface fabricated by USP remain to be elucidated. Therefore, in this study, we fabricated NG surfaces by USP, and a systematic research was carried out to demonstrate the interaction between osteoblasts and NG surfaces. Our study will provide better insight to the design of titanium-based implants.
Materials and methods
Specimen preparation
The principle of the USP is based on the vibration of spherical shots with sufficient hardness stroked onto the substrate surface using a high power ultrasound. Each shot striking the metal surface serves as a tiny peening hammer, leading to SPD and formation of nanostructure on the metal surface. The main parameters of the USP process were chosen as follows: the vibration frequency of the chamber driven by ultrasonic generator is 50 kHz; the shot diameter is 3 mm; and the processing durations are 30 minutes.
Pure Ti was machined to disks with a diameter of 10 mm and a thickness of 5 mm. The surfaces of the disks were ground using a series of water-resistant emery papers with various degrees of coarseness up to 1,200 grits, and the polished surface, which was subjected to USP was labeled USP-Ti. The pure Ti was used as control. All disks were rinsed with distilled and deionized (Milli-Q) water and sterilized in an autoclave prior to cell culture.
Surface characterization
The morphology of the surface was imaged by field emission scanning electron microscopy (FESEM; NOVA NanoSEM, FEI Co., Hillsboro, OR, USA). The X-ray diffraction (XRD) analysis of the USP surface layer was performed on a Rigaku D/max 2400 X-ray diffractometer (Rigaku, Tokyo, Japan), with Cu Kα radiation, in the step-scanning mode. The average crystallite size was calculated from XRD line broadening.17 The surface roughness (Ra) was determined using atomic force microscopy (AFM; Nanoscope 3, Bruker Corporation, Karlsruhe, Germany). The contact angle was measured using a video contact-angle measurement system.
Cell culture
MG63 cells (Cell Bank of the Chinese Science Academy, Shanghai, People’s Republic of China) were cultured in Dulbecco’s Modified Eagle’s Medium (DMEM) containing 10% FBS (Fetal Bovine Serum, Gibco® = product line of Thermo Fisher Scientific, Waltham, MA, USA) and 1% penicillin/streptomycin at 37°C in an atmosphere containing 5% CO2 and 95% humidity. The cells were cultured in osteogenic media (the regular media supplemented with 10 mM β-glycerophosphate, 0.2 mM ascorbic acid, and 10−8 M dexamethasone [Sigma-Aldrich, St Louis, MO, USA]) to study cell differentiation. The culture medium was replaced every 2 or 3 days. Confluent flasks were then subcultured using trypsin/EDTA.
Cell adhesion
Osteoblasts were cultured on the samples at a density of 1×10⁴ cells/cm2. The nonadherent cells were rinsed with phosphate-buffered saline (PBS) after 4 hours. The adherent osteoblasts were fixed with 95% alcohol and stained with 4′,6′-diamidino-2-phenylindole (DAPI; Dojindo Laboratories, Kumamoto, Japan). The cells in five random fields were counted at low magnification under a fluorescence microscope (Leica DM400, Leica Microsystems, Buffalo Grove, IL, USA).
Cell morphology
The morphology and cytoskeletal arrangement of osteoblasts seeded onto the samples were examined by confocal laser scanning microscope (CLSM) and SEM after culturing for 12 hours.
The cells cultured on the samples were fixed with 2.5% glutaraldehyde in 0.1 M PBS buffer (pH =7.4) for 20 minutes, and rinsed three times with PBS. Then, each sample was dehydrated with graded alcohol (10%, 20%, 30%, 50%, 60%, 70%, 80%, 90%) and finally with absolutely pure ethyl alcohol, and the samples were dried for SEM analysis to enable the morphology of osteoblasts to be studied.
The cells were washed twice with PBS and fixed with 4% paraformaldehyde (Sigma-Aldrich). Then, they were permeabilized with 0.1% Triton-X for 1 hour. The cells were incubated for 1 hour with TRITC-conjugated phalloidin (Molecular Probes, Eugene, OR, USA) at room temperature in the dark. The final step was to stain the cell nuclei with DAPI (Dojindo Laboratories) for 10 minutes at room temperature. The cytoskeletal arrangement of the cells was obtained with a CLSM (LSM-510, Carl Zeiss, Jena, Germany).
Cell proliferation
Cell viability was measured with a colorimetric assay based on the conversion of the tetrazolium salt into a soluble formazan using a Cell Titer 96 Aqueous assay (MTS, Promega Corporation, Fitchburg, WI, USA). MG63 cells were seeded at a density of 1×10⁴ cells/cm2 on the samples and cultured for 1, 4, 8, and 16 days. At each time point, the samples were rinsed twice with sterile PBS and transferred to new 96-well tissue culture plates. Approximately 100 μL of prewarmed MTS solution mixed with 1 mL culture medium was added to each well. After 3 hours of further incubation, 100 μL of the working solution was transferred to a new 96-well culture plate, and the absorbance was measured using an ELISA (enzyme-linked immunosorbent assay) reader at 490 nm.
ALP activity
MG63 cells were seeded in 24-well plates at a density of 1×10⁴ cells/cm2 and then cultured for 4, 8, or 16 days. After the indicated incubation times, the samples were rinsed twice with PBS and the cells were lysed with 0.1% Triton X-100 (Sigma-Aldrich) using a standard freeze–thaw protocol. Approximately 100 μL of the cell lysate was mixed with 100 μL p-nitrophenyl phosphate (pNPP 1 mg/mL) in 1 M diethanolamine buffer (pH =9.8) containing 0.5 mM MgCl2 and incubated at 37°C for 30 minutes. The reaction was stopped by the addition of 50 μL of 0.2 M NaOH. Enzyme activity was quantified by measuring absorbance at 405 nm in an ELISA reader. Total protein content was assessed by a BCA (bicinchoninic acid) protein assay kit and calculated from a standard curve of bovine serum albumin standards. ALP activity was normalized to the total protein content.
Calcium deposition
Mineralization was detected using an Alizarin red staining method after culturing the cells onto the alloy samples for 8 or 16 days. The cells were washed twice in PBS, fixed with 4% paraformaldehyde for 30 minutes, and then stained with Alizarin red (40 mM, Sigma-Aldrich) for 20 minutes at room temperature. The resulting red matrix precipitate was desorbed with 10% cetylpyridinium chloride (Sigma-Aldrich), and color intensity was quantified at an absorbance of 590 nm using an ELISA reader.
Surgical procedures
A total of 12 adult male New Zealand White rabbits weighing 3.0–3.5 kg were used in this study. The animal procedures were approved by the Animal Care and Experiment Committee of Qilu Hospital of Shandong University. The surgical procedures were conducted as previously described.2 Briefly, under general anesthesia with pentobarbital (25 mg/kg) by intravenous injection, the intercondylar notch of the distal femur was exposed through a longitudinal skin incision. A hole with a diameter of 4.5 mm was made on the intercondylar notch of femur, and then the implants were inserted into the medullary cavities (Figure 1A).
Figure 1.
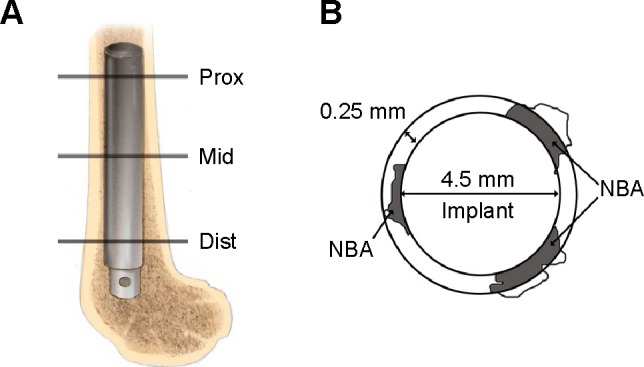
Schematic drawing of the position of the implant and the new bone area calculated around the implant.
Notes: (A) Schematic drawing of the distal femur of a rabbit. The implant was inserted into the medullary canal. Lines Prox, Mid, and Dist indicate the proximal, middle, and distal section levels, respectively, for histological evaluation. (B) Schematic representation of the NBA; gray area. The NBA was defined as the gray area within the ring around the implant.
Abbreviation: NBA, new bone area.
Sequential fluorescent labeling
The process of new bone formation was determined using a polychrome sequential fluorescent labeling method. Different fluorochromes were administered intraperitoneally with a sequence of tetracycline (30 mg/kg) and calcein (5 mg/kg) (Sigma-Aldrich) injected 14 and 3 days, respectively, before the animals were sacrificed.
Sample preparation
All animals were sacrificed at 12 weeks postoperation. The left femurs with implants were stored at −80°C for push-out test, and the right ones were fixed in acetone for Micro-CT assay and histomorphometric observation.
Pull-out test
The biomechanical test was performed using a testing machine (Instron 5569; Instron, Norwood, MA, USA). The pull-out test was performed within 12 hours after the animals were sacrificed. The maximum pull-out force was recorded at 12 weeks, and it was defined as the peak load values of the load – displacement curves.
Micro-CT assay
The fixed samples were detected and imaged using Micro-CT (SKYSCAN 1176, Bruker Corporation) to measure the newly formed bone around implants. After scanning, three-dimensional (3D) images were reconstructed with CTVol software (Skyscan Company, Kontich, Belgium). To assess the new bone formed around the implant, a region with a radius of 1 mm from implant surface within the bone marrow cavity was selected for analysis. Bone mineral density (BMD), bone volume fraction (Bone volume/total volume, BV/TV), trabecular thickness (Tb.Th), and trabecular number (Tb.N) of new bone were quantified.
Histological evaluation
The bone with the implant was fixed in acetone, dehydrated with a graded series of alcohols from 75% to absolute ethanol, and finally embedded in methyl methacrylate without decalcification. The embedded specimens were sectioned into 150 μm thick sections using a bone saw (Leica SP1600), with the blade placed perpendicular to the long axis of the implant at three levels (proximal, middle, and distal) of the femur (Figure 1A). Those sections were subsequently manually ground to a thickness of 40 μm for fluorescence labeling observation under the fluorescent microscope (Leica DMI6000B). Finally, the specimens were stained with 1% methylene blue, and the stained sections were observed using a Leica microscope (Leica DM400). The BAR (%, surface bone apposition ratio) and the NBA (mm2, new bone area) surrounding the implant were calculated to assess the osseointegration. The circumference of the implant was obtained to calculate the percentage of the surface that was in direct contact with the bone in each section, and the BAR was defined as the percentage of the implant surface in direct contact with the bone. The area of the new bone tissue was determined in a circumferential area within 0.25 mm from the rod surface (Figure 1B), and the NBA was examined by observing the methylene blue staining and labeling with tetracycline and calcein.
Statistical analysis
Statistical analyses were conducted using SPSS 16.0 (SPSS Inc., Chicago, IL, USA). The data were expressed as the means ± standard deviation. Differences between groups were analyzed using the Student’s t-test. P-values less than 0.05 were considered statistically significant.
Results
Surface characterization
The SEM micrograph of the USP-Ti surface is presented in Figure 2, and it is obvious that many pits can be seen on the surface of USP-Ti, and these are generated when the surface was struck by the spherical shots. The XRD pattern of USP-Ti is shown in Figure 3. The average size of the grains was in the range of 57–88 nm, with the method of Scherrer.18 The Ra of the Ti and USP-Ti samples determined by AFM (Figure 4) is summarized in Table 1, and the roughness of USP-Ti was found to be higher than that of Ti. The contact angles of the water droplets on Ti and USP-Ti are also listed in Table 1, indicating that USP-Ti surface exhibits better hydrophilicity than the Ti surface.
Figure 2.
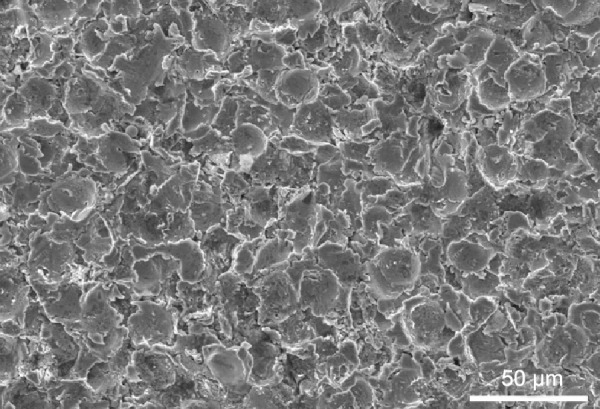
Representative SEM image of the USP-Ti surface.
Abbreviations: SEM, scanning electron microscope; Ti, titanium; USP-Ti, Ti surface subjected to USP; USP, ultrasonic shot peening.
Figure 3.
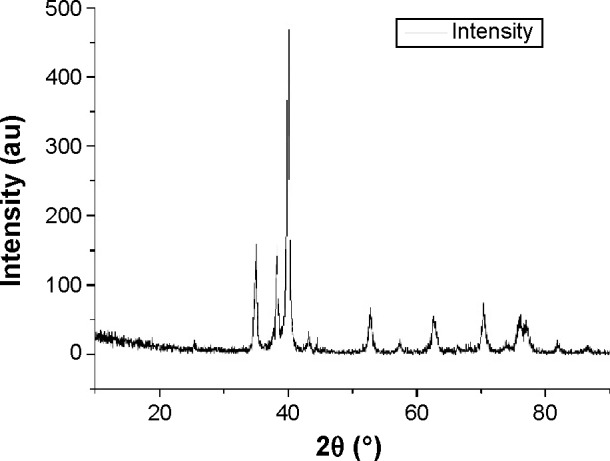
XRD patterns of the USP-Ti surface.
Abbreviations: Ti, titanium; XRD, X-ray diffraction; USP-Ti, Ti surface subjected to USP; USP, ultrasonic shot peening; au,.
Figure 4.
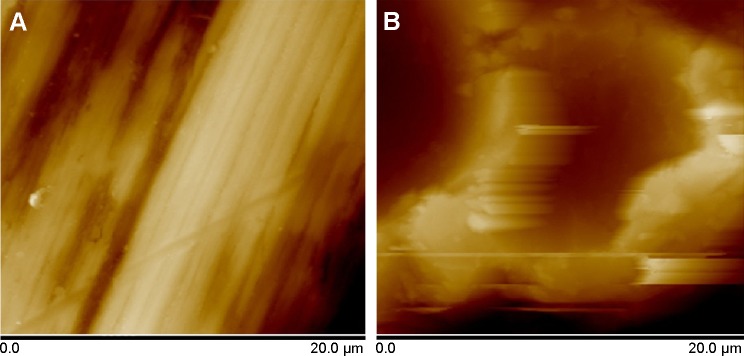
Representative AFM images of the surface (A) Ti and (B) USP-Ti.
Abbreviations: AFM, atomic force microscopy; Ti, titanium; USP-Ti, Ti surface subjected to USP; USP, ultrasonic shot peening.
Table 1.
Comparison among Ti, USP-Ti in terms of surface properties
| Ra (nm) | Contact angle (°) | |
|---|---|---|
| Ti | 185±49 | 66.8±2.6 |
| USP-Ti | 842±103 | 30.4±1.8 |
Note: Data are shown as the mean ± SD.
Abbreviations: USP-Ti, Ti surface subjected to USP; USP, ultrasonic shot peening; SD, standard deviation; Ti, titanium.
Cell adhesion and viability
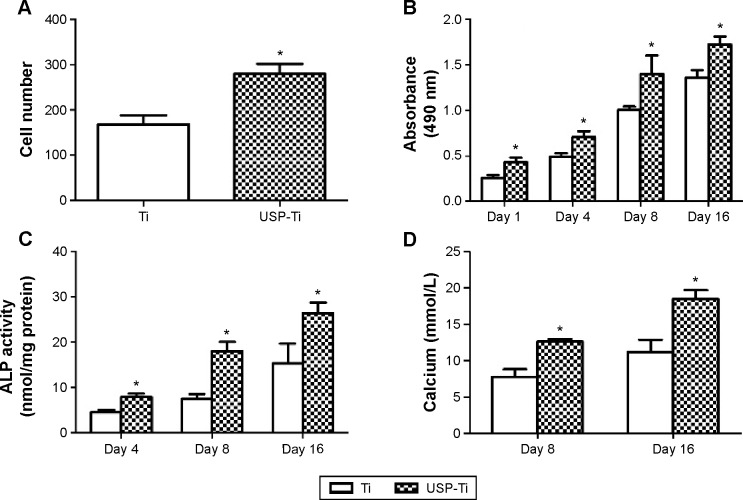
The fluorescence micrographs of cells stained with DAPI indicate cell adhesion (Figure 5), and the number of cells on USP-Ti surfaces was more than that on Ti surfaces (Figure 6A). The viability of MG63 cells was measured by MTS after culture for 1, 4, 8, and 16 days on Ti and USP-Ti. The cell viability increased with time on both substrates. The cell proliferation was higher on USP-Ti than on Ti, and significant differences were observed between the two surfaces at each prescribed time point (Figure 6B).
Figure 5.
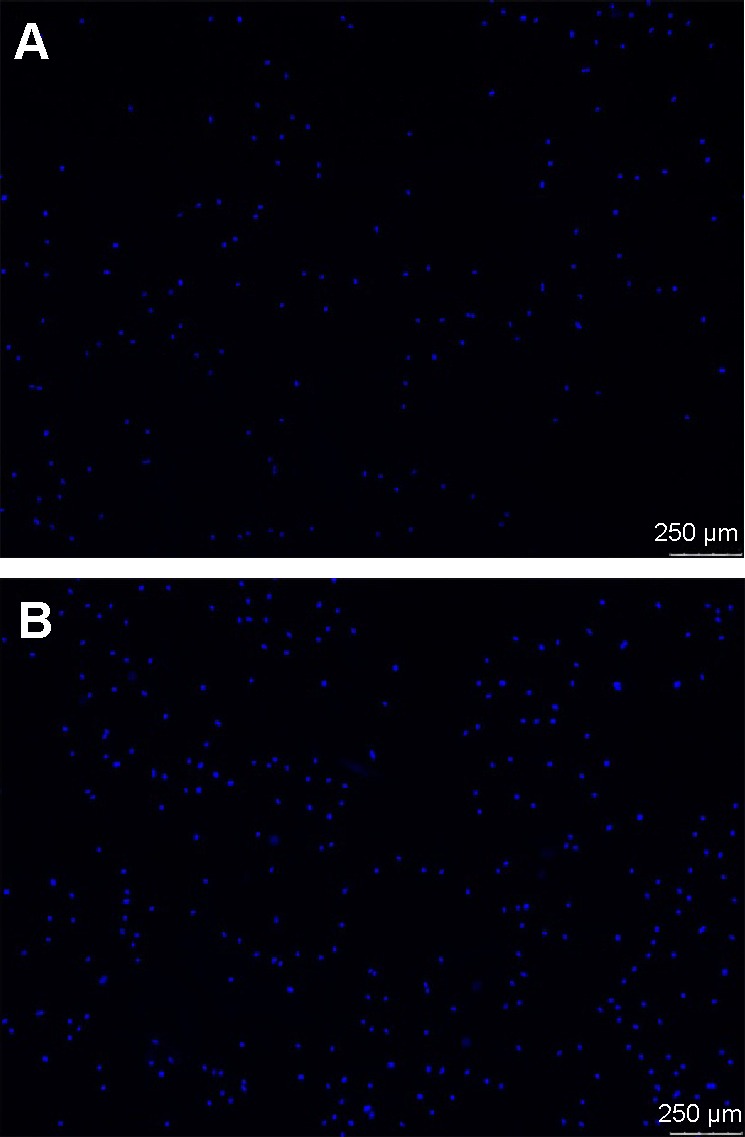
Fluorescence micrographs of osteoblasts (nuclei in blue) incubated on (A) Ti and (B) USP-Ti after 4 hours of culture.
Abbreviations: Ti, titanium; USP-Ti, Ti surface subjected to USP; USP, ultrasonic shot peening.
Figure 6.
The adhesion, viability, differentiation and calcification of osteoblasts culturing on Ti and USP-Ti.
Notes: Osteoblast adhesion measured by cell counting at 4 hours (A); cell viability of MG63 cells after 1, 4, 8, or 16 days of culture (B); ALP activity (normalized to total protein amounts) at 4, 8, and 16 days (C); and calcium deposition after culture for 8 and 16 days on Ti and USP-Ti surfaces (D). Data are shown as the mean ± SD. *P<0.05 compared with Ti.
Abbreviations: ALP, alkaline phosphatase; USP-Ti, Ti surface subjected to USP; USP, ultrasonic shot peening; SD, standard deviation; Ti, titanium.
Cell morphology
Figure 7 shows the morphology of osteoblasts examined by CLSM with dual staining of actin filaments and nuclei, and Figure 8 shows the SEM images of osteoblasts after culture for 12 hours on the surfaces of the Ti and USP-Ti samples. It is obvious that the osteoblasts had spread well. Actin filaments were clearly observed on both samples.
Figure 7.
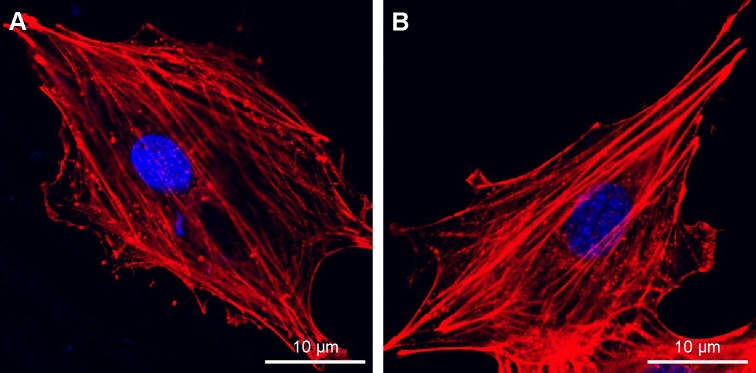
Fluorescence microscopy images of cells double stained with phalloidin for actin filaments (red) and DAPI for nuclei (blue) on Ti (A) and USP-Ti (B) samples.
Abbreviations: USP-Ti, Ti surface subjected to USP; USP, ultrasonic shot peening; Ti, titanium.
Figure 8.
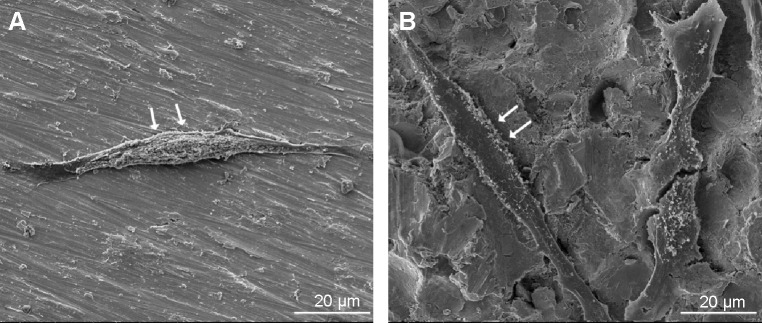
SEM images of osteoblasts after incubating 12 hours on Ti (A) and USP-Ti (B) samples.
Note: The cells are indicated with arrows.
Abbreviations: SEM, scanning electron microscope; USP-Ti, Ti surface subjected to USP; USP, ultrasonic shot peening; Ti, titanium.
ALP activity and calcium deposition
Figure 6C shows the ALP activity of osteoblasts cultured on Ti and USP-Ti samples on 4, 8, and 16 days. With prolonging the culture time, both kinds of surfaces were observed to have an increase in the ALP activity, and the ALP activity of cells on USP-Ti surface was significantly higher than that on the Ti surface (P<0.05). The Alizarin Red assay was used to assess the extent of calcium mineralization. The findings for calcium mineralization were similar to those for ALP activity. Figure 6D shows that the amount of calcium on both samples increased in a time-dependent manner, and the USP-Ti surfaces had significantly high calcium levels after 8 and 16 days of culture compared to Ti (P<0.05).
Pull-out test
The maximum pull-out force is shown in Figure 9, and it was significantly higher on USP-Ti groups than that on Ti groups.
Figure 9.
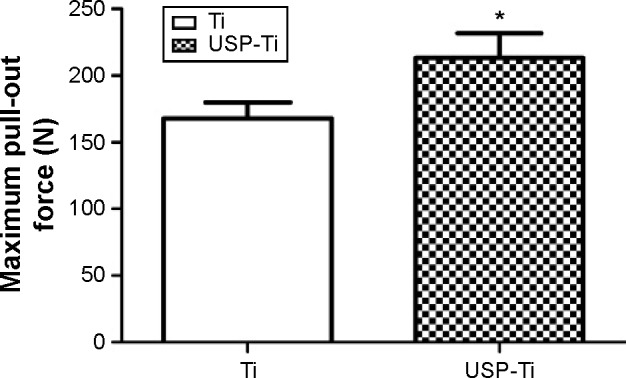
The failure-load values of Ti and USP-Ti at 12 weeks after implantation measured by the pull-out test.
Notes: Data are shown as the mean ± SD. *P<0.05 compared with Ti.
Abbreviations: USP-Ti, Ti surface subjected to USP; USP, ultrasonic shot peening; SD, standard deviation; Ti, titanium.
Micro-CT evaluation
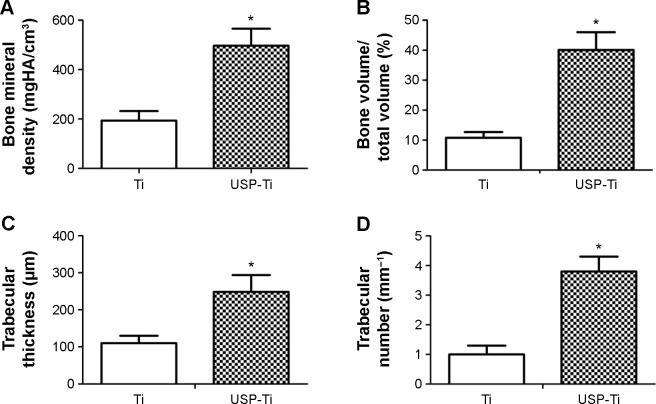
Figure 10 shows 3D reconstructed Micro-CT images of Ti and USP-Ti implants. The implants were marked with white color and cancellous bone with yellow color, respectively (Figure 10). Bone volume around implants surface in the bone marrow cavity of the USP-Ti group is obviously higher than that for the other groups. BMD, BV/TV, Tb.Th, and Tb.N were significantly higher on USP-Ti group compared to Ti group (P<0.01, Figure 11).
Figure 10.
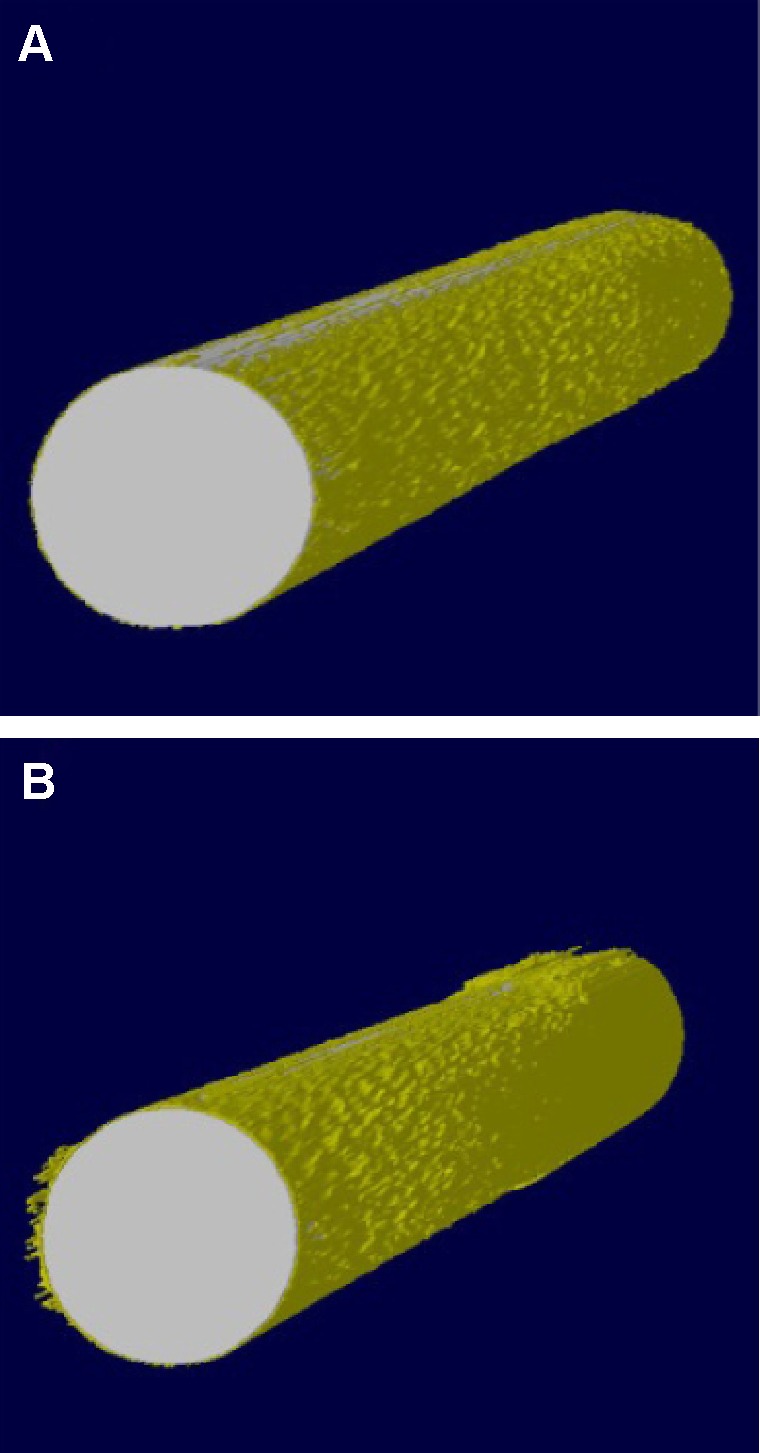
Reconstruction of implants based on Micro-CT.
Notes: Ti (A), USP-Ti (B).
Abbreviations: USP-Ti, Ti surface subjected to USP; USP, ultrasonic shot peening; Ti, titanium.
Figure 11.
Quantitative results of the Micro-CT evaluation.
Notes: Bone mineral density (A), bone volume fraction (B), trabecular thickness (C), trabecular number (D). Data are shown as the mean ± SD. *P<0.05 compared with Ti.
Abbreviations: USP-Ti, Ti surface subjected to USP; USP, ultrasonic shot peening; SD, standard deviation; Ti, titanium.
Histological evaluation
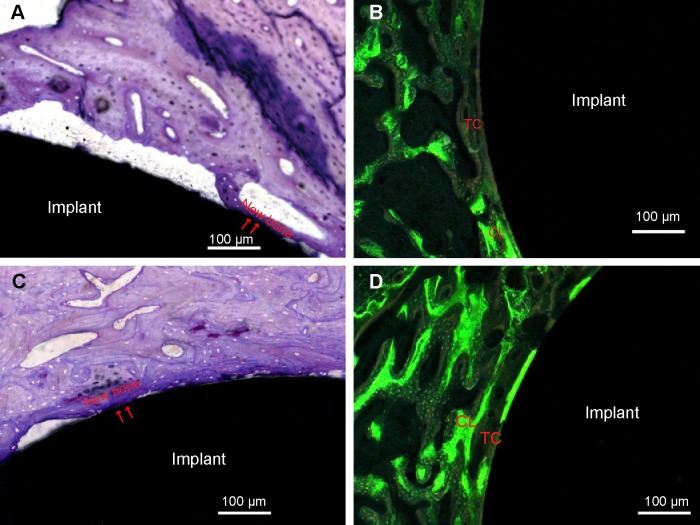
The representative histological images of the middle section of the USP-Ti at 12 weeks after implantation are shown in Figure 12. Newly formed bone tissue was clearly observed around the Ti and USP-Ti surfaces. As shown in Figure 12, good contact was seen between the bone tissue and the USP-Ti surface. We can see a double line of tetracycline and calcein clearly under fluorescence microscopy (Figures 12B and 12D), suggesting new bone formation. The BAR and NBA at the surface of the USP-Ti was higher than that on Ti, which indicates that the in vivo osseointegration of USP-Ti was better than that of Ti (Figure 13).
Figure 12.
Histological analysis in the middle section stained with methylene blue 12 weeks after implantation.
Notes: The newly formed bone directly contacted the rod surface (arrowheads). Ti (A), USP-Ti (C). Representative images of bone labeling with tetracycline and calcein 12 weeks after implantation. New bone was marked with double yellow–green lines labeled with tetracycline (yellow line) and calcein (green line). Ti (B), USP-Ti (D).
Abbreviations: USP-Ti, Ti surface subjected to USP; USP, ultrasonic shot peening; TC, tetracycline; CL, calcein; Ti, titanium.
Figure 13.
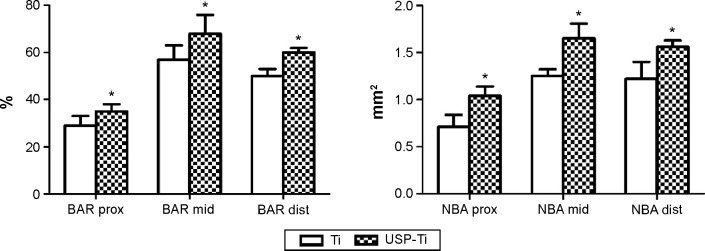
The surface BAR (%) and NBA (mm2) of Ti and USP-Ti in the proximal, middle, and distal sections at 12 weeks.
Notes: Data are shown as the mean ± SD. *P<0.05 compared with Ti.
Abbreviations: USP-Ti, Ti surface subjected to USP; USP, ultrasonic shot peening; BAR, bone apposition ratio; NBA, new bone area; SD, standard deviation; Ti, titanium.
Discussion
The primary challenge for bone implants is the development of the material surface that enhances cell–substrate interaction and ensures long-term stability of the bioimplants. In this work, USP can refine the surface grains of pure Ti into the nanoscale range (Figure 3), which is agreement with previous studies.17,19,20
When inserted in cortico-cancellous bone in an in vivo rabbit femur implantation model, USP-Ti demonstrated superior osseointegration to that seen for Ti, with firm abutments between the surface of material and the surrounding bone tissue. Histological analysis showed that new bone was formed and filled up the gap between the implants and bone for USP-Ti in direct contact with the implant, compared with that for Ti. Additionally, the irregular osteocytes in the lamellar bone matrix could be seen around the implant. The surface BAR and NBA of USP-Ti were significantly higher than that of Ti, reflecting the higher ability to induce osseointegration without any infiltration of fibrous tissue between the bone and implant.
Pull-out test is used to characterize the bonding strength between the bone and implant interface. In our study, it demonstrated that the mechanical fixation of USP-Ti implants was significantly stronger than that for Ti implants, further confirming the improved osseointegration.
Besides the above observation, it was also found that the USP-induced grain refinement in the surface layer of Ti significantly enhanced the in vitro osteoblast adhesion, proliferation, and differentiation, indicating superior cell–material interaction compared to Ti. It is well known that cell behaviors are strongly influenced by topographical features.21–23
First, grain size plays an important role in the improved biocompatibility of USP-Ti. Cells are willing to respond to nanostructure surfaces, since in vivo they live inside an extracellular matrix containing nanoscale collagen fibrils and since their own surfaces are structured on the nanoscale level (receptors and filopodia).24 Faghihi et al12 reported that a nanostructured titanium with grain size of 10–50 nm fabricated by high-pressure torsion notably enhanced the attachment and activity of preosteoblasts compared to the CG one. Webster et al9,10,25 demonstrated that the NG size material enhanced osteoblast adhesion and proliferation when compared to the control group. It is plausible, therefore, to suggest that the enhanced osteoblast biocompatibility seen on USP-Ti is due to its nanograin size of the surface.
Second, roughness (Ra) is a key factor in the response of cells to biomaterials. The positive effects of Ra on the attachment, proliferation, and differentiation of osteoblasts have been proved.3,21,26 A research conducted by Olivares-Navarrete et al27 showed that Wnt5a pathway ligands, receptors, and intracellular signaling molecules were upregulated when osteoblasts were cultured on SLA surfaces (Ra =3.22 μm) compared to Ti (Ra =0.2 μm) surfaces and also proved that Wnt5a promotes osteogenic differentiation through the production of BMPs (bone morphogenetic protein). In this study, the Ra of USP-Ti (842 nm) is much higher than that of Ti (185 nm) and is indicative of a higher degree of biocompatibility for this surface modification.
Third, hydrophilicity also plays an important role in the improved biocompatibility of USP-Ti. It has been proved that more hydrophilic titanium surface (hydrophilic sand-blasted acid-etched [modSLA]) could increase osseointegration, and this is associated with an increase in expression of the osteogenic differentiation markers BSPII (bone sialoprotein II) and osteocalcin. The detailed mechanisms have been detected by pathway analysis, which shows that several genes were upregulated when culturing on more hydrophilic surface, including TGFβ (transforming growth factor β), BMP2 (bone morphogenetic protein 2), BMP6, SP1 (Sp1 transcription factor), and CREBBP (Creb binding protein).28 Gu et al29 reported that the ALP activity of osteoblasts was increased with the inhibition of PI3K/Akt signaling pathway, which suggested that inhibition of PI3K/Akt signaling pathway may be responsible for the increased osteogenic differentiation. Some other studies also confirm the relationship between hydrophilic implant surfaces and enhanced cell biocompatibility.30,31 It agrees with previous studies that the USP-Ti with more hydrophilic surface demonstrated better in vitro biocompatibility compared to that of Ti.
To sum up, in vitro studies showed that NG surfaces played an important role in promoting the adhesion, proliferation, and differentiation of osteoblasts. Moreover, our data also emphasize the importance of nanometer grain in the osseoconductivity of biomedical implants. The in vivo assessment of NG implants supports our in vitro observation, validating the ability of the nanometer grain in enhancing osseointegration at the interface of bone and implant.
Conclusion
USP is employed to modify pure Ti, and NG surface is obtained. It promoted cell adhesion, proliferation, and differentiation in vitro as well as new bone formation in vivo. Those results suggest that USP has the potential for future use as a surface modification method in biomedical applications.
Acknowledgments
This work was supported by the Science Foundation of Qilu Hospital of Shandong University, People’s Republic of China (grant number 2015QLQN27), the Fundamental Research Funds of Shandong University, People’s Republic of China (grant number 2015QLQN27), the National Natural Science Foundation of Shandong Province, People’s Republic of China (grant number ZR2011HM084), the Projects of Medical and Health Technology Development program in Shandong province, People’s Republic of China (grant number BZ07, 2007), the National Natural Science Foundation of China (grant number 81271962), the National Natural Science Foundation of China (grant number 81171688), and the Shanghai Municipal Science and Technology Commission Foundation (grant number 12JC1407302).
Footnotes
Disclosure
The authors report no conflicts of interest in this work.
References
- 1.Huang R, Lu S, Han Y. Role of grain size in the regulation of osteoblast response to Ti-25Nb-3Mo-3Zr-2Sn alloy. Colloids Surf B Biointerfaces. 2013;111:232–241. doi: 10.1016/j.colsurfb.2013.06.007. [DOI] [PubMed] [Google Scholar]
- 2.Guo Y, Chen D, Cheng M, Lu W, Wang L, Zhang X. The bone tissue compatibility of a new Ti35Nb2Ta3Zr alloy with a low Young’s modulus. Int J Mol Med. 2013;31(3):689–697. doi: 10.3892/ijmm.2013.1249. [DOI] [PubMed] [Google Scholar]
- 3.Gittens RA, McLachlan T, Olivares-Navarrete R, et al. The effects of combined micron-/submicron-scale surface roughness and nanoscale features on cell proliferation and differentiation. Biomaterials. 2011;32(13):3395–3403. doi: 10.1016/j.biomaterials.2011.01.029. [DOI] [PMC free article] [PubMed] [Google Scholar]
- 4.Guo Y, Chen D, Lu W, Jia Y, Wang L, Zhang X. Corrosion resistance and in vitro response of a novel Ti35Nb2Ta3Zr alloy with a low Young’s modulus. Biomed Mater. 2013;8(5):055004. doi: 10.1088/1748-6041/8/5/055004. [DOI] [PubMed] [Google Scholar]
- 5.Huang R, Zhuang H, Han Y. Second-phase-dependent grain refinement in Ti-25Nb-3Mo-3Zr-2Sn alloy and its enhanced osteoblast response. Mater Sci Eng C Mater Biol Appl. 2014;35:144–152. doi: 10.1016/j.msec.2013.10.037. [DOI] [PubMed] [Google Scholar]
- 6.Liu H, Webster TJ. Nanomedicine for implants: a review of studies and necessary experimental tools. Biomaterials. 2007;28(2):354–369. doi: 10.1016/j.biomaterials.2006.08.049. [DOI] [PubMed] [Google Scholar]
- 7.Webster TJ, Hellenmeyer EL, Price RL. Increased osteoblast functions on theta + delta nanofiber alumina. Biomaterials. 2005;26(9):953–960. doi: 10.1016/j.biomaterials.2004.03.040. [DOI] [PubMed] [Google Scholar]
- 8.Balasundaram G, Webster TJ. An overview of nano-polymers for orthopedic applications. Macromol Biosci. 2007;7(5):635–642. doi: 10.1002/mabi.200600270. [DOI] [PubMed] [Google Scholar]
- 9.Webster TJ, Ejiofor JU. Increased osteoblast adhesion on nanophase metals: Ti, Ti6Al4V, and CoCrMo. Biomaterials. 2004;25(19):4731–4739. doi: 10.1016/j.biomaterials.2003.12.002. [DOI] [PubMed] [Google Scholar]
- 10.Webster TJ, Ergun C, Doremus RH, Siegel RW, Bizios R. Enhanced functions of osteoblasts on nanophase ceramics. Biomaterials. 2000;21(17):1803–1810. doi: 10.1016/s0142-9612(00)00075-2. [DOI] [PubMed] [Google Scholar]
- 11.Zhao C, Ji W, Han P, Zhang J, Jiang Y, Zhang X. In vitro and in vivo mineralization and osseointegration of nanostructured Ti6Al4V. J Nanopart Res. 2011;13(2):645–654. [Google Scholar]
- 12.Faghihi S, Azari F, Zhilyaev AP, Szpunar JA, Vali H, Tabrizian M. Cellular and molecular interactions between MC3T3-E1 pre-osteoblasts and nanostructured titanium produced by high-pressure torsion. Biomaterials. 2007;28(27):3887–3895. doi: 10.1016/j.biomaterials.2007.05.010. [DOI] [PubMed] [Google Scholar]
- 13.Valiev R. Nanostructuring of metals by severe plastic deformation for advanced properties. Nat Mater. 2004;3(8):511–516. doi: 10.1038/nmat1180. [DOI] [PubMed] [Google Scholar]
- 14.Vaezi M, Sadrnezhaad S, Nikzad L. Electrodeposition of Ni–SiC nano-composite coatings and evaluation of wear and corrosion resistance and electroplating characteristics. Colloids Surf A Physicochem Eng Aspects. 2008;315(1):176–182. [Google Scholar]
- 15.Zein El Abedin S, Moustafa E, Hempelmann R, Natter H, Endres F. Electrodeposition of nano-and microcrystalline aluminium in three different air and water stable ionic liquids. Chemphyschem. 2006;7(7):1535–1543. doi: 10.1002/cphc.200600095. [DOI] [PubMed] [Google Scholar]
- 16.Jindal S, Bansal R, Singh BP, et al. Enhanced osteoblast proliferation and corrosion resistance of commercially pure titanium through surface nanostructuring by ultrasonic shot peening and stress relieving. J Oral Implantol. 2014;40(S1):347–355. doi: 10.1563/AAID-JOI-D-12-00006. [DOI] [PubMed] [Google Scholar]
- 17.Liu G, Lu J, Lu K. Surface nanocrystallization of 316L stainless steel induced by ultrasonic shot peening. Mater Sci Eng A Struct Mater. 2000;286(1):91–95. [Google Scholar]
- 18.Klug HP, Alexander LE. X-ray Diffraction Procedures for Polycrystalline and Amorphous Materials. 2nd ed. New York, NY: Wiley; 1974. [Google Scholar]
- 19.Tao N, Sui M, Lu J, Lua K. Surface nanocrystallization of iron induced by ultrasonic shot peening. Nanostruct Mater. 1999;11(4):433–440. [Google Scholar]
- 20.Todaka Y, Umemoto M, Tsuchiya K. Comparison of nanocrystalline surface layer in steels formed by air blast and ultrasonic shot peening. Mater Trans. 2004;45(2):376–379. [Google Scholar]
- 21.Wu Y, Zitelli JP, TenHuisen KS, Yu X, Libera MR. Differential response of Staphylococci and osteoblasts to varying titanium surface roughness. Biomaterials. 2011;32(4):951–960. doi: 10.1016/j.biomaterials.2010.10.001. [DOI] [PubMed] [Google Scholar]
- 22.Mesquita P, Gomes Pde S, Sampaio P, Juodzbalys G, Afonso A, Fernandes MH. Surface properties and osteoblastic cytocompatibility of two blasted and Acid-etched titanium implant systems with distinct microtopography. J Oral Maxillofac Res. 2012;3(1):e4. doi: 10.5037/jomr.2012.3104. [DOI] [PMC free article] [PubMed] [Google Scholar]
- 23.Thakral G, Thakral R, Sharma N, Seth J, Vashisht P. Nanosurface – the future of implants. J Clin Diagn Res. 2014;8(5):Ze07–Ze10. doi: 10.7860/JCDR/2014/8764.4355. [DOI] [PMC free article] [PubMed] [Google Scholar]
- 24.Anselme K, Davidson P, Popa AM, Giazzon M, Liley M, Ploux L. The interaction of cells and bacteria with surfaces structured at the nanometre scale. Acta Biomater. 2010;6(10):3824–3846. doi: 10.1016/j.actbio.2010.04.001. [DOI] [PubMed] [Google Scholar]
- 25.Webster TJ, Smith TA. Increased osteoblast function on PLGA composites containing nanophase titania. J Biomed Mater Res A. 2005;74(4):677–686. doi: 10.1002/jbm.a.30358. [DOI] [PubMed] [Google Scholar]
- 26.Kim EJ, Fleischman AJ, Muschler GF, Roy S. Response of bone marrow derived connective tissue progenitor cell morphology and proliferation on geometrically modulated microtextured substrates. Biomed Microdevices. 2013;15(3):385–396. doi: 10.1007/s10544-012-9727-7. [DOI] [PMC free article] [PubMed] [Google Scholar]
- 27.Olivares-Navarrete R, Hyzy SL, Hutton DL, et al. Role of non-canonical Wnt signaling in osteoblast maturation on microstructured titanium surfaces. Acta Biomater. 2011;7(6):2740–2750. doi: 10.1016/j.actbio.2011.02.030. [DOI] [PMC free article] [PubMed] [Google Scholar]
- 28.Vlacic-Zischke J, Hamlet SM, Friis T, Tonetti MS, Ivanovski S. The influence of surface microroughness and hydrophilicity of titanium on the up-regulation of TGFbeta/BMP signalling in osteoblasts. Biomaterials. 2011;32(3):665–671. doi: 10.1016/j.biomaterials.2010.09.025. [DOI] [PubMed] [Google Scholar]
- 29.Gu YX, Du J, Si MS, Mo JJ, Qiao SC, Lai HC. The roles of PI3K/Akt signaling pathway in regulating MC3T3-E1 preosteoblast proliferation and differentiation on SLA and SLActive titanium surfaces. J Biomed Mater Res A. 2013;101(3):748–754. doi: 10.1002/jbm.a.34377. [DOI] [PubMed] [Google Scholar]
- 30.Padial-Molina M, Galindo-Moreno P, Fernandez-Barbero JE, et al. Role of wettability and nanoroughness on interactions between osteoblast and modified silicon surfaces. Acta Biomater. 2011;7(2):771–778. doi: 10.1016/j.actbio.2010.08.024. [DOI] [PubMed] [Google Scholar]
- 31.Eriksson C, Nygren H, Ohlson K. Implantation of hydrophilic and hydrophobic titanium discs in rat tibia: cellular reactions on the surfaces during the first 3 weeks in bone. Biomaterials. 2004;25(19):4759–4766. doi: 10.1016/j.biomaterials.2003.12.006. [DOI] [PubMed] [Google Scholar]


