Abstract
Trypanosoma brucei, a causative agent of African Sleeping Sickness, constantly changes its dense variant surface glycoprotein (VSG) coat to avoid elimination by the immune system of its mammalian host, using an extensive repertoire of dedicated genes. However, the dynamics of VSG expression in T. brucei during an infection are poorly understood. We have developed a method, based on de novo assembly of VSGs, for quantitatively examining the diversity of expressed VSGs in any population of trypanosomes, and thereby monitored VSG population dynamics in vivo. Our experiments revealed unexpected diversity within parasite populations, and a mechanism for diversifying the genome-encoded VSG repertoire. The interaction between T. brucei and its host is substantially more dynamic and nuanced than previously expected.
The protozoan parasite Trypanosoma brucei, a major cause of human and animal Trypanosomiasis, lives extracellularly within its mammalian host, where it is constantly exposed to the host immune system. T. brucei has evolved a mechanism for antigenic variation during infection, in which the parasite can turn on and off variant surface glycoprotein (VSG)-encoding genes from a genomic repertoire of ~2000 different genes(1). Each parasite expresses one VSG at a time, from one of ~15 telomeric expression sites(2); the rest (silent VSGs) sit in silent expression sites or in other genomic locations(1). The highly antigenic VSG is so densely packed on T. brucei's surface that it obscures other cell-surface components from immune recognition. At any time, a few parasites in a population will stochastically switch their VSG. As previous variants are recognized by the immune system and cleared, newly switched variants emerge, giving rise to characteristic waves of parasitemia(3). These waves have long been interpreted as the sequential expression and clearance of one or a few VSGs, a notion supported by experimental evidence that relied upon low-resolution approaches (4–8).
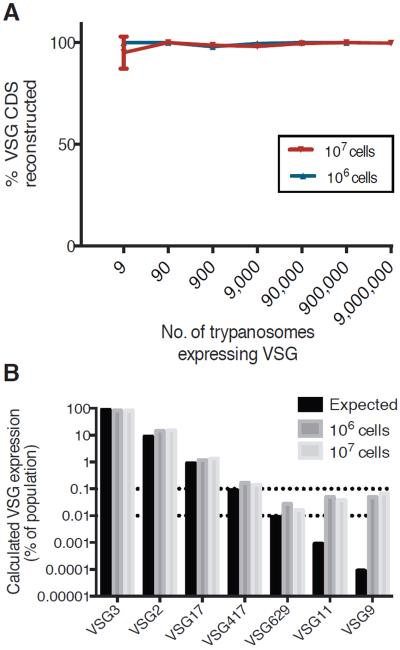
Despite attempts at modeling, little is known about the kinetics of VSG expression during infection (9–12). To assess this, we developed a targeted RNA-seq approach, termed VSG-seq, in which VSG cDNA, amplified using conserved sequences at the 5′ and 3′ end of every mature VSG mRNA (Fig. S1), is sequenced and then assembled de novo by a transcriptome reconstruction method called Trinity (13). We validated this approach using mixtures of T. brucei cell lines expressing specific VSGs in known proportions (Fig. 1 and Fig. S1). We compared measured expression of each VSG in the control populations to the known input, and found that we could accurately assemble a VSG sequence expressed in as few as nine cells in the control mixture. VSG-seq is capable of reliably detecting variants present on 0.01% of parasites and quantifying a variant's presence within the population, for variants present above 0.1% of the population (Fig. 1B and Fig. S1). The apparent overestimation of minor VSGs in this control experiment is likely a result of low-level switching in the more abundant components of the mixture, or low-level transcription of silent VSGs. The limits of detection and quantification for VSG-seq appear to be independent of starting cell number, as control mixtures made from 106 or 107 cells show similar results (Fig. 1B, Fig. S1).
Fig. 1. VSG-seq for assembly of VSGs and quantification VSG expression in a population of African trypanosomes.
(A) Efficiency of VSG assembly (mean +/− SD). Control libraries made from a mixture of cell lines expressing different VSGs in known proportions were sequenced, and sequencing reads were assembled using Trinity(13). Control mixtures were made from either one million or ten million cells. (B) Quantification of VSG expression in control libraries (mean +/− SD). The black bar (“Expected”) represents the proportion of cells expressing that VSG in the control mixture, and the gray bars represent quantification for each library using VSG-seq.
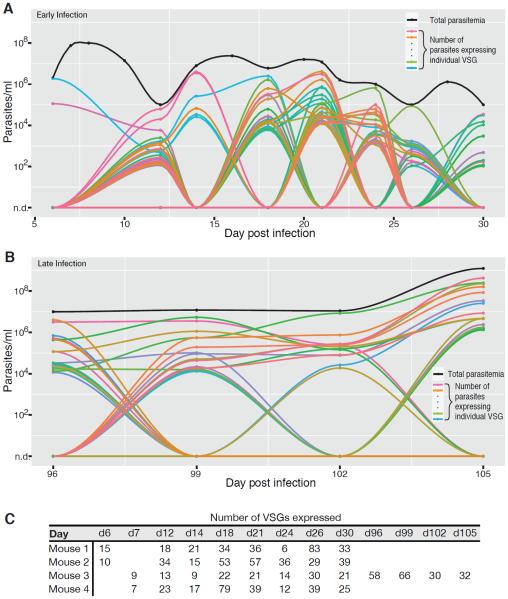
To measure VSG expression within populations of T. brucei, we infected four mice with ~5 EATRO1125 parasites, originally expressing VSG AnTat1.1 (14, 15) but now heterogeneous and each expressing a distinct VSG, and tracked VSG expression dynamics for 30 days. A few variants made up the majority of the population at each time, but, surprisingly, each sample also contained many rare variants that would have been undetectable using previous approaches (Fig. 2A, Fig. S2). Notably, infections showed great diversity even within parasitemic valleys. VSG-seq identified an average of 28 variants at each time point during the first 30 days of infection (Fig. 2C).
Fig. 2. Complex dynamics throughout T. brucei infection.
(A) Dynamics of VSG expression during early infection (d6-30). Each colored line represents an individual VSG's presence in the population, while the black line represents total parasitemia. Only variants present at greater than 0.1% of the population at that time point are shown. When parasitemia could not be measured by hemacytometer (<106/ml), parasitemia is artificially set at 105/ml to allow for visualization of the population. Note that, because there are so many VSGs expressed during infection, colors are difficult to distinguish; overall, variants do not reappear later in the same infection. A smooth curve connects points where expression or parasitemia was measured; these curves are for visualization and do not imply the actual kinetics of variant expression between points. This figure is representative of four infection experiments (Mouse 2 is shown). (B) Dynamics of VSG expression during late infection (d96-105) for Mouse 3. (C) Number of VSGs present at each time point. Any variants quantified as greater than 0.01% of the population are included.
One mouse (Mouse 3) survived much longer than the other three (106 days, compared to 41–72 days). VSG identity has not been shown to affect growth rate or induction of the immune response(16, 17), so the increased survival and lower diversity in this mouse is more likely due to the polyclonal germline B cell repertoire, unique to each mouse (18), rather than the initiating VSG. Although in the later stages of this infection VSG dynamics did appear qualitatively different with variants persisting longer before clearance (Fig. 2B), possibly due to immune system exhaustion, parasite populations remained diverse, with 30–66 variants detectable at each sampling (Fig. 2C).
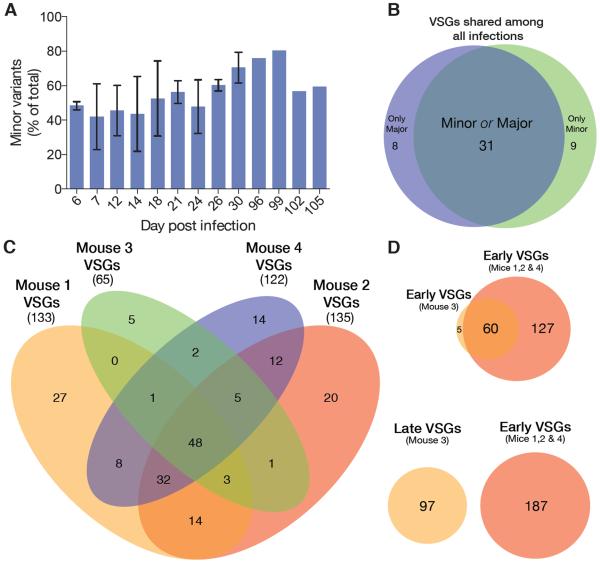
To see if these infections showed any bias or hierarchy in VSG expression (6, 8, 19, 20), we compared the VSG repertoires of all four mice. During the first 30 days of infection 192 VSGs were expressed. Although each infection initiated with a different major VSG, the majority of variants (86%) appeared in more than one infection, and nearly half (46%) appeared in all four infections (Fig. 3C). 97 VSGs were expressed in Mouse 3 from days 96–105. We compared the later occurring VSGs with those expressed early in Mice 1, 2, and 4, and found none in common, even though early variants from Mouse 3 also appeared frequently in Mice 1, 2, and 4 (Fig. 3D). Our experiments revealed striking diversity within each infection, but surprisingly frequent occurrence of the same VSGs in different infections.
Fig. 3. Variant emergence during infection.
(A) Minor variants present at each time point (mean +/− SD). A minor variant is arbitrarily defined as any VSG that never exceeds 1% of the population during the course of infection in a single mouse. Major variants are any variant that exceeds 1% of the population at some point during infection. (B) Venn diagram comparing the fates of VSGs appearing in all four infections. (C) Intersection of sets of VSGs expressed during early infection (d6-d30). The total number of VSGs is listed in parentheses below the mouse number. (D) Venn diagrams showing intersection of VSGs expressed early in infection (VSGs from Mouse 1, 2, or 4 vs VSGs from Mouse 3, d7-30) and intersection of VSGs expressed early in infection with VSGs expressed late in infection (VSGs from Mouse 1, 2, or 4 vs VSGs from Mouse 3, d96-105).
Within these diverse populations, many variants appeared transiently. We have termed these `minor' variants. By examining the fate of every variant, we found that, at any time during the first 30 days of infection, about half (53%) of the variants present will never reach 1% of the population (Fig. 3A). Of the 48 VSGs that appeared in all four infections, few were consistently dominant and few were only ever expressed as a minor variant (Fig. 3B). This implies that variant success is not determined only by the expressed VSG. Instead, variant success is likely to be determined by interactions between the parasite and the humoral immune response in each animal. Due to antigenic similarity among some VSGs and their consequent elimination by cross-reacting antibodies, the effective VSG repertoire will be smaller than the repertoire the genome is capable of generating.
Besides losing variants to cross-reactivity, T. brucei's genomic VSG repertoire consists of a high proportion of incomplete VSG genes or pseudogenes (1, 21). Indeed, the 289 VSGs observed in our infections may represent over half of the complete VSG repertoire (~400 complete and predicted to be functional VSGs for the Lister427 strain (1), although the VSG repertoire for the EATRO1125 strain has not been fully elucidated). The 65–135 VSGs observed before day 30 could represent up to 35% of the pre-existing repertoire. Given the sampling frequency in our experiment, these values almost certainly underestimate the expressed VSG diversity in vivo. Therefore, much of the intact VSG repertoire is likely to have been expended early in an infection, as a result of expression and subsequent recognition by the immune system, so the pre-existing repertoire of complete VSGs would appear to be insufficient to support the sometimes years-long infections observed in the field. Although parasitemia is much lower in natural hosts, pre-existing immunity is common in native mammals (22), requiring constant VSG diversification to sustain infection.
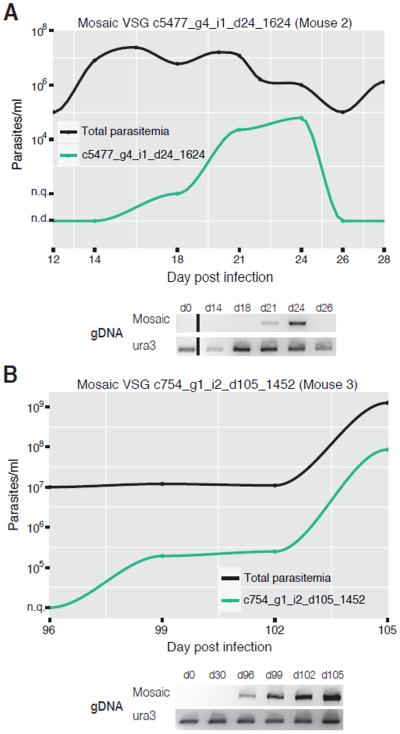
Segmental gene conversion events have been demonstrated in both Trypanosoma equiperdum and T. brucei infections (7, 23, 24) generating `mosaic' VSGs that were not previously encoded in the genome. Previous studies had noted that mosaics tend to arise later in infection, but have not determined when these variants are formed within the genome, or how. It is unknown whether mosaic VSGs form at the active expression site or within the silent repertoire prior to expression. To identify possible mosaics, we compared expressed VSG sequences to two independently assembled genomes for this parasite strain. Because of limitations in the amount of material available at each time point, we could choose only a few candidates for validation. To test that these were true mosaics and to determine when they formed within the genome, we used VSG-specific primers to confirm their absence from the genome of the parental strain and presence within genomic DNA (gDNA) collected during infection. We identified three mosaic VSGs using this approach. In each case, the mosaic VSG was only detectable by PCR when it was also being expressed within the parasite population. This suggests that mosaic formation occurs, at least in these cases, shortly before expression with subsequent transposition into the active expression site, or directly within the active expression site (Fig. 4, Fig. S3). Mosaic formation may be a mechanism for increasing repertoire diversity as infection progresses.
Fig. 4. Mosaic VSGs can be identified throughout infection.
(A) Shows transient expression of a mosaic VSG in the population, and PCR confirmation of the mosaic is shown below. The black line represents total parasitemia at each day post infection, and the green line represents the number of parasites expressing the mosaic VSG. “n.q.” (not quantifiable) indicates that the VSG is detectable within the population, but not quantifiable. “n.d.” indicates that the VSG is not detectable within the population. Below the graph are products from PCR of gDNA at each time point, using either primers specific for the mosaic VSG or the control gene, ura3. This VSG could not be amplified when first detected by VSG-seq, likely because of low cell numbers in the DNA sample (probably less than 10 cells). (B) Mosaic from late infection with PCR confirmation of the mosaic shown below.
Our results indicate that VSG switching does not occur at a rate that we would have expected to be just sufficient for immune evasion, with only a few variants present at any time. This suggests that recombinatorial mechanisms that expand the pre-existing VSG repertoire may be critical for sustaining the long infections observed in natural hosts. Recent work on samples collected from sleeping sickness patients shows higher-than-expected VSG diversity(25), indicating that complex VSG dynamics are likely to be clinically relevant. Our results provide a foundation for the study of VSG switching and diversification in vivo, and demonstrate the potential of high-throughput approaches for studying antigenic variation, in trypanosomes and other parasitic diseases, in naturally infected humans and animals.
Supplementary Material
Acknowledgments
We thank Al Ivens and Keith Matthews, and Kapila Gunasekera and Isabel Roditi for generously sharing their independently assembled genome sequences, and Jake Scott for help with early optimization experiments. The work presented has been supported in part by NIH/NIAID (AI085973) to FNP, by an NSF Graduate Research Fellowship (DGE-1325261) to MM, and by a Rockefeller University Women in Science Fellowship to MM. All raw data has been deposited to the NCBI's Sequence Read Archive under accession number SRP051697, along with all the methods used to generate the figures.
Footnotes
Supplementary Materials Materials and Methods, Figs. S1 to S3, Captions for databases S1 to S5, Databases S1 to S5 as zipped archives, References (26–30)
References and Notes
- 1.Cross GAM, Kim HS, Wickstead B. Capturing the variant surface glycoprotein repertoire (the VSGnome) of Trypanosoma brucei Lister 427. Mol Biochem Parasitol. 2014;195:59–73. doi: 10.1016/j.molbiopara.2014.06.004. [DOI] [PubMed] [Google Scholar]
- 2.Hertz-Fowler C, et al. Telomeric expression sites are highly conserved in Trypanosoma brucei. PLoS ONE. 2008;3:e3527. doi: 10.1371/journal.pone.0003527. [DOI] [PMC free article] [PubMed] [Google Scholar]
- 3.Ross R, Thomson D. A Case of Sleeping Sickness Studied by Precise Enumerative Methods: Regular Periodical Increase of the Parasites Disclosed. Proceedings of the Royal Society B: Biological Sciences. 1910;82:411–415. [Google Scholar]
- 4.Turner CM, Barry JD. High frequency of antigenic variation in Trypanosoma brucei rhodesiense infections. Parasitology. 1989;99(Pt 1):67–75. doi: 10.1017/s0031182000061035. [DOI] [PubMed] [Google Scholar]
- 5.Turner CM. The rate of antigenic variation in fly-transmitted and syringe-passaged infections of Trypanosoma brucei. FEMS Microbiol Lett. 1997;153:227–231. doi: 10.1111/j.1574-6968.1997.tb10486.x. [DOI] [PubMed] [Google Scholar]
- 6.Miller EN, Turner MJ. Analysis of antigenic types appearing in first relapse populations of clones of Trypanosoma brucei. Parasitology. 1981;82:63–80. doi: 10.1017/s0031182000041871. [DOI] [PubMed] [Google Scholar]
- 7.Hall JPJ, Wang H, Barry JD. Mosaic VSGs and the scale of Trypanosoma brucei antigenic variation. PLoS Pathog. 2013;9:e1003502. doi: 10.1371/journal.ppat.1003502. [DOI] [PMC free article] [PubMed] [Google Scholar]
- 8.Morrison LJ, Majiwa P, Read AF, Barry JD. Probabilistic order in antigenic variation of Trypanosoma brucei. Int J Parasitol. 2005;35:961–972. doi: 10.1016/j.ijpara.2005.05.004. [DOI] [PubMed] [Google Scholar]
- 9.Lythgoe KA, Morrison LJ, Read AF, Barry JD. Parasite-intrinsic factors can explain ordered progression of trypanosome antigenic variation. Proc Natl Acad Sci USA. 2007;104:8095–8100. doi: 10.1073/pnas.0606206104. [DOI] [PMC free article] [PubMed] [Google Scholar]
- 10.Macgregor P, Savill NJ, Hall D, Matthews KR. Transmission Stages Dominate Trypanosome Within-Host Dynamics during Chronic Infections. Cell Host and Microbe. 2011;9:310–318. doi: 10.1016/j.chom.2011.03.013. [DOI] [PMC free article] [PubMed] [Google Scholar]
- 11.Frank SA. A model for the sequential dominance of antigenic variants in African trypanosome infections. Proc. Biol. Sci. 1999;266:1397–1401. doi: 10.1098/rspb.1999.0793. [DOI] [PMC free article] [PubMed] [Google Scholar]
- 12.Gjini E, Haydon DT, Barry JD, Cobbold CA. Linking the antigen archive structure to pathogen fitness in African trypanosomes. Proc. Biol. Sci. 2013;280:20122129–20122129. doi: 10.1098/rspb.2012.2129. [DOI] [PMC free article] [PubMed] [Google Scholar]
- 13.Grabherr MG, et al. Full-length transcriptome assembly from RNA-Seq data without a reference genome. Nat. Biotechnol. 2011;29:644–652. doi: 10.1038/nbt.1883. [DOI] [PMC free article] [PubMed] [Google Scholar]
- 14.Van Meirvenne N, Janssens PG, Magnus E. Antigenic variation in syringe passaged populations of Trypanosoma (Trypanozoon) brucei. 1. Rationalization of the experimental approach. Ann Soc Belg Med Trop. 1975;55:1–23. [PubMed] [Google Scholar]
- 15.Claes F, et al. Bioluminescent imaging of Trypanosoma brucei shows preferential testis dissemination which may hamper drug efficacy in sleeping sickness. PLoS Negl Trop Dis. 2009;3:e486. doi: 10.1371/journal.pntd.0000486. [DOI] [PMC free article] [PubMed] [Google Scholar]
- 16.Seed JR. Competition among serologically different clones of Trypanosoma brucei gambiense in vivo. J Protozool. 1978;25:526–529. doi: 10.1111/j.1550-7408.1978.tb04179.x. [DOI] [PubMed] [Google Scholar]
- 17.Gray AR. Antigenic variation in a strain of Trypanosoma brucei transmitted by Glossina morsitans and G. palpalis. J Gen Microbiol. 1965;41:195–214. doi: 10.1099/00221287-41-2-195. [DOI] [PubMed] [Google Scholar]
- 18.Lu J, et al. IgG variable region and VH CDR3 diversity in unimmunized mice analyzed by massively parallel sequencing. Molecular Immunology. 2014;57:274–283. doi: 10.1016/j.molimm.2013.09.008. [DOI] [PubMed] [Google Scholar]
- 19.Myler PJ, Allen AL, Agabian N, Stuart K. Antigenic variation in clones of Trypanosoma brucei grown in immune-deficient mice. Infect Immun. 1985;47:684–690. doi: 10.1128/iai.47.3.684-690.1985. [DOI] [PMC free article] [PubMed] [Google Scholar]
- 20.Liu AY, Michels PA, Bernards A, Borst P. Trypanosome variant surface glycoprotein genes expressed early in infection. J Mol Biol. 1985;182:383–396. doi: 10.1016/0022-2836(85)90198-6. [DOI] [PubMed] [Google Scholar]
- 21.Berriman M, et al. The genome of the African trypanosome Trypanosoma brucei. Science. 2005;309:416–422. doi: 10.1126/science.1112642. [DOI] [PubMed] [Google Scholar]
- 22.Marcello L, Barry JD. From silent genes to noisy populations-dialogue between the genotype and phenotypes of antigenic variation. J. Eukaryot. Microbiol. 2007;54:14–17. doi: 10.1111/j.1550-7408.2006.00227.x. [DOI] [PMC free article] [PubMed] [Google Scholar]
- 23.Kamper SM, Barbet AF. Surface epitope variation via mosaic gene formation is potential key to long-term survival of Trypanosoma brucei. Mol Biochem Parasitol. 1992;53:33–44. doi: 10.1016/0166-6851(92)90004-4. [DOI] [PubMed] [Google Scholar]
- 24.Roth C, Bringaud F, Layden RE, Baltz T, Eisen H. Active late-appearing variable surface antigen genes in Trypanosoma equiperdum are constructed entirely from pseudogenes. Proc Natl Acad Sci USA. 1989;86:9375–9379. doi: 10.1073/pnas.86.23.9375. [DOI] [PMC free article] [PubMed] [Google Scholar]
- 25.Eyford BA, Ahmad R, Enyaru JC, Carr SA, Pearson TW, Sturtevant J. Ed. Identification of Trypanosome proteins in plasma from African sleeping sickness patients infected with T. b. rhodesiense. PLoS ONE. 2013;8:e71463. doi: 10.1371/journal.pone.0071463. [DOI] [PMC free article] [PubMed] [Google Scholar]
- 26.Fu L, Niu B, Zhu Z, Wu S, Li W. CD-HIT: accelerated for clustering the next-generation sequencing data. Bioinformatics. 2012;28:3150–3152. doi: 10.1093/bioinformatics/bts565. [DOI] [PMC free article] [PubMed] [Google Scholar]
- 27.Li W, Godzik A. Cd-hit: a fast program for clustering and comparing large sets of protein or nucleotide sequences. Bioinformatics. 2006;22:1658–1659. doi: 10.1093/bioinformatics/btl158. [DOI] [PubMed] [Google Scholar]
- 28.Langmead B, Trapnell C, Pop M, Salzberg SL. Ultrafast and memory-efficient alignment of short DNA sequences to the human genome. Genome Biol. 2009;10:R25. doi: 10.1186/gb-2009-10-3-r25. [DOI] [PMC free article] [PubMed] [Google Scholar]
- 29.Martin M. Cutadapt removes adapter sequences from high-throughput sequencing reads. EMBnet journal. 2011;17:10–12. [Google Scholar]
- 30.Storvall H, Ramsköld D, Sandberg R. Efficient and comprehensive representation of uniqueness for next-generation sequencing by minimum unique length analyses. PLoS ONE. 2013;8:e53822. doi: 10.1371/journal.pone.0053822. [DOI] [PMC free article] [PubMed] [Google Scholar]
Associated Data
This section collects any data citations, data availability statements, or supplementary materials included in this article.


