The optimal iodine contrast-to-noise ratio (CNR) of virtual monoenergetic images with energy domain noise reduction was similar to or better than the CNR of single-energy CT images obtained with optimal tube potential.
Abstract
Purpose
To determine the iodine contrast-to-noise ratio (CNR) for abdominal computed tomography (CT) when using energy domain noise reduction and virtual monoenergetic dual-energy (DE) CT images and to compare the CNR to that attained with single-energy CT at 80, 100, 120, and 140 kV.
Materials and Methods
This HIPAA-compliant study was approved by the institutional review board with waiver of informed consent. A syringe filled with diluted iodine contrast material was placed into 30-, 35-, and 45-cm-wide water phantoms and scanned with a dual-source CT scanner in both DE and single-energy modes with matched scanner output. Virtual monoenergetic images were generated, with energies ranging from 40 to 110 keV in 10-keV steps. A previously developed energy domain noise reduction algorithm was applied to reduce image noise by exploiting information redundancies in the energy domain. Image noise and iodine CNR were calculated. To show the potential clinical benefit of this technique, it was retrospectively applied to a clinical DE CT study of the liver in a 59-year-old male patient by using conventional and iterative reconstruction techniques. Image noise and CNR were compared for virtual monoenergetic images with and without energy domain noise reduction at each virtual monoenergetic energy (in kiloelectron volts) and phantom size by using a paired t test. CNR of virtual monoenergetic images was also compared with that of single-energy images acquired with 80, 100, 120, and 140 kV.
Results
Noise reduction of up to 59% (28.7 of 65.7) was achieved for DE virtual monoenergetic images by using an energy domain noise reduction technique. For the commercial virtual monoenergetic images, the maximum iodine CNR was achieved at 70 keV and was 18.6, 16.6, and 10.8 for the 30-, 35-, and 45-cm phantoms. After energy domain noise reduction, maximum iodine CNR was achieved at 40 keV and increased to 30.6, 25.4, and 16.5. These CNRs represented improvement of up to 64% (12.0 of 18.6) with the energy domain noise reduction technique. For single-energy CT at the optimal tube potential, iodine CNR was 29.1 (80 kV), 21.2 (80 kV), and 11.5 (100 kV). For patient images, 39% (24 of 61) noise reduction and 67% (0.74 of 1.10) CNR improvement were observed with the energy domain noise reduction technique when compared with standard filtered back-projection images.
Conclusion
Iodine CNR for adult abdominal CT may be maximized with energy domain noise reduction and virtual monoenergetic DE CT.
© RSNA, 2015
Introduction
Dual-energy (DE) computed tomography (CT) is used in clinical practice for a number of applications, including urinary stone composition analysis (1–5), detection of tophaceous gout (6–9), automated bone removal with CT angiography (2,10,11), and generation of virtual unenhanced images from contrast material–enhanced images (2,12,13). Multiple techniques have been used to acquire DE CT data, including dual-source CT (14), fast tube potential switching (15), and use of dual-layer detectors (16). In general, DE CT is performed by acquiring projection data with two different x-ray beam spectra. A number of different image types can be generated from the resulting data, including images corresponding to the low- and high-energy spectra, mixed images that represent a linear or nonlinear blending of the low- and high-energy images, material-specific images, and virtual monoenergetic images (17–20).
Although data are acquired by using polyenergetic x-ray beams for DE CT examinations, virtual monoenergetic images can be synthesized (17). These images use DE material decomposition techniques and knowledge of the energy-dependent x-ray attenuation coefficients of various materials to produce images that approximate images acquired by using a monoenergetic x-ray beam (21). The energy of these virtual monoenergetic images can be varied according to the desired clinical applications (21). To increase iodine contrast-to-noise ratio (CNR), lower energies are used. To minimize metal artifacts, higher energies are used (22–26).
Researchers in several studies have evaluated the quality of virtual monoenergetic images and compared this image quality with that attained with conventional single-energy CT. Parameters assessed have included CT number accuracy, iodine contrast, image noise, and iodine CNR (27–31). In general, an intrinsic tradeoff exists between iodine contrast, which is maximized at lower energies, and image noise, which is also maximized at lower energies. Consequently, the optimal monoenergetic energy (in kiloelectron volts) that has the highest CNR depends on patient size and the separation of effective energies of the x-ray spectra, which are determined by the tube potential and beam filtration used for the DE CT scans (28–31). For adult abdominal CT, the preferred energy is around 70 keV and results in iodine CNR values comparable to those of a single-energy 120-kV CT scan (28,30,31). However, these studies did not compare iodine CNR to single-energy CT scans at tube potentials other than 120 kV. Later, Yu et al (29) evaluated the relationship between iodine CNR of virtual monoenergetic images and that of single-energy images as patient size and tube potential varied, noting that although the maximum iodine CNR of virtual monoenergetic images was comparable to that of a 120-kV single-energy scan, it remained lower than that of a single-energy scan performed at other tube potential values, such as 80 or 100 kV (29). For example, in small adults or children, in whom 80-kV scanning is possible, the iodine CNR at 80 kV was superior to the CNR at 120 kV and the maximum achievable iodine CNR using virtual monoenergetic 70-keV images. Thus, it would be better to examine these patients with a single-energy scan at a lower tube potential instead of with a DE scan with virtual monoenergetic imaging. As shown in these studies, maximal iodine CNR occurs around 70 keV. Although images with lower tube potential (<70 keV) have increased contrast, the increased image noise below 70 keV precluded the use of lower energy virtual monoenergetic images, which would have had improved iodine contrast relative to the 80-kV single-energy images.
At DE CT, the radiation dose applied to the patient is distributed into two portions, one of low-energy spectra and one of high-energy spectra. Thus, the low- and high-energy images are each noisier than a single-energy image acquired by using the same total dose as that used for DE CT scanning. In clinical practice, a set of mixed-energy images is commonly generated that combines the low- and high-energy images to create a single image set that has an appearance similar to that of a single-energy image (19). These mixed images make use of all doses applied to the patient and hence have lower noise levels compared with the low- or high-energy images alone (however, they lack the energy-specific information contained in the low- and high-energy images). Substantial redundant information exists between the low-energy, high-energy, and mixed-energy images because they are all representations of the same anatomic structures. Leng et al (32) previously reported an energy domain noise reduction technique that reduced noise in the energy-specific images by exploiting this information redundancy. Their specific implementation used a technique referred to as Local Reconstruction of HighlY constrained back PRojection, or HYPR-LR, which was initially developed for magnetic resonance imaging and later adapted for CT (32–34). However, a number of different filtering or reconstruction techniques, including compressed sensing, could have been applied equally well, provided the energy domain information redundancy was used to reduce image noise. Specifically, Leng et al (32) showed the ability to lower the image noise on low- and high-energy images to the level achieved in the mixed-energy images, which make use of all available photons and not just those at one tube potential. Since noise reduction is performed in the energy domain, spatial resolution is well maintained. In the study by Leng et al (32), modulated transfer functions before and after the energy domain noise reduction were compared and were found to match each other well. In the current study, we used the technique described by Leng et al (35) to reduce image noise on DE virtual monoenergetic images as opposed to on low- and high-energy images in an attempt to achieve improved iodine CNR for abdominal CT imaging (35). The purpose of this study was to determine the iodine CNR for abdominal CT when using energy domain noise reduction and virtual monoenergetic DE CT images and to compare the CNR to that attained with single-energy CT at 80, 100, 120, and 140 kV (36,37).
Materials and Methods
All authors have a patent pending (publication number WO2012009725 A1) on the technology described in this article. This Health Insurance Portability and Accountability Act–compliant study was approved by our institutional review board, with waiver of informed consent.
Phantom Experiments
Three torso-shaped water phantoms of varying sizes (lateral widths of 30, 35 and 45 cm) were used to simulate the attenuation of an adult abdomen for small, medium, and large patients, respectively (Fig 1). Three syringes filled with 5, 10, and 20 mg/mL of iodinated contrast material were placed in each of the three phantoms to simulate contrast-enhanced lesions. All phantoms were scanned with a 128-section dual-source CT scanner (Definition Flash; Siemens Healthcare, Forchheim, Germany) and both single-energy and DE CT protocols.
Figure 1:
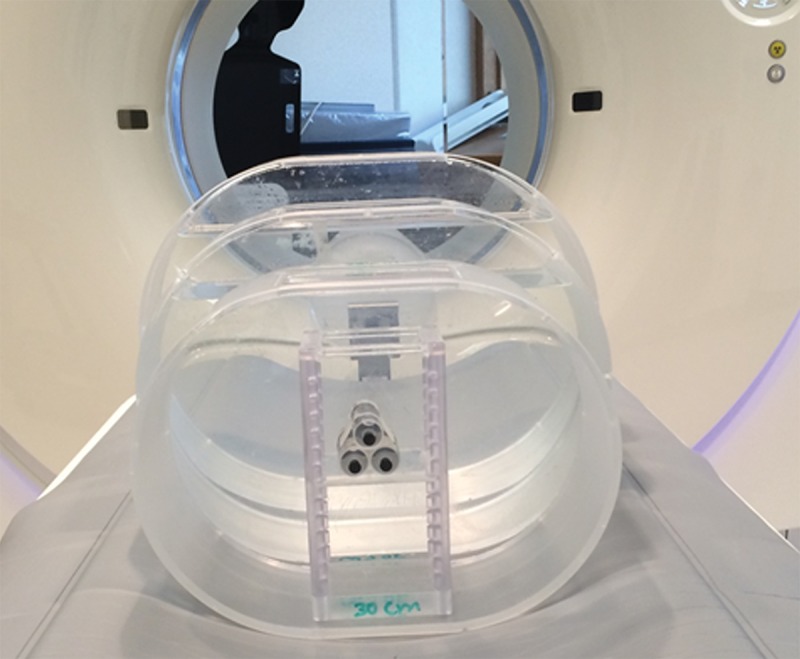
Phantom set-up. Three torso-shaped water phantoms were used to simulate the attenuation of adult abdomens, and syringes filled with iodine solution were used to simulate contrast-enhanced lesions.
Single-energy CT images were acquired by using a routine abdomen CT protocol. Technique factors included a tube potential of 120 kV, a gantry rotation time of 0.5 second, a collimation of 128 × 0.6 mm, and a helical pitch of 0.6. Automatic exposure control (CareDose4D; Siemens Healthcare) was used with a quality reference milliampere-second (QRM) setting of 240 mAs. The QRM sets the effective milliampere-second setting (tube current times rotation time divided by pitch) for a standard-size patient (70-kg adult). For other patients, the system automatically adjusts scanner output based on patient size and attenuation (ie, increases scanner output from the QRM for larger patients and decreases scanner output from the QRM for smaller patients). Phantoms were scanned at 80, 100, 120, and 140 kV with the routine abdomen technique factors, except the QRM was adjusted at 80, 100, and 140 kV so that the volume CT dose index (CTDIvol) was the same at each phantom size (7.0, 11.0, and 21.0 mGy for the 30, 35, and 45-cm phantoms, respectively). Images were reconstructed by using 5-mm image thickness and a 3-mm image increment, a 200-mm field of view, and a medium-smooth body kernel (B30).
For DE scans, our routine DE abdomen CT protocol was used. Technique factors included an 80-kV tube potential for the low-energy beam and a 140-kV tube potential for the high-energy beam. Additionally, a tin filter was present in the high-energy beam to improve the spectral separation between it and the 80-kV beam (38). Phantoms were scanned with CTDIvol matched to the single-energy examinations by using the following scanning parameters: a 0.5-second rotation time, 32 × 0.6 collimation, and 0.45 helical pitch. Automatic exposure control (CareDose4D; Siemens Healthcare) was used, and the QRM was adjusted so that the CTDIvol for the DE scan matched that of the single-energy scans for the respective phantom size. Images were reconstructed with a 5-mm image thickness, 3-mm image increment, 200-mm field of view, and medium-smooth body kernel appropriate for DE processing (D30). The spatial resolutions of D30 and B30 are the same.
Virtual monoenergetic images were generated from 40 to 110 keV at 10-keV intervals by using commercial software (syngo Dual-Energy, version VA40; Siemens Healthcare). Digital Imaging and Communications in Medicine, or DICOM, images were saved to a personal computer where the energy domain noise reduction algorithm was applied to the virtual monoenergetic images to reduce image noise. A circular region of interest with a 16-mm diameter was placed at the location of the 10 mg/mL iodine solution, and the mean CT number was recorded as the iodine signal (CT#Iodine). A second circular region of interest of the same size was placed in the background water region close to the iodine syringes. The CT number (CT#water) and image noise (SDwater, standard deviation of CT numbers) of the background water were measured. Iodine CNR was calculated as follows:
CNR was calculated for each set of single-energy images and the DE virtual monoenergetic images before and after energy domain noise reduction. For both noise and CNR, measurements were repeated for seven consecutive images, and the mean and standard deviation of the measured value (noise or CNR) were reported. This could be performed because cylindrical phantoms were used in this study, making images along the longitudinal direction the same except for variations caused by the statistical nature of x-ray interactions.
Visual Demonstration of Potential Clinical Benefit
Image data were retrospectively collected after institutional review board approval from a clinically indicated triple-phase CT examination of the liver. The patient was a 59-year-old man with multifocal hepatocellular carcinoma that had been treated with chemoembolization, with treatment response in the size of the largest lesion and no change in the size of lesions at other imaging. CT revealed interval growth of one nodule to 1.1 cm from 0.5 cm. The patient underwent subsequent chemoembolization the next day and liver transplantation 7 weeks later. Pathologic analysis enabled us to confirm multifocal hepatocellular carcinoma in the right lobe. The lateral width of the patient at the level of the liver was 38 cm; hence, he was scanned with the abdominal DE CT protocol for larger patients with the following parameters: 100 kV and 240 mAs (effective) for the tube potential and QRM of the low-energy tube, respectively; 140 kV plus tin filter and 185 mAs (effective) for the tube potential and QRM of the high-energy beam, respectively; and 0.5-second rotation, 32 × 0.6-mm collimation, and helical pitch of 0.6. Automatic exposure control (CareDose 4D; Siemens Healthcare) was turned on. The CTDIvol was 9.35 mGy, and size-specific dose estimate, or SSDE, was 11.3 mGy. Images were reconstructed with an image thickness of 3 mm, an image increment of 2 mm, a field of view appropriate to the patient size, and a medium-smooth body DE kernel (D30).
Because the energy domain noise reduction technique does not filter in the spatial or temporal domain, its benefit is additive to other image noise reduction techniques, such as iterative reconstruction algorithms, that do not operate in the energy domain. To demonstrate this effect, we also reconstructed the patient images by using a commercial iterative reconstruction algorithm (SAFIRE; Siemens Healthcare). A Q30 kernel with a strength of three, which matches the spatial resolution of the D30 kernel, was used. The rest of the reconstruction parameters were the same as the filtered-back projection (FBP) images.
For both FBP and iteratively reconstructed images, virtual monoenergetic images were generated from 40 to 110 keV in 10-keV increments by using the aforementioned commercial DE software. Energy domain noise reduction was performed for the virtual monoenergetic images. Image quality was subjectively assessed and compared between the virtual monoenergetic images with and without energy domain noise reduction for both the FBP and iteratively reconstructed data sets. In addition, circular regions of interest were drawn on the liver parenchyma and liver lesion to measure CT numbers and image noise, and CNR was calculated as the difference in CT number between the lesion and parenchyma divided by the image noise at the parenchyma. Noise and CNR were compared between 50-keV virtual monoenergetic images before and after energy domain noise reduction.
Statistical Analysis
Image noise was compared for the virtual monoenergetic images with and without energy domain noise reduction by using a paired t test in Excel (Microsoft, Seattle, Wash). P < .05 was considered to indicate a significant difference. The percentage reduction of image noise was calculated for each monoenergetic image energy and phantom size. A similar comparison was also performed for CNR of the virtual monoenergetic images with and without energy domain noise reduction. For a given phantom size, maximal CNR and its corresponding energy from the virtual monoenergetic images were calculated. Maximal CNR was also compared with that of single-energy CT at 80, 100, 120, and 140 kV.
Results
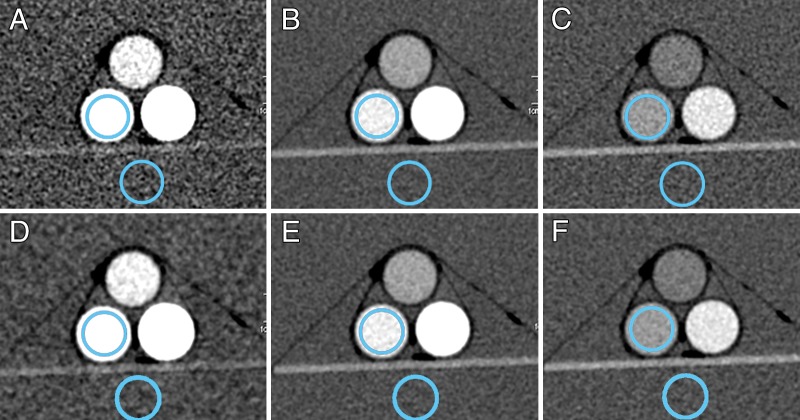
Virtual monoenergetic images at 50, 70, and 100 keV are shown both before (Fig 2, A–C) and after (Fig 2, D–F) the application of energy domain noise reduction. Although the iodine signal is highest at 50 keV, the uncorrected virtual monoenergetic image (Fig 2, A) is substantially noisier. After application of energy domain noise reduction (Fig 2, D), the image noise is reduced, making it more similar to that on the 70- and 100-keV images.
Figure 2:
Virtual monoenergetic images of the 35-cm phantom at, A, D, 50; B, E, 70; and, C, F, 100 keV before (A–C) and after (D–F ) energy domain noise reduction. Locations of circular regions of interest over the 10 mg/mL iodine solution and water background are shown.
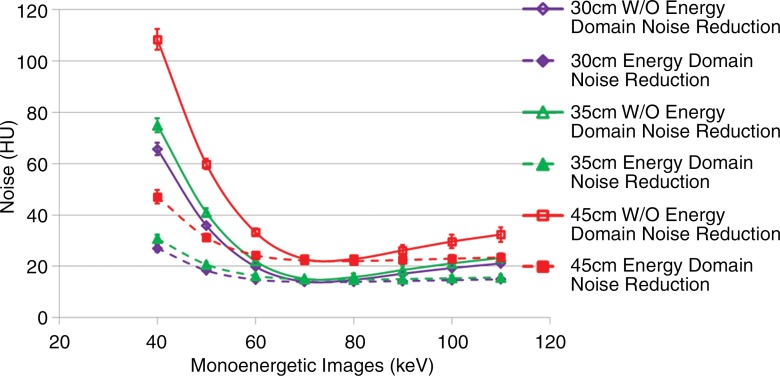
The relationship between image noise and the virtual monoenergetic image is shown in Figure 3 for each of the three phantom sizes evaluated. Starting at 40 keV, image noise rapidly decreases; it reaches a minimum around 70 keV and then increases more slowly as energy increases. After application of energy domain noise reduction, image noise is significantly reduced at lower and higher image energies for all three phantom sizes (P values ranged from 5.7 × 10⁻¹⁰ to 2.8 × 10⁻²). The amount of noise reduction is highly dependent on the energy selected and only somewhat dependent on phantom size, with the most prominent noise reduction occurring between 40 and 60 keV. At 60 keV, noise was reduced by 25% (from 19.8 HU to 14.8 HU), 26% (from 22.1 HU to 16.3 HU), and 27% (from 33.3 HU to 24.4 HU) for 30-, 35-, and 45-cm phantoms, respectively. At 40 keV, image noise was reduced by 59% (from 65.7 HU to 27.0 HU), 59% (from 75.0 HU to 30.7 HU), and 57% (from 108.4 HU to 47.1 HU) for 30-, 35-, and 45-cm phantoms, respectively. Noise was also reduced on the higher energy images (90 and 110 keV), with noise reduction of 17% (from 17.1 HU to 14.2 HU), 19% (from 18.5 HU to 15.0 HU), and 14% (from 26.2 HU to 22.4 HU) at 90 keV for 30-, 35-, and 45-cm phantoms, respectively, and 29% (from 21.1 HU to 14.9 HU), 33% (from 23.3 HU to 15.7 HU), and 28% (from 32.4 HU to 23.4 HU) at 110 keV for 30-, 35-, and 45-cm phantoms, respectively. Minimal noise reduction is observed at 70 keV (1% [from 14.0 HU to 13.9 HU], 1% [from 15.1 HU to 14.9 HU], and 3% [from 22.8 HU to 22.2 HU]) and 80 keV (5% [from 14.7 HU to 13.9 HU], 6% [from 15.8 HU to 14.8 HU], and 4% [from 22.8 HU to 22.0 HU]).
Figure 3:
Graph shows image noise of DE virtual monoenergetic images before and after energy domain noise reduction for three phantom sizes and eight energy settings. Error bars = standard deviation, W/O = without.
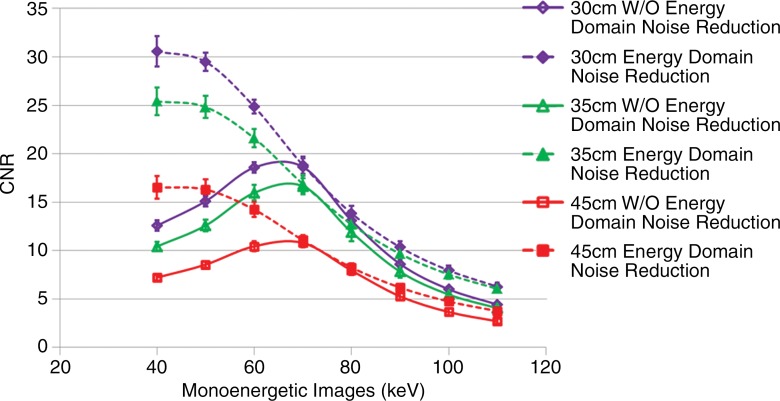
When one takes into account the changes in noise and iodine attenuation at the different energies, the changes in iodine CNR as a function of image energy are shown in Figure 4. Starting at 40 keV, iodine CNR first increases for the unprocessed images, reaching a maximum at around 60–70 keV, and then decreases as the image energy increases further. With use of energy domain noise reduction, the iodine CNR was significantly increased compared with the unprocessed images at every image energy P values ranged from 8.2 × 10⁻¹⁰ to 2.7 × 10⁻². Similar to the results for image noise, the greatest improvement in iodine CNR was observed at the lower and higher image energies, with only minor improvement at 70 to 80 keV. While the maximum iodine CNR was at approximately 70 keV for the unprocessed images, use of energy domain noise reduction moves the position of the maximum iodine CNR to approximately 40 keV, which is much closer to the k edge of iodine at 33 keV. For each of the three phantom sizes, the maximum achievable iodine CNR increased substantially, from 64% in the 30-cm phantom to 53% in the 45-cm phantom.
Figure 4:
Graph shows iodine CNR of DE virtual monoenergetic images before and after domain noise reduction for three phantom sizes and at eight image energies. Error bars = standard deviation, W/O = without.
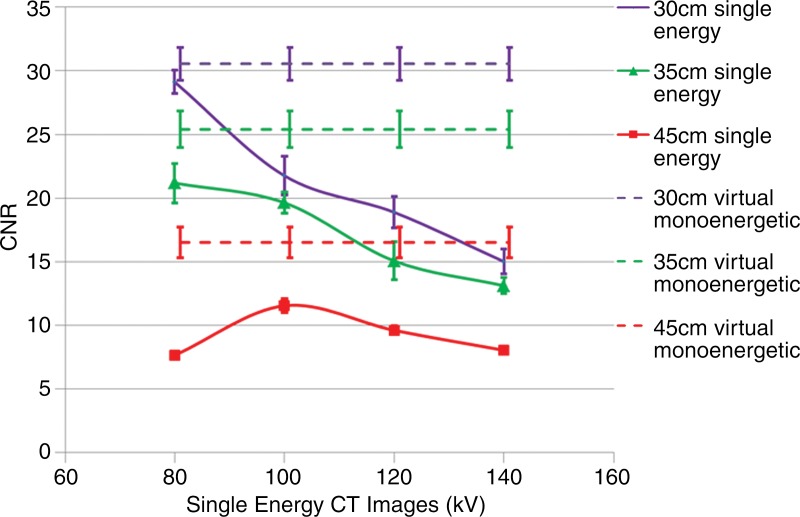
Figure 5 provides a comparison of the iodine CNR achieved at four tube potentials for a single-energy CT acquisition and the maximum achievable iodine CNR for the DE virtual monoenergetic images after use of energy domain noise reduction. For each phantom size, the maximum iodine CNR is achieved by using the noise-reduced DE virtual monoenergetic images. The Table summarizes the maximum iodine CNR values achieved by using the three phantom sizes.
Figure 5:
Graph shows the iodine CNR of single-energy images at each of the four tube potentials (80–140 kV ) for each of the three phantom sizes. The maximum iodine CNR for any given phantom size achieved with single-energy scanning is less than the maximum CNR achieved by using virtual monoenergetic DE CT images with energy domain noise reduction (horizontal lines). Error bars = standard deviation.
Maximal Iodine CNR on DE Virtual Monoenergetic Images before and after Application of Energy Domain Noise Reduction and Comparison with That Achieved with Single-Energy CT at Optimal Tube Potential

Note.—Unless otherwise indicated, data are CNRs.
* At 80 kV.
† At 100 kV.
The potential benefit of using the knowledge gained in the phantom study is shown in Figure 6. The low- and high-energy image (Fig 6a) and the mixed-energy image (Fig 6b) from the patient with two hyperenhancing lesions are compared with virtual monoenergetic images at 50 keV without (Fig 6c) and with (Fig 6d) energy domain noise reduction by using the standard FBP reconstruction algorithm. Noise reduction can be seen clearly on the 50-keV images. The hyperattenuating lesions are much more conspicuous on the 50-keV image than on the mixed-energy image because of the increased iodine hyperattenuation. Measurements showed 39% noise reduction (from 61 HU to 37 HU) and 67% CNR improvement (from 1.10 to 1.84). The additive nature of the energy domain noise reduction technique and a spatial domain noise reduction technique is shown in Figure 7. The 50-keV images were reconstructed by using an iterative reconstruction algorithm without (Fig 7a) and with (Fig 7b) the energy domain noise reduction. When compared with the FBP image in Figure 6, the image obtained with iterative reconstruction shows decreased image noise prior to application of energy domain noise reduction (Fig 7a). Further improvement is achieved after application of energy domain noise reduction (Fig 7b). Measurements showed 44% noise reduction (from 43 HU to 24 HU) and 67% CNR improvement (from 1.30 to 2.25).
Figure 6a:
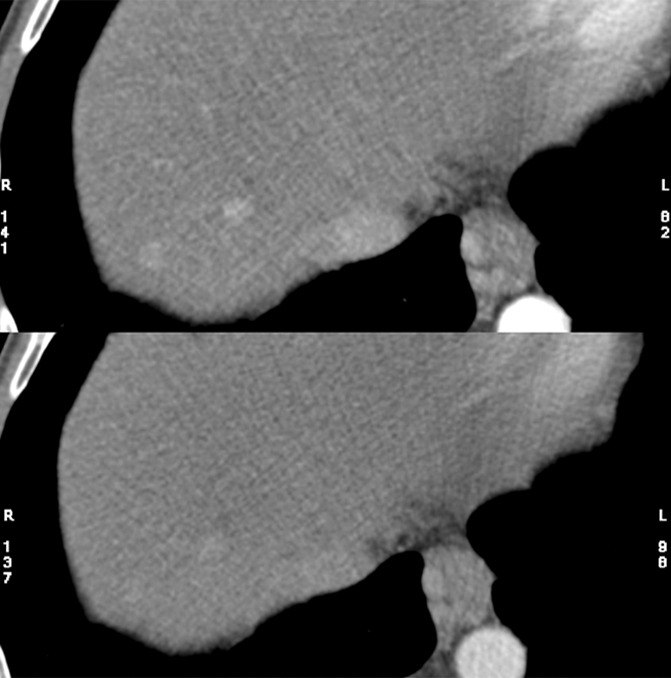
Clinical CT images in a 59-year-old male patient with hyperattenuating liver lesion (arrow) obtained with the same window width and level settings (520/130). (a) Source low-energy (top) and high-energy (bottom) images. (b) Mixed image. (c, d) Virtual 50-keV monoenergetic images without (c) and with (d) energy domain noise reduction obtained with a standard FBP reconstruction algorithm.
Figure 6b:
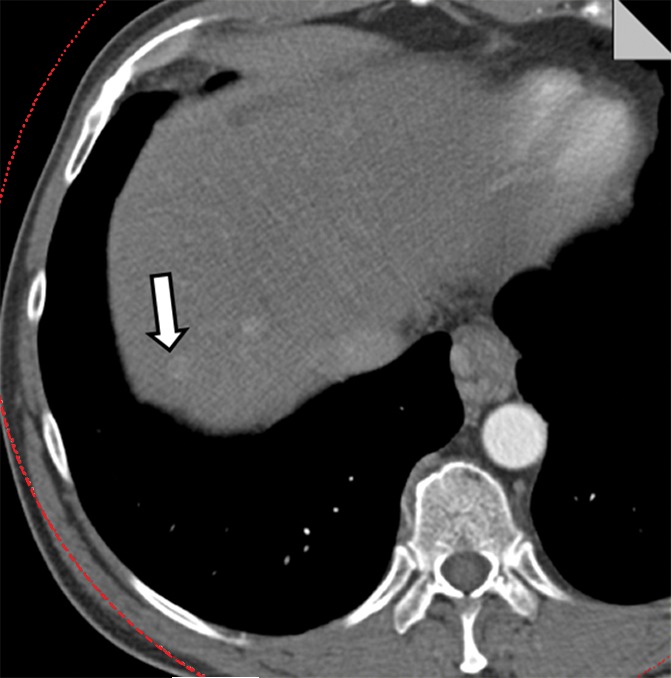
Clinical CT images in a 59-year-old male patient with hyperattenuating liver lesion (arrow) obtained with the same window width and level settings (520/130). (a) Source low-energy (top) and high-energy (bottom) images. (b) Mixed image. (c, d) Virtual 50-keV monoenergetic images without (c) and with (d) energy domain noise reduction obtained with a standard FBP reconstruction algorithm.
Figure 6c:
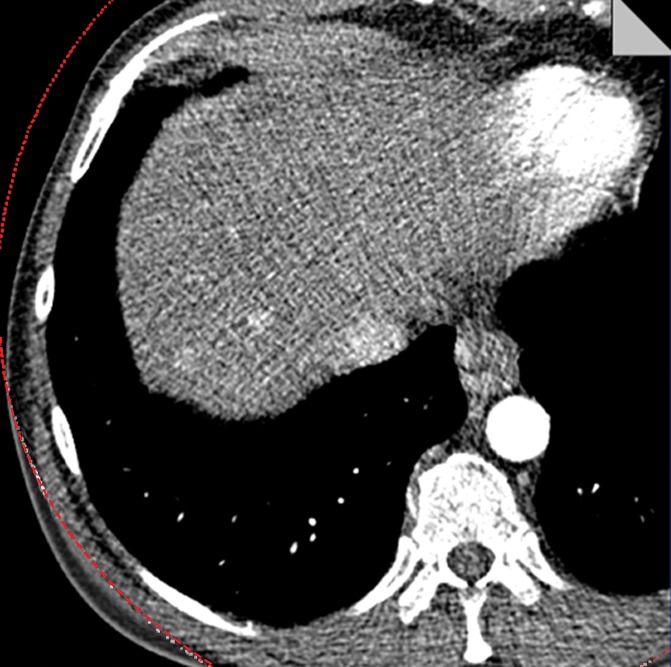
Clinical CT images in a 59-year-old male patient with hyperattenuating liver lesion (arrow) obtained with the same window width and level settings (520/130). (a) Source low-energy (top) and high-energy (bottom) images. (b) Mixed image. (c, d) Virtual 50-keV monoenergetic images without (c) and with (d) energy domain noise reduction obtained with a standard FBP reconstruction algorithm.
Figure 6d:

Clinical CT images in a 59-year-old male patient with hyperattenuating liver lesion (arrow) obtained with the same window width and level settings (520/130). (a) Source low-energy (top) and high-energy (bottom) images. (b) Mixed image. (c, d) Virtual 50-keV monoenergetic images without (c) and with (d) energy domain noise reduction obtained with a standard FBP reconstruction algorithm.
Figure 7a:
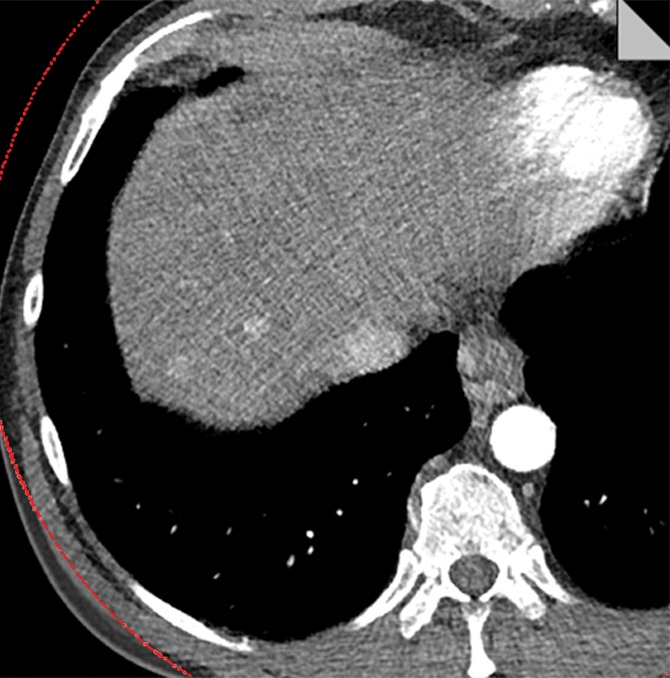
Virtual 50-keV monoenergetic images obtained with an iterative reconstruction algorithm (a) without and (b) with energy domain noise reduction.
Figure 7b:

Virtual 50-keV monoenergetic images obtained with an iterative reconstruction algorithm (a) without and (b) with energy domain noise reduction.
Discussion
A virtual monoenergetic image can be synthesized from DE CT data and can yield an image set that mimics images acquired with a monoenergetic x-ray beam. One major advantage of a virtual monoenergetic image is the increased iodine attenuation at lower monoenergetic energy, which may increase the visibility of low-contrast lesions, such as hyper- or hypoattenuating liver lesions. In this study, we investigated image noise and iodine CNR of virtual monoenergetic images at different energy settings and phantom sizes before and after application of an energy domain noise reduction algorithm. Our data showed that without the energy domain noise reduction algorithm, image noise increased substantially with lower monoenergetic settings, and the maximal CNR was achieved at approximately 70 keV. The maximal CNR of the virtual monoenergetic image at 70 keV, although higher than that of 120-kV single-energy images, is lower than that of 80- and 100-kV single-energy images. These findings were similar to those in other studies reported in the literature (28–31). Thus, a single-energy scan with optimal tube potential is preferred over a DE scan with virtual monoenergetic images if other DE processing is not desired (21).
After applying the energy domain noise reduction, substantial noise reduction and CNR improvement have been achieved; the specific amount of CNR improvement depends on the monoenergetic setting. Noise reduction is more prominent at a setting lower than 60 keV and higher than 90 keV. The CNR improvement is more substantial for lower monoenergetic images in which contrast is maintained, while noise is substantially reduced. Importantly, the maximal CNR of virtual monoenergetic images is shifted from 70 and 80 keV for the original images to 40 and 50 keV after noise reduction. Additionally, the maximal CNR of these images is comparable to or higher than that of single-energy images at optimal tube potential, which is dependent on patient size (eg, 80 or 100 kV for pediatric patients and small adults, 120 kV for most adults, and 140 kV for very large adults). Thus, patients can undergo scanning with DE CT with similar or higher CNR compared with single-energy CT while simultaneously receiving the benefit of material differentiation capabilities.
Since the noise reduction algorithm used in this study is applied only in energy domain, the benefit of this algorithm is additive to that of image domain noise reduction techniques, such as denoising methods and iterative reconstruction algorithms. As shown on the patient images, the combination of an iterative reconstruction algorithm with the energy domain noise reduction algorithm enables further noise reduction. Although the HYPR-LR technique was used in this study, other algorithms can be used to reduce noise on virtual monoenergetic images by following the general concept of exploiting energy domain redundancy, such as prior image-constrained compressed sensing, or PICCS, nonconvex PICCS, or NC-PICCS, and multiband filtration (39–41).
There were several limitations to this study. The first limitation was that this study mainly focused on phantom studies to show the application of the energy domain noise reduction technique in virtual monoenergetic images. One set of patient data was shown as an example of using this method in clinical cases. However, a thorough clinical study with more cases is warranted in the future study. The second limitation was that only one DE technique (ie, dual-source DE) was tested. However, the energy domain noise reduction technique used in this study is implemented in the image domain and can be directly applied to the images generated by other DE techniques, such as fast tube potential switching and dual-layer detector. The third limitation was that the statistical analysis was based on seven consecutive images rather than on use of random-order images, which might have permitted the possibility of bias. However, the likelihood of this bias was small, given the fact that the paired t tests performed in our study showed significant improvement of both image noise and CNR in all scenarios.
In conclusion, we have shown the application of an energy domain noise reduction technique for DE virtual monoenergetic images. Substantial noise reduction and CNR improvement have been achieved for lower-energy images. The optimal iodine CNR of virtual monoenergetic images with energy domain noise reduction was similar to or better than the CNR of single-energy CT images obtained with optimal tube potential.
Advances in Knowledge
■ Noise reduction of up to 59% (28.7 of 65.7) and contrast-to-noise ratio (CNR) improvement of up to 64% (12.0 of 18.6) are achieved on dual-energy virtual monoenergetic images by using an energy domain noise reduction technique.
■ The maximal CNR of virtual monoenergetic images is shifted from 70 and 80 keV of the original images to 40 and 50 keV after the energy domain noise reduction.
■ The maximal CNR of virtual monoenergetic images with energy domain noise reduction is comparable to or higher than that of single-energy images obtained with optimal tube potential.
Implication for Patient Care
■ Lower image noise and higher CNR on dual-energy virtual monoenergetic images result in improved image quality.
Received April 10, 2014; revision requested May 19; revision received October 24; accepted December 2; final version accepted January 15, 2015.
Funding: This research was supported by the National Institutes of Health (grant EB016966).
Abbreviations:
- CNR
- contrast-to-noise ratio
- CTDIvol
- volume CT dose index
- DE
- dual energy
- FBP
- filtered-back projection
- QRM
- quality reference milliampere-second
Disclosures of Conflicts of Interest: S.L. Activities related to the present article: has a patent pending for the technology described herein. Activities not related to the present article: none to disclose. Other relationships: none to disclose. L.Y. Activities related to the present article: has a patent pending for the technology described herein. Activities not related to the present article: none to disclose. Other relationships: none to disclose. J.G.F. Activities related to the present article: has a patent pending for the technology described herein. Activities not related to the present article: none to disclose. Other relationships: none to disclose. C.H.M. Activities related to the present article: has a patent pending for the technology described herein. Activities not related to the present article: received a grant from Siemens Healthcare. Other relationships: none to disclose.
References
- 1.Primak AN, Fletcher JG, Vrtiska TJ, et al. Noninvasive differentiation of uric acid versus non-uric acid kidney stones using dual-energy CT. Acad Radiol 2007;14(12):1441–1447. [DOI] [PMC free article] [PubMed] [Google Scholar]
- 2.Johnson TR, Krauss B, Sedlmair M, et al. Material differentiation by dual energy CT: initial experience. Eur Radiol 2007;17(6):1510–1517. [DOI] [PubMed] [Google Scholar]
- 3.Graser A, Johnson TR, Bader M, et al. Dual energy CT characterization of urinary calculi: initial in vitro and clinical experience. Invest Radiol 2008;43(2):112–119. [DOI] [PubMed] [Google Scholar]
- 4.Qu M, Ramirez-Giraldo JC, Leng S, et al. Dual-energy dual-source CT with additional spectral filtration can improve the differentiation of non-uric acid renal stones: an ex vivo phantom study. AJR Am J Roentgenol 2011;196(6):1279–1287. [DOI] [PMC free article] [PubMed] [Google Scholar]
- 5.Boll DT, Patil NA, Paulson EK, et al. Renal stone assessment with dual-energy multidetector CT and advanced postprocessing techniques: improved characterization of renal stone composition—pilot study. Radiology 2009;250(3):813–820. [DOI] [PubMed] [Google Scholar]
- 6.Glazebrook KN, Guimarães LS, Murthy NS, et al. Identification of intraarticular and periarticular uric acid crystals with dual-energy CT: initial evaluation. Radiology 2011;261(2):516–524. [DOI] [PubMed] [Google Scholar]
- 7.Nicolaou S, Yong-Hing CJ, Galea-Soler S, Hou DJ, Louis L, Munk P. Dual-energy CT as a potential new diagnostic tool in the management of gout in the acute setting. AJR Am J Roentgenol 2010;194(4):1072–1078. [DOI] [PubMed] [Google Scholar]
- 8.Choi HK, Al-Arfaj AM, Eftekhari A, et al. Dual energy computed tomography in tophaceous gout. Ann Rheum Dis 2009;68(10):1609–1612. [DOI] [PubMed] [Google Scholar]
- 9.Desai MA, Peterson JJ, Garner HW, Kransdorf MJ. Clinical utility of dual-energy CT for evaluation of tophaceous gout. RadioGraphics 2011;31(5):1365–1375; discussion 1376–1377. [DOI] [PubMed] [Google Scholar]
- 10.Watanabe Y, Uotani K, Nakazawa T, et al. Dual-energy direct bone removal CT angiography for evaluation of intracranial aneurysm or stenosis: comparison with conventional digital subtraction angiography. Eur Radiol 2009;19(4):1019–1024. [DOI] [PubMed] [Google Scholar]
- 11.Uotani K, Watanabe Y, Higashi M, et al. Dual-energy CT head bone and hard plaque removal for quantification of calcified carotid stenosis: utility and comparison with digital subtraction angiography. Eur Radiol 2009;19(8):2060–2065. [DOI] [PubMed] [Google Scholar]
- 12.Graser A, Johnson TR, Chandarana H, Macari M. Dual energy CT: preliminary observations and potential clinical applications in the abdomen. Eur Radiol 2009;19(1):13–23. [DOI] [PubMed] [Google Scholar]
- 13.Zhang LJ, Peng J, Wu SY, et al. Liver virtual non-enhanced CT with dual-source, dual-energy CT: a preliminary study. Eur Radiol 2010;20(9):2257–2264. [DOI] [PubMed] [Google Scholar]
- 14.Flohr TG, McCollough CH, Bruder H, et al. First performance evaluation of a dual-source CT (DSCT) system. Eur Radiol 2006;16(2):256–268. [DOI] [PubMed] [Google Scholar]
- 15.Xu D, Langan D, Wu X, et al. Dual energy CT via fast kVp switching spectrum estimation. Proc SPIE 2009;7258:72583T. [Google Scholar]
- 16.Boll DT, Merkle EM, Paulson EK, Fleiter TR. Coronary stent patency: dual-energy multidetector CT assessment in a pilot study with anthropomorphic phantom. Radiology 2008;247(3):687–695. [DOI] [PubMed] [Google Scholar]
- 17.Alvarez RE, Seppi E. A comparison of noise and dose in conventional and energy selective computed tomography. IEEE Trans Nucl Sci 1979;26(2):2853–2856. [Google Scholar]
- 18.Hartman R, Kawashima A, Takahashi N, et al. Applications of dual-energy CT in urologic imaging: an update. Radiol Clin North Am 2012;50(2):191–205, v. [DOI] [PubMed] [Google Scholar]
- 19.Yu L, Primak AN, Liu X, McCollough CH. Image quality optimization and evaluation of linearly mixed images in dual-source, dual-energy CT. Med Phys 2009;36(3):1019–1024. [DOI] [PMC free article] [PubMed] [Google Scholar]
- 20.Holmes DR, 3rd, Fletcher JG, Apel A, et al. Evaluation of non-linear blending in dual-energy computed tomography. Eur J Radiol 2008;68(3):409–413. [DOI] [PMC free article] [PubMed] [Google Scholar]
- 21.Yu L, Leng S, McCollough CH. Dual-energy CT-based monochromatic imaging. AJR Am J Roentgenol 2012;199(5 Suppl):S9–S15. [DOI] [PubMed] [Google Scholar]
- 22.Bamberg F, Dierks A, Nikolaou K, Reiser MF, Becker CR, Johnson TR. Metal artifact reduction by dual energy computed tomography using monoenergetic extrapolation. Eur Radiol 2011;21(7):1424–1429. [DOI] [PubMed] [Google Scholar]
- 23.Lee YH, Park KK, Song HT, Kim S, Suh JS. Metal artefact reduction in gemstone spectral imaging dual-energy CT with and without metal artefact reduction software. Eur Radiol 2012;22(6):1331–1340. [DOI] [PubMed] [Google Scholar]
- 24.Pessis E, Campagna R, Sverzut JM, et al. Virtual monochromatic spectral imaging with fast kilovoltage switching: reduction of metal artifacts at CT. RadioGraphics 2013;33(2):573–583. [DOI] [PubMed] [Google Scholar]
- 25.Lewis M, Reid K, Toms AP. Reducing the effects of metal artefact using high keV monoenergetic reconstruction of dual energy CT (DECT) in hip replacements. Skeletal Radiol 2013;42(2):275–282. [DOI] [PubMed] [Google Scholar]
- 26.Yuan R, Shuman WP, Earls JP, et al. Reduced iodine load at CT pulmonary angiography with dual-energy monochromatic imaging: comparison with standard CT pulmonary angiography—a prospective randomized trial. Radiology 2012;262(1):290–297. [DOI] [PubMed] [Google Scholar]
- 27.Goodsitt MM, Christodoulou EG, Larson SC. Accuracies of the synthesized monochromatic CT numbers and effective atomic numbers obtained with a rapid kVp switching dual energy CT scanner. Med Phys 2011;38(4):2222–2232. [DOI] [PubMed] [Google Scholar]
- 28.Matsumoto K, Jinzaki M, Tanami Y, Ueno A, Yamada M, Kuribayashi S. Virtual monochromatic spectral imaging with fast kilovoltage switching: improved image quality as compared with that obtained with conventional 120-kVp CT. Radiology 2011;259(1):257–262. [DOI] [PubMed] [Google Scholar]
- 29.Yu L, Christner JA, Leng S, Wang J, Fletcher JG, McCollough CH. Virtual monochromatic imaging in dual-source dual-energy CT: radiation dose and image quality. Med Phys 2011;38(12):6371–6379. [DOI] [PMC free article] [PubMed] [Google Scholar]
- 30.Pinho DF, Kulkarni NM, Krishnaraj A, Kalva SP, Sahani DV. Initial experience with single-source dual-energy CT abdominal angiography and comparison with single-energy CT angiography: image quality, enhancement, diagnosis and radiation dose. Eur Radiol 2013;23(2):351–359. [DOI] [PubMed] [Google Scholar]
- 31.Zhang D, Li X, Liu B. Objective characterization of GE discovery CT750 HD scanner: gemstone spectral imaging mode. Med Phys 2011;38(3):1178–1188. [DOI] [PubMed] [Google Scholar]
- 32.Leng S, Yu L, Wang J, Fletcher JG, Mistretta CA, McCollough CH. Noise reduction in spectral CT: reducing dose and breaking the trade-off between image noise and energy bin selection. Med Phys 2011;38(9):4946–4957. [DOI] [PubMed] [Google Scholar]
- 33.Mistretta CA, Wieben O, Velikina J, et al. Highly constrained backprojection for time-resolved MRI. Magn Reson Med 2006;55(1):30–40. [DOI] [PMC free article] [PubMed] [Google Scholar]
- 34.Johnson KM, Velikina J, Wu Y, Kecskemeti S, Wieben O, Mistretta CA. Improved waveform fidelity using local HYPR reconstruction (HYPR LR). Magn Reson Med 2008;59(3):456–462. [DOI] [PMC free article] [PubMed] [Google Scholar]
- 35.Leng S, Christner J, Yu L, McCollough C. Application of an energy domain noise reduction technique to virtual monoenergetic images: image quality assessment and comparison with single energy CT [abstr]. In: Radiological Society of North America Scientific Assembly and Annual Meeting Program. Oak Brook, Ill: Radiological Society of North America, 2012; 201. [Google Scholar]
- 36.Yu L, Li H, Fletcher JG, McCollough CH. Automatic selection of tube potential for radiation dose reduction in CT: a general strategy. Med Phys 2010;37(1):234–243. [DOI] [PubMed] [Google Scholar]
- 37.Yu L, Fletcher JG, Grant KL, et al. Automatic selection of tube potential for radiation dose reduction in vascular and contrast-enhanced abdominopelvic CT. AJR Am J Roentgenol 2013;201(2):W297–W306. [DOI] [PubMed] [Google Scholar]
- 38.Primak AN, Ramirez Giraldo JC, Liu X, Yu L, McCollough CH. Improved dual-energy material discrimination for dual-source CT by means of additional spectral filtration. Med Phys 2009;36(4):1359–1369. [DOI] [PMC free article] [PubMed] [Google Scholar]
- 39.Chen GH, Tang J, Leng S. Prior image constrained compressed sensing (PICCS): a method to accurately reconstruct dynamic CT images from highly undersampled projection data sets. Med Phys 2008;35(2):660–663. [DOI] [PMC free article] [PubMed] [Google Scholar]
- 40.Ramirez-Giraldo JC, Trzasko J, Leng S, Yu L, Manduca A, McCollough CH. Nonconvex prior image constrained compressed sensing (NCPICCS): theory and simulations on perfusion CT. Med Phys 2011;38(4):2157–2167. [DOI] [PMC free article] [PubMed] [Google Scholar]
- 41.Liu X, Primak AN, Yu L, et al. Quantitative evaluation of noise reduction algorithms for very low dose renal CT perfusion imaging. In: Samei E, Hsieh J, eds. Proceedings of SPIE: medical imaging 2009—physics of medical imaging. Vol 7258. Bellingham, Wash: International Society for Optical Engineering, 2009; 72581T. [Google Scholar]


