

Abstract
Purpose
The outer nuclear layer (ONL) contains photoreceptor nuclei, and its thickness is an important biomarker for retinal degenerations. Accurate ONL thickness measurements are obscured in standard optical coherence tomography (OCT) images because of Henle fiber layer (HFL). Improved differentiation of the ONL and HFL boundary is made possible by using Directional OCT (D-OCT), a method that purposefully varies the pupil entrance position of the OCT beam.
Methods
Fifty-seven normal eyes were imaged using multiple pupil entry positions with a commercial SDOCT system. Cross-sectional image sets were registered to each other, and segmented at the top of HFL, the border of HFL and the ONL and at the external limiting membrane. Thicknesses of the ONL and HFL were measured and analyzed.
Results
The true ONL and HFL thicknesses varied substantially by eccentricity and between individuals. The true macular ONL thickness comprised an average of 54.6% of measurements that also included HFL. The ONL and HFL thicknesses at specific retinal eccentricities were poorly correlated.
Conclusion
Accurate ONL and HFL thickness measurements are made possible by the optical contrast of D-OCT. Distinguishing these individual layers can improve clinical trial endpoints and assessment of disease progression.
Keywords: Spectral domain, Fourier domain, directional reflectivity, outer plexiform layer, Henle's fiber layer, photoreceptors, cones, rods, biomarker
Introduction
The outer nuclear layer (ONL) of the retina contains the nuclei of the cone and rod photoreceptors1. Loss of the cellular machinery found in these nuclei causes irreparable loss of the photoreceptors and the capacity for visual function. The ONL thickness, consequently, has been a critical anatomical endpoint for ex vivo and animal studies of retinal degenerations2–5. In vivo imaging using spectral domain optical coherence tomography (SDOCT) has delivered the ability to directly measure the ONL thickness in animal models over time to monitor the natural history of disease and the effects of therapeutic interventions6–8. While it is tempting to utilize SDOCT in a similar fashion to measure the ONL thickness in the macula of human subjects, standard SDOCT image acquisition is confounded by the presence of Henle fiber layer (HFL) and cannot reliably identify the true ONL9,10.
HFL consists of the photoreceptor axons and Müller cell processes that are substantial in the human macula11. Because of the directional reflectivity properties of HFL and its oblique course in the macula it typically appears iso-reflective to the true ONL on standard SDOCT images9. Consequently, HFL has been routinely included in manual and automated segmentations of the apparent ONL, thus resulting in an artificially thick assessment of the true ONL thickness12–18. While the influence of HFL has been recognized in several publications, it has been grouped together as the ONL+ or ONL+HFL without independent analysis of the contribution of each layer19,20. Without independent measurements, the validity of grouping these structures together as a surrogate for the true ONL thickness cannot be known.
Directional OCT (D-OCT) is a technique that can be applied to any type of OCT system that involves purposefully altering the OCT beam entry position. By changing the orientation of light incident on the retina, D-OCT adds optical contrast to directionally reflective structures21. In the application of D-OCT presented in this study, we identified a robust boundary between the true ONL and HFL and measured the thickness of these layers using horizontal and vertical cross-sectional images of normal subjects acquired with a commercial SDOCT system. We tested the hypothesis that D-OCT can be used to determine the independent contributions of ONL and HFL thickness and that they were symmetrically distributed about the fovea on SDOCT scans.
Given our ability to utilize this technique, we will refer to the ONL to mean the layer of the retina containing only the photoreceptor nuclei, and HFL to mean the layer of the retina containing only the photoreceptor axons and Muller cell processes.
Methods
The Medical College of Wisconsin Institutional Review Board approved the protocol, each subject gave written informed consent to participate in the study, and the Declaration of Helsinki guidelines were followed throughout the study. Healthy volunteers without macular pathology were recruited for the study, and pupils were dilated using 2.5% phenylephrine and 1% tropicamide.
Fifty-seven eyes of 31 subjects were imaged at the Medical College of Wisconsin by a single operator using a single Cirrus HD-OCT system (Carl Zeiss Meditec, Inc., Dublin, CA). Sets of D-OCT images were acquired using a previously described protocol9. Briefly, this consisted of the acquisition of a central scan using a horizontal HD 5-line raster setting which used an average of 20 B-scans, each comprised of 1024 A-scans over 20 degrees. The central scan was defined by the pupil entry position that resulted in a “flat” appearing cross-sectional image (Figure 1, top). While the subject remained at the chin-rest, two additional horizontal scans using the same parameters were obtained from off-axis pupil positions between 1.5-2 mm away from the pupil position used to obtain the central scan (Figure 1, middle and bottom). An analogous protocol was then followed for vertical scans. During each scan, the subject was asked to maintain fixation on the center of the internal fixation target. The signal strength and quality of the scans were checked immediately after each acquisition and repeated if necessary.
Figure 1.
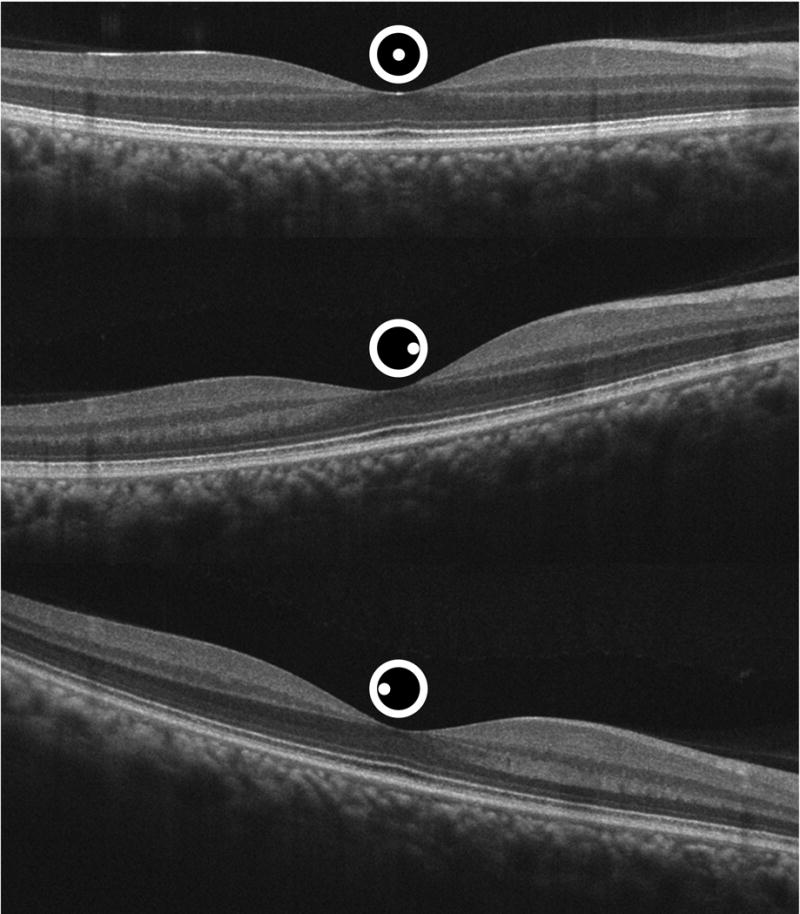
Sequential uncorrected horizontal spectral domain optical coherence tomography images of a normal right eye obtained through different entrance pupil positions depicted by the spot location within the central circle above the scans.
Off-axis “tilted” B-scans were registered to the centrally acquired “flat” image by means identification of similar points of agreement between the two images using custom software written in Matlab (Mathworks, Natick, MA). At least 20 uniformly distributed homologous control points were identified within each image set. A second-order polynomial 2-D spatial transformation was performed to obtain registered sets, which were verified by toggling between images. Registration was graded as acceptable if motion of either the internal limiting membrane (ILM) or retinal pigment epithelium (RPE) contours was undetectable. Images were registered pairwise between the flat image and a single tilted image, and then the flat image and other tilted images to result in a composite stack of three images of the same part of the macula having been acquired through the three different pupil positions. Left eyes were horizontally flipped to be right-eye-equivalents for purposes of nasal/temporal comparison.
Axial length measurements were acquired on each subject using the IOL master (Carl Zeiss Meditec, Inc.) Axial length measurements were used to correct for retinal magnification differences as previously described22.
Registered D-OCT image sets were segmented using ImageJ software (NIH, Bethesda, MD). Using all images in the set, boundaries were determined and manually segmented at the vitreoretinal interface (VRI), the innermost aspects of the interface between the synaptic outer plexiform layer (OPL) and HFL, HFL and the ONL, the ONL and the external limiting membrane and the bottom of the RPE. Linear interpolation was then performed in Matlab to obtain segmentation lines from the different boundary positions and standardize distances from the center of the dataset, the foveal center, as defined by the thinnest VRI-RPE distance.
Manual segmentations were performed on all of the data by two independent masked graders. Inter-grader variability was assessed by comparing the locations and area of the ONL and HFL segmentations. Additionally, a randomly chosen subset of five eyes was selected for the same grader to segment the data twice in order to measure intra-grader variability. The coefficient of variation between the graders was determined as the standard deviation of the thicknesses of retinal layers divided by the mean value in pixels.
The correlation between the ONL and HFL thickness at 18 horizontal and vertical locations across 23 right eyes from 23 subjects having well-registered bilateral scans was computed using the open-source statistical package R (http://www.r-project.org/). The thickness at each location was a mean measurement over 0.3 mm. Spearman's correlation coefficient ρ, and the p-value associated with each correlation coefficient were computed between values of the ONL and HFL thicknesses. At multiple eccentricities from the foveal center, the correlation between the ONL thickness and HFL thickness immediately overlying it was computed. Additionally, because of the oblique orientation of HFL, the correlation between ONL thickness and HFL thickness in more peripheral regions of the macular scans was also analyzed.
Results
Fifty-seven eyes of 31 subjects were imaged with 26 subjects having both eyes imaged, 4 subjects only had the right eye imaged and 1 subject only had the left eye imaged. Subjects ranged in age from 18-34 years old (mean = 23 years old), and 71% were male. All subjects were found to have no retinal pathology on the horizontal or vertical cross-sectional SDOCT images. Fifty-two datasets were registered successfully to the “flat” image. Five datasets could not be sufficiently registered for accurate segmentation and were excluded from analysis due to a change in fixation and lack of image homology. Axial length measurements were obtained on all subjects. Mean (±SD) axial length was 24.2 mm (±1.1 mm).
The average coefficient of variation between graders was 0.05 indicating excellent reproducibility where grading differences were found to be less than 1 pixel (approximately 4 micrometers axially) in either direction from the junction of the ONL and HFL. Intra-grader reproducibility for each grader was assessed and the average coefficient of variation was 0.01.
HFL hyper-reflectivity contralateral to the side of pupil entry and HFL hypo-reflectivity ipsilateral to the side of pupil entry was apparent in unregistered images (Figure 1). After registration to the flat image, the change in appearance of HFL and the outer retinal bands became more apparent. The change in reflectivity as a function of pupil entry position for each pixel of the registered scans can be visualized in a single image using the chromatic D-OCT visualization method described by Makhijani et al (Figure 2)21. Internal to HFL, the non-directionally reflective synaptic OPL was equally reflective from each pupil entry position, and consequently is visualized as a grayscale structure. This is in sharp distinction from HFL itself, which is prominently visualized as red or green, depending on a nasal or temporal pupil entry position, respectively.
Figure 2.
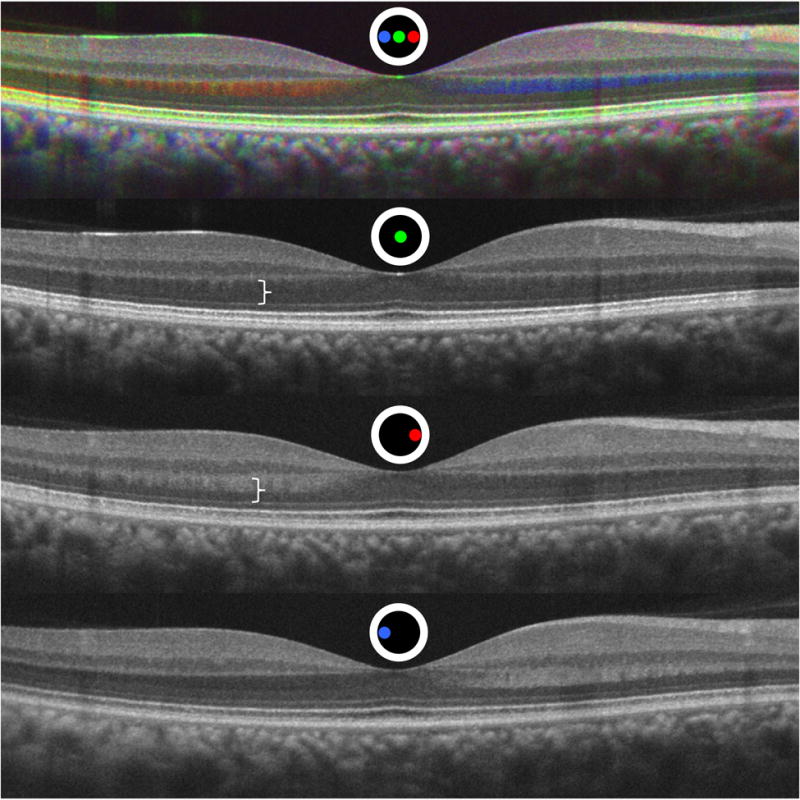
Registered Directional optical coherence tomography (D-OCT) image set. The top image demonstrates a chromatic D-OCT image from the registered Figure 1 set below. A color map was assigned to B-scans acquired from each pupil entry position as depicted by the colored spot location within the circle. Non-directionally reflective layers are equally reflective from each pupil entry position and results in a grayscale value without additional color information. Directionally reflective layers have a different amount of reflectivity from different pupil entry positions and the colors of the contributing positions predominate21. White bracket indicates the improved visualization and differentiation of Henle fiber layer and the outer nuclear layer from the registered off-axis image compared to the upper white bracket on the standard central pupil entry image.
A substantial decrease in intensity of the second and third hyper-reflective outer retinal bands23 was apparent on the off-axis images of all eyes as compared to the flat images due to photoreceptor waveguiding and the optical Stiles-Crawford effect24. The Inner-Segment / Outer-Segment (IS/OS) junction, or Ellipsoid Zone (EZ)25, was maximally reflective in the central flat scans and diminished in intensity in each of the the off-axis tilted images. Even more striking, the band containing the photoreceptor outer segment tips, or Interdigitation Zone (IZ)25, almost entirely disappeared in the tilted scans. These effects of directional reflectivity resulted in a blue coloration of these structures in the chromatic D-OCT image shown in Figure 2 because maximal reflectivity occurred in the flat position and a decrease in reflectivity occurred in each of the off-axis scans.
We hypothesized that within an individual that the ONL and HFL thicknesses were radially symmetric around the fovea. We tested this in horizontal and vertical scans for left and right eyes. The differences between measures at equal distances were calculated and one sample Hotelling T2 test was performed. The hypothesis was rejected in all comparisons (p<0.0001 for each), indicating that the ONL and HFL measures were not symmetric within the individual eyes.
The ONL and HFL thicknesses were compared at each retinal eccentricity in the right and left eyes of the 23 subjects where well-registered bilateral scans were obtained. The ONL thickness values between eyes were significantly correlated at each measured eccentricity with a mean Pearson's correlation coefficient r = 0.78 (SD=0.10), p<0.0001 for the horizontal measurements and mean r = 0.64 (SD=0.23) p=0.046 for the vertical. HFL showed an even higher correlation by retinal eccentricity between eyes with a mean r = 0.90 (SD=0.06) p<0.0001 horizontally and r = 0.91 (SD=0.04) p<0.0001 vertically. Because of this high correlation between both eyes in this cohort, only one eye from each subject was chosen for detailed comparison of the ONL and HFL horizontal and vertical thickness values.
The ONL thickness was found to be substantially less than measurements possible with standard SDOCT imaging that include HFL, and varied significantly with eccentricity from the foveal center. Figure 3 illustrates the average thickness measurements and standard deviations for the ONL and the ONL+HFL by eccentricity in horizontal and vertical dimensions of a single eye of each subject. In the central fovea the True ONL curve and the ONL+HFL were relatively close together, reflecting the substantial ONL contribution. Parafoveally, the thickness of the ONL rapidly decreased while the ONL+HFL curve actually increased initially and then slowly decreased in both horizontal and vertical meridians. With increasing eccentricity, the ONL+HFL thickness continued to decrease out to the most peripherally measured locations. However, the isolated mean ONL thickness reached a nadir at 0.8 mm temporally and 1.0 mm nasally. The ONL thickness then increased at greater horizontal eccentricities as the population of rod nuclei increased26. The vertical ONL thickness curve differed from the horizontal ONL thickness curve in several respects. Its nadir was symmetric between the inferior and superior retina and occured at 0.8 mm eccentricity. Distal to this, it demonstrated a more rapid rise and greater ultimate thickness at the most eccentric locations. These findings are consistent with the topographic distribution of macular rods found in histological studies.26.
Figure 3.
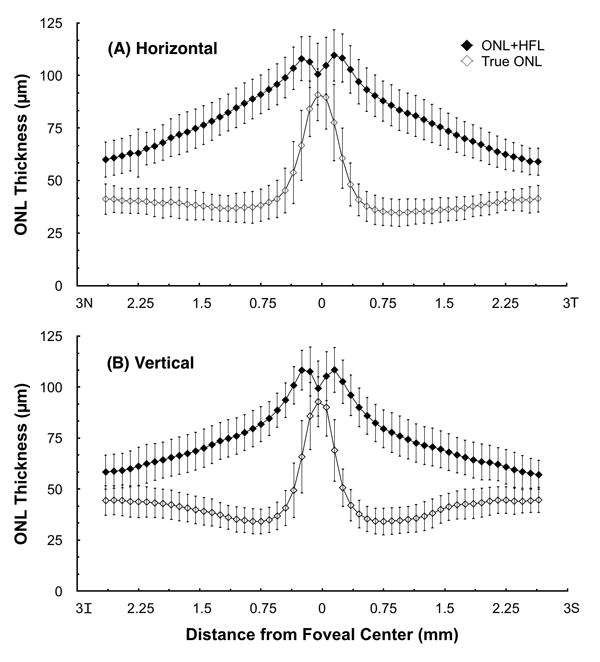
Mean true ONL thicknesses and ONL+HFL thicknesses by eccentricity from the foveal center for (A) Horizontal and (B) Vertical macular scans. Error bars represent ± one standard deviation.
The relative proportion of the thickness occupied by the ONL compared to the standard measurements containing the ONL and HFL was also analyzed. Figure 4 shows the mean percentage of the total ONL+HFL thickness comprised of the ONL and HFL for all studied individuals at each eccentricity. In the center of the fovea, the ONL predominates, with HFL comprising less than 10.7% of the measured thickness on average. HFL was found to have its largest mean contribution around 0.75 mm eccentricity from the foveal center, where a mean 60.0% of the thickness was accounted for by HFL.
Figure 4.
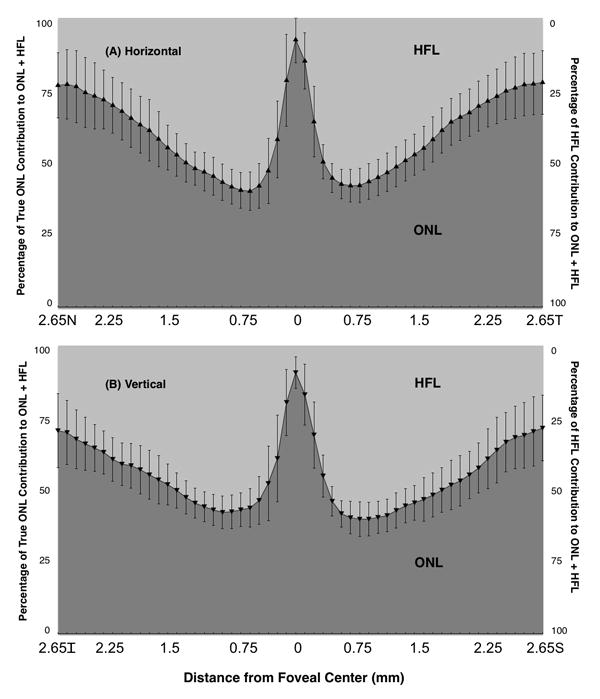
Percentage of true ONL plus HFL thicknesses occupied by true ONL and HFL by eccentricity from the foveal center for (A) Horizontal and (B) Vertical macular scans. Error bars represent ± one standard deviation.
The axons from cones that form the HFL radiate outward, eccentric to the foveal center, to synapse with their corresponding bipolar cells. Because of this anatomical arrangement, we hypothesized that the ONL thickness would not show a positive correlation with HFL thickness directly overlying it and that ONL thickness would show a positive correlation with HFL thicknesses at greater eccentricities. To investigate this, we performed a systematic series of correlations between the ONL thickness and the HFL thickness directly above it as well as at more eccentrically displaced locations. The correlations are shown in Figure 5, where the correlation coefficients at each position and correlation coefficients with p < 0.05 were plotted for the horizontal and vertical scans. In the foveal center, where the ONL predominates there was a statistically significant negative correlation found between the ONL and HFL thicknesses. In the remaining macula there were no other statistically significant correlations found between the thickness of the ONL and HFL immediately overlying it. The central ONL was found to have a statistically significant positive correlation with more peripheral HFL at 0.6 mm eccentricity in horizontal meridian and 0.9 mm eccentricity in the vertical meridian.
Figure 5.
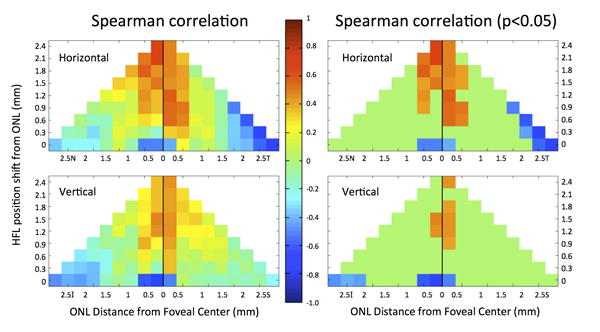
Spearman's rank correlation coefficient between the true ONL thickness and HFL thickness at different locations across subjects in horizontal (N, T) and vertical orientations (I, S). The x-axis represents the ONL position by eccentricity from the foveal center. The y-axis represents the location of HFL shifted further from the fovea relative to a given ONL position. The row labeled 0 on the y-axis refers to a comparison of the ONL with HFL immediately overlying it (i.e. shifted by 0). For example, the box at the (2.5T, 0) position compares the mean ONL thickness at 2.5 mm temporal to the fovea with the mean HFL thickness at 2.5 mm temporal to the fovea (shifted by 0 mm). The box at the (0.5S, 0.9) position compares the mean ONL thickness at 0.5 mm superior to the foveal center with the mean HFL thickness at 1.4 mm superior to the fovea (shifted by 0.9 mm). Spearman's rho values are color-coded using the central color bar.
Discussion
Photoreceptor nuclei are contained in the ONL and the thickness of this layer is a key biomarker in identifying normal aging changes and the progression of degenerative diseases28. The ONL is an appealing biomarker for disease progression because photoreceptors are the direct mediators of vision, and the symmetry between eyes found in this study would allow for its measurement where one eye was treated and the contralateral eye was a control. SDOCT images acquired in the standard fashion are unable to reliably distinguish between the true ONL and the overlying HFL. Consequently, we utilized Directional OCT (D-OCT) to optically delineate these layers. We found a dramatic difference in the thickness measurements resulting from the inclusion or exclusion of HFL.
Depending on eccentricity, the incorporation of HFL into the calculation of the ONL thickness results in a doubling of the thickness estimates. The HFL has its most substantial contribution between 0.5 mm and 1.5 mm eccentricity, where it accounts for over half of the thickness of the two layers combined. Furthermore, there is a real difference in the ONL thicknesses between the horizontal and vertical meridians due to differences in the cone and rod contributions that only becomes obvious on OCT when the contribution of HFL is unmasked. Because of the confounding effect of HFL thickness, both manual and automated algorithms reporting ONL thickness values must ensure that HFL is not included in the measurements.
Given the course of macular photoreceptor axons as they move from more central ONL to more peripheral synaptic OPL, our hypothesis that no fixed correlation exists between HFL and ONL at the same eccentricity was confirmed. There was a positive correlation between the ONL at the foveal center and more eccentric macular HFL. However, given the reported lengths of the longest Henle fibers is 675 micrometers and that these were found to originate in the parafovea, these correlations with the central ONL are likely spurious27. Given this lack of correlation in individuals without macular pathology, the thickness of the ONL cannot be computed retrospectively after measuring the ONL and HFL together with standard OCT acquisition techniques.
Visualization of parts of the border between HFL and the ONL may be possible without D-OCT under several circumstances. These include high-quality frame averaged images in certain eyes, serendipitous off-axis scan acquisition, or secondary to the presence of deforming pathology29. However, a reliable and robust method for routinely delineating these boundaries across the entire cross-section or volume scans should be implemented, particularly for use in prospective clinical trials that ideally use automated segmentation algorithms. Purposeful prospective imaging methods such as D-OCT are required if accurate ONL measurements are sought.
The ability to measure the ONL and HFL thicknesses independently may be beneficial to understanding normal foveal development, following the natural history of retinal degenerations, and monitoring the effects of therapeutic interventions. Grouping the two layers together results in conclusions that are, in the best-case scenario imprecise and, in the worst-case scenario, erroneous. Without accounting for HFL, the ONL thickness changes have been reported in numerous disease conditions including outer retinal atrophy30, geographic atrophy31, and ABCA4 mutations32. However, because HFL was not identified and accounted for in these measurements, the true extent of photoreceptor nuclear loss cannot be known. Furthermore, conclusions regarding the extent of retinal damage and remodeling cannot accurately be made without distinguishing the ONL from HFL as these layer thicknesses will vary with eccentricity, and may respond differently to cellular injury over time.
Change in the ONL thickness has been reported in ex vivo studies in normal aging individuals33–35 as well as in age related macular degeneration36. Changes in the thickness of both the ONL and HFL have also been reported in human and rodent eyes with inherited retinal degenerations37. If HFL thickness increases but the ONL is thinning with age as demonstrated by Curcio et al11, the combined ONL and HFL thicknesses may appear relatively constant despite wide variability in each of these components. Such ambiguity is unnecessary now that these layers can be optically differentiated.
Future studies will have to establish the effect of photoreceptor cell death on the thicknesses of the ONL and HFL, and the time course over which change happens. While the abundant photoreceptor axons that comprise HFL may undergo anterograde degeneration, the surrounding Muller scaffolding may not. Histological data actually demonstrates hypertrophy of the surrounding cells in response to retinal degeneration37, and it is possible that this mechanism alters the visible thickness or appearance of HFL. If focal loss of photoreceptor nuclei occurs, the angle of incidence of the OCT beam relative to HFL may change, thus revealing the true thickness of the ONL in the surrounding areas9,29. However, if there were diffuse loss of the ONL over an area, the orientation would not be expected to change in the same focal manner, therefore requiring the additional optical contrast that D-OCT provides. D-OCT may allow disambiguation of optical effects of disease progression versus true anatomical changes.
HFL has classically been considered a component of the histological outer plexiform layer along with the synaptic termini of the photoreceptor cells. While this designation may have been appropriate when histology was the predominant means of assessing HFL and its characteristics, the lumping together of the different components of the outer plexiform layer is no longer necessary or beneficial in the age of OCT. A plexus, by definition, is a complex intermixing of dendrites and axonal synaptic termini. HFL, in contrast, has an oblique, regular, and radially symmetric pattern. D-OCT allows not only HFL to be visualized as hyper-reflective on the contralateral side to the pupil, but also hypo-reflective on the ipsilateral side, thereby permitting both the anatomic distinction between the ONL externally and the synaptic OPL internally. Given the precision that in vivo imaging can now provide in distinguishing these layers, the disambiguation of the literature by the assignment of HFL as an independent layer in posterior segment OCT is a welcome improvement25.
Limitations of this study include the use of a cohort of only young healthy normal subjects. Given a goal of this research is the clinical application of D-OCT to patients with all forms of retinal disease, imaging eyes from a full range of ages is a critical next step. An additional limitation includes the fact that a single operator acquired all of the images in this study using a single commercially available OCT system. While it is intuitive that the thickness of the retinal layers should not change between operators, this must be confirmed. In this study, the amount of pupil displacement from the central position varied depending on where the pupil entry position resulting in a normal incidence scan was obtained, which varied between individuals. Indeed, a skilled operator using the altered reflectivity of the HFL and overall scan quality as endpoints for displacement of the pupil entry position was utilized in this study. Additional studies are underway to determine if a novice operator can reliably acquire images resulting in the same measurements.
Optical coherence tomography can live up to the promise of in vivo histology only if the optical properties of the tissue are accounted for. The reliance of confocal detection of back-scattered light in serving as the signal and the contrast agent in OCT means that the appearance of images is governed not only by the presence of the tissue itself, but also by its optical properties, including directional reflectivity. Directional OCT takes advantage of this optical property to add additional contrast to the retinal anatomy. The visual display of directional reflectivity content within a single chromatic D-OCT image conveys both optical contrast between retinal layers and provides information about the orientation of cellular components. The application of D-OCT demonstrated in this paper would allow more accurate measures of the ONL and HFL in clinical trials. Future studies seeking to report ONL thickness measurements should differentiate between ONL and HFL so that the most accurate anatomical outcomes can be made and key insights into pathology can be revealed.
Summary Statement.
Standard Fourier Domain Optical Coherence Tomography images do not reliably distinguish between the photoreceptor-containing outer nuclear layer and the axon-containing Henle fiber layer, resulting in a significant overestimation of outer nuclear layer thickness, a key biomarker. Directional Optical Coherence Tomography (D-OCT) adds optical contrast to overcome this limitation.
Acknowledgments
Funding/Support: NIH K12-EY017269 (BJL), R01-EY017607(JC), P30-EY001931(JC), Foundation Fighting Blindness (JC, AR, JLD), Research to Prevent Blindness (JC, JLD). This investigation was conducted in part in a facility constructed with support from the Research Facilities Improvement Program (JC); Grant C06 RR016511 from the National Center for Research Resources, National Institutes of Health (JC). This project was supported in part by the National Center for Advancing Translational Sciences, National Institutes of Health, through grant number UL1TR000055 (JC).
Footnotes
Financial Disclosures: BJL, AR, and JC are co-inventors of Directional OCT.
BJL is a consultant for Genentech/Roche, Regeneron and Avalanche.
JAC, AMD, RFC, JKB, JLD and BJA have no relevant financial disclosures.
References
- 1.Hogan MJ, Alvarado J, Weddell J. Histology of the Human Eye. Philadelphia, PA: W.B. Saunders; 1971. pp. 444–57. [Google Scholar]
- 2.Smith RS, Hawes NL, Chang B, Nishina PM. Retina. Systematic Evaluation of the Mouse Eye: Anatomy, Pathology, and Biomethods. Boca Raton, FL: CRC Pless LLC; 2002. pp. 195–227. [Google Scholar]
- 3.LaVail MM, White MP, Gorrin GM, et al. Retinal degeneration in the nervous mutant mouse. I. Light microscopic cytopathology and changes in the interphotoreceptor matrix. J Comp Neurol. 1993;333(2):168–81. doi: 10.1002/cne.903330204. [DOI] [PubMed] [Google Scholar]
- 4.McGill TJ, Prusky GT, Douglas RM, et al. Discordant anatomical, electrophysiological, and visual behavioral profiles of retinal degeneration in rat models of retinal degenerative disease. Invest Ophthalmol Vis Sci. 2012;53(10):6232–44. doi: 10.1167/iovs.12-9569. [DOI] [PMC free article] [PubMed] [Google Scholar]
- 5.Tao W, Wen R, Goddard MB, et al. Encapsulated Cell-Based Delivery of CNTF Reduces Photoreceptor Degeneration in Animal Models of Retinitis Pigmentosa. 2002;43(10):3292–98. [PubMed] [Google Scholar]
- 6.Wang R, Jiang C, Ma J, Young MJ. Monitoring morphological changes in the retina of rhodopsin-/- mice with spectral domain optical coherence tomography. Invest Ophthalmol Vis Sci. 2012;53(7):3967–72. doi: 10.1167/iovs.12-9716. [DOI] [PubMed] [Google Scholar]
- 7.Pennesi ME, Michaels KV, Magee SS, et al. Long-term characterization of retinal degeneration in rd1 and rd10 mice using spectral domain optical coherence tomography. Invest Ophthalmol Vis Sci. 2012;53(8):4644–56. doi: 10.1167/iovs.12-9611. [DOI] [PMC free article] [PubMed] [Google Scholar]
- 8.Aziz MK, Ni A, Esserman DA, Chavala SH. Evidence of early ultrastructural photoreceptor abnormalities in light-induced retinal degeneration using spectral domain optical coherence tomography. Br J Ophthalmol. 2014;98(7):984–9. doi: 10.1136/bjophthalmol-2013-304515. [DOI] [PubMed] [Google Scholar]
- 9.Lujan BJ, Roorda A, Knighton RW, Carroll J. Revealing Henle's Fiber Layer Using Spectral Domain Optical Coherence Tomography. Invest Ophthalmol Vis Sci. 2011;52(3):1486–92. doi: 10.1167/iovs.10-5946. [DOI] [PMC free article] [PubMed] [Google Scholar]
- 10.Otani T, Yamaguchi Y, Kishi S. Improved visualization of Henle fiber layer by changing the measurement beam angle on optical coherence tomography. Retina. 2011;31(3):497–501. doi: 10.1097/IAE.0b013e3181ed8dae. [DOI] [PubMed] [Google Scholar]
- 11.Curcio CA, Messinger JD, Sloan KR, et al. Human Chorioretinal Layer Thicknesses Measured Using Macula-wide High Resolution Histological Sections Key words. Invest Ophthalmol Vis Sci. 2011;52(7):3943–54. doi: 10.1167/iovs.10-6377. [DOI] [PMC free article] [PubMed] [Google Scholar]
- 12.Srinivasan VJ, Monson BK, Wojtkowski M, et al. Characterization of outer retinal morphology with high-speed, ultrahigh-resolution optical coherence tomography. Invest Ophthalmol Vis Sci. 2008;49(4):1152–3. doi: 10.1167/iovs.07-0838. [DOI] [PMC free article] [PubMed] [Google Scholar]
- 13.Ooto S, Hangai M, Tomidokoro A, et al. Effects of age, sex, and axial length on the three-dimensional profile of normal macular layer structures. Invest Ophthalmol Vis Sci. 2011;52(12):8769–79. doi: 10.1167/iovs.11-8388. [DOI] [PubMed] [Google Scholar]
- 14.Birch DG, Weleber RG, Duncan JL, et al. Ciliary Neurotrophic Factor Retinitis Pigmentosa Study Groups. Randomized Trial of Ciliary Neurotrophic Factor Delivered by Encapsulated Cell Intraocular Implants for Retinitis Pigmentosa. Am J Ophthalmol. 2013;156(2):283–92. doi: 10.1016/j.ajo.2013.03.021. [DOI] [PMC free article] [PubMed] [Google Scholar]
- 15.Sadigh S, Cideciyan AV, Sumaroka A, et al. Abnormal Thickening as well as Thinning of the Photoreceptor Layer in Intermediate Age-Related Macular Degeneration. Invest Ophthalmol Vis Sci. 2013;54(3):1603–12. doi: 10.1167/iovs.12-11286. [DOI] [PubMed] [Google Scholar]
- 16.Demirkaya N, van Dijk HW, van Schuppen SM, et al. Effect of Age on Individual Retinal Layer Thickness in Normal Eyes as Measured with Spectral-Domain Optical Coherence Tomography. Invest Ophthalmol Vis Sci. 2013;54(7):4934–40. doi: 10.1167/iovs.13-11913. [DOI] [PMC free article] [PubMed] [Google Scholar]
- 17.Yanni SE, Wang J, Cheng CS, et al. Normative reference ranges for the retinal nerve fiber layer, macula, and retinal layer thicknesses in children. Am J Ophthalmol. 2013;155(2):354–60. doi: 10.1016/j.ajo.2012.08.010. [DOI] [PMC free article] [PubMed] [Google Scholar]
- 18.Bagci AM, Shahidi M, Ansari R, et al. Thickness profiles of retinal layers by optical coherence tomography image segmentation. Am J Ophthalmol. 2008;146(5):1152–3. doi: 10.1016/j.ajo.2008.06.010. [DOI] [PMC free article] [PubMed] [Google Scholar]
- 19.Hood DC, Lazow MA, Locke KG, et al. The transition zone between healthy and diseased retina in patients with retinitis pigmentosa. Invest Ophthalmol Vis Sci. 2011;52(1):101–8. doi: 10.1167/iovs.10-5799. [DOI] [PMC free article] [PubMed] [Google Scholar]
- 20.Chui TY, Song H, Clark CA, et al. Cone photoreceptor packing density and the outer nuclear layer thickness in healthy subjects. Invest Ophthalmol Vis Sci. 2012;53(7):3545–53. doi: 10.1167/iovs.11-8694. [DOI] [PMC free article] [PubMed] [Google Scholar]
- 21.Makhijani VS, Roorda A, Bayabo JK, et al. Chromatic visualization of reflectivity variance within hybridized directional OCT images. Proc SPIE 8571, Optical Coherence Tomography and Coherence Domain Opitcal Methods in Biomedicine XVII. 2013:857105. [Google Scholar]
- 22.Odell D, Dubis AM, Lever JF, et al. Assessing errors inherent in OCT-derived macular thickness maps. J Ophthalmol. 2011:692574. doi: 10.1155/2011/692574. [DOI] [PMC free article] [PubMed] [Google Scholar]
- 23.Spaide RF, Curcio CA. Anatomical correlates to the bands seen in the outer retina by optical coherence tomography: literature review and model. Retina. 2011;31(8):1609–19. doi: 10.1097/IAE.0b013e3182247535. [DOI] [PMC free article] [PubMed] [Google Scholar]
- 24.Gao W, Cense B, Zhang Y, et al. Measuring retinal contributions to the optical Stiles-Crawford effect with optical coherence tomography. Opt Express. 2008;16(9):6486–501. doi: 10.1364/OE.16.006486. [DOI] [PMC free article] [PubMed] [Google Scholar]
- 25.Staurenghi G, Sadda S, Chakravarthy U, Spaide RF. Proposed Lexicon for Anatomic Landmarks in Normal Posterior Segment Spectral-Domain Optical Coherence Tomography: The IN•OCT Consensus. Ophthalmology. 2014;121(8):1572–8. doi: 10.1016/j.ophtha.2014.02.023. [DOI] [PubMed] [Google Scholar]
- 26.Curcio CA, Sloan KR, Kalina RE, Hendrickson AE. Human photoreceptor topography. J Comp Neurol. 1990;292(4):497–523. doi: 10.1002/cne.902920402. [DOI] [PubMed] [Google Scholar]
- 27.Drasdo N, Millican CL, Katholi CR, Curcio CA. The length of Henle Fibers in the human retina and a model of ganglion receptive field density in the visual field. Vision Research. 2007;47:2901–2911. doi: 10.1016/j.visres.2007.01.007. [DOI] [PMC free article] [PubMed] [Google Scholar]
- 28.Bird AC, Phillips RL, Hageman GS. Geographic atrophy: a histopathological assessment. JAMA Ophthalmol. 2014;132(3):338–45. doi: 10.1001/jamaophthalmol.2013.5799. [DOI] [PMC free article] [PubMed] [Google Scholar]
- 29.Ouyang Y, Walsh AC, Keane PA, et al. Different phenotypes of the appearance of the outer plexiform layer on optical coherence tomography. Graefes Arch Clin Exp Ophthalmol. 2013;251(10):2311–7. doi: 10.1007/s00417-013-2308-5. [DOI] [PubMed] [Google Scholar]
- 30.Spaide RF. Outer retinal atrophy after regression of subretinal drusenoid deposits as a newly recognized form of late age-related macular degeneration. Retina. 2013;33(9):1800–8. doi: 10.1097/IAE.0b013e31829c3765. [DOI] [PubMed] [Google Scholar]
- 31.Savastano MC, Minnella AM, Tamburrino A, et al. Differential vulnerability of retinal layers to early age-related macular degeneration: evidence by SD-OCT segmentation analysis. Invest Ophthalmol Vis Sci. 2014;55(1):560–6. doi: 10.1167/iovs.13-12172. [DOI] [PubMed] [Google Scholar]
- 32.Huang WC, Cideciyan AV, Roman AJ, et al. Inner and outer retinal changes in retinal degenerations associated with ABCA4 mutations. Invest Ophthalmol Vis Sci. 2014;55(3):1810–22. doi: 10.1167/iovs.13-13768. [DOI] [PMC free article] [PubMed] [Google Scholar]
- 33.Eliasieh K, Liets LC, Chalupa LM. Cellular reorganization in the human retina during normal aging. Invest Ophthalmol Vis Sci. 2007;48(6):2824–30. doi: 10.1167/iovs.06-1228. [DOI] [PubMed] [Google Scholar]
- 34.Gartner S, Henkind P. Aging and degeneration of the human macula. 1. Outer nuclear layer and photoreceptors. Br J Ophthalmol. 1981;65(1):23–8. doi: 10.1136/bjo.65.1.23. [DOI] [PMC free article] [PubMed] [Google Scholar]
- 35.Terzibasi E, Calamusa M, Novelli E, et al. Age-dependent remodelling of retinal circuitry. Neurobiol Aging. 2009;30(5):819–28. doi: 10.1016/j.neurobiolaging.2007.08.017. [DOI] [PubMed] [Google Scholar]
- 36.Curcio CA, Medeiros NE, Millican CL. Photoreceptor loss in age-related macular degeneration. Invest Ophthalmol. 1996;37(7):11236–49. [PubMed] [Google Scholar]
- 37.Jones BW, Watt CB, Frederick JM, et al. Retinal remodeling triggered by photoreceptor degenerations. J Comp Neurol. 2003;464(1):1–16. doi: 10.1002/cne.10703. [DOI] [PubMed] [Google Scholar]