Abstract
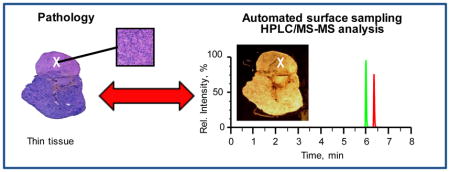
Described here are the results from the profiling of the proteins arginine vasopressin (AVP) and adrenocorticotropic hormone (ACTH) from normal human pituitary gland and pituitary adenoma tissue sections using a fully automated droplet-based liquid microjunction surface sampling-HPLC-ESI-MS/MS system for spatially resolved sampling, HPLC separation, and mass spectral detection.
Excellent correlation was found between the protein distribution data obtained with this droplet-based liquid microjunction surface sampling-HPLC-ESI-MS/MS system and those data obtained with matrix assisted laser desorption ionization (MALDI) chemical imaging analyses of serial sections of the same tissue. The protein distributions correlated with the visible anatomic pattern of the pituitary gland. AVP was most abundant in the posterior pituitary gland region (neurohypophysis) and ATCH was dominant in the anterior pituitary gland region (adenohypophysis).
The relative amounts of AVP and ACTH sampled from a series of ACTH secreting and non-secreting pituitary adenomas correlated with histopathological evaluation. ACTH was readily detected at significantly higher levels in regions of ACTH secreting adenomas and in normal anterior adenohypophysis compared to non-secreting adenoma and neurohypophysis. AVP was mostly detected in normal neurohypophysis as anticipated.
This work demonstrates that a fully automated droplet-based liquid microjunction surface sampling system coupled to HPLC-ESI-MS/MS can be readily used for spatially resolved sampling, separation, detection, and semi-quantitation of physiologically-relevant peptide and protein hormones, such as AVP and ACTH, directly from human tissue. In addition, the relative simplicity, rapidity and specificity of the current methodology support the potential of this basic technology with further advancement for assisting surgical decision-making.
Keywords: liquid microjunction, droplet-based liquid extraction, autosampler, spatial distribution, human pituitary, protein, adrenocorticotropic hormone (ACTH), AVP (vasopressin), pituitary adenoma
Graphical abstract
INTRODUCTION
During surgery, preliminary diagnosis of tissue biopsies is currently rendered by trained pathologists via the microscopic review of hematoxylin and eosin (H&E) stained thin tissue sections of the aforementioned biopsy samples. This process including the cutting and mounting of the tissue typically takes about 20–30 minutes [1,2]. A more detailed evaluation, which usually involves the characterization of the expression levels of important diagnostic molecules, such as proteins, is not performed in an intraoperative setting [3,4,5]. The customary method used for the detection of selected protein biomarkers is immunohistochemistry (IHC), which relies on recognition of protein antigens by antibodies that are generated against relevant epitopes of the biomarker of interest [6]. Although IHC can reveal the presence of a protein biomarker with high spatial resolution, it is time consuming, and limited by the quality and specificity of the antibody. Moreover, the simultaneous characterization of multiple proteins is generally impractical in the clinical setting. Hence, final diagnostic reports take days to issue and significant amounts of information of potential importance to clinical care are left unanalyzed within the tissue, and not available at the time of surgical resection to guide decision-making.
Recently, significant strides have been made in the development of platforms that can provide near real-time molecular information in the intraoperative setting. For example, ambient ionization approaches such as desorption electrospray ionization mass spectrometry (DESI MS) [1,7,8,9] and rapid evaporative ionization mass spectrometry (REIMS) [2,10] have been used to monitor the lipids and metabolites within tissue biopsy specimens. This information can be used to classify tumors, to provide important prognostic information such as tumor subtype and grade and to evaluate the molecular margins at the outer limits of a surgical resection thereby informing the surgeon if the tissue is free of tumor cells. For example, a DESI MS molecular profile can be typically acquired from a single sample location within 2 minutes after mounting [1] or along a line from a tissue on a slide (smear or swab) in several minutes. A more complete two-dimensional molecular image can be acquired from a mounted tissue section in about an hour [1,11], that can be used to correlate underlying histology with the presence of molecular signatures. Single point profiles are appropriate for rapid data acquisition during a surgical procedure while 2D molecular imaging is done in the research setting to carefully validate signatures relative to classic histopathology criteria [1,9]. REIMS has also shown potential for near-real-time characterization of human tissue in vivo by analysis of the aerosol released during electrosurgical dissection [2]. Based on (mostly) lipidomic profiles acquired, the REIMS approach provided accurate distinction between histological and histopathological tissue types.
Despite the ability of both DESI and REIMS to provide near real-time molecular information from the tissue at stake, both are still limited mainly to the analysis of lower molecular weight biomolecules such as metabolites, fatty acids, and lipids. The ability to characterize quickly the tissue distribution of larger macromolecular biomarkers like peptides and protein would harness the diagnostic value of validated IHC approaches for surgical decision-making.
Direct liquid extraction based surface sampling/ionization probe technology coupled with mass spectrometry [12,13,14,15,16] is one alternative approach that has been proven capable of sampling and analyzing proteins from biological samples [17,18,19,20,21,22,23]. Commercial systems like the Liquid Extraction Surface Analysis (LESA) system from Advion have been used for extraction and direct nanoESI-MS analysis of hemoglobin variants and other proteins from blood spot [17,20,21,22] and bacterial colonies [18,23]. However, because these approaches employ simple extraction and follow-up direct ESI-MS analysis the possibility of varying matrix effects masking the targeted biomarkers of interest is a potential concern [24]. The use of HPLC coupled with ESI-MS/MS for detection of targeted proteins facilitates the evaluation of complex sample matrices, enables differentiation between the particular disease related materials and enables absolute analyte quantitation.[25] However, this approach traditionally requires extensive sampling and processing [26] or homogenization of tissues [27], followed by extraction and cleanup steps. While an unattended workflow might be employed for this multi-step process using conventional laboratory preparative schemes and robots, these time-consuming steps render the use of traditional HPLC/MS unrealistic for real-time or near real-time diagnostic applications. However, the challenge of providing spatially resolved molecular information for peptides or proteins in a time frame currently relevant for intraoperative work (e.g., <10 minutes) could currently be effectively addressed using liquid extraction-based surface sampling coupled with high performance liquid chromatography (HPLC) electrospray ionization-tandem MS (ESI-MS/MS). Such systems have been successfully used for spatially resolved sampling and detection of drugs and metabolites from animal tissue sections [28,29,30,31,32,33,34] and proteins from dried blood spots [30]. The use of the liquid-extraction based sampling probes provides a simple and quick means to acquire a representative sample that can be immediately injected on column for analysis. Sampling and analyses can be completed in less than 10 minutes [28,29,30,31,32,35].
We here report proof-of-principle data demonstrating that a fully automated droplet-based liquid microjunction surface sampling probe-HPLC-ESI-MS/MS system can be used for spatially resolved sampling, HPLC separation, and mass spectral detection of adrenocorticotropic hormone (ACTH) and arginine vasopressin (AVP) from normal human pituitary gland and ACTH secreting and non-secreting human pituitary adenomas. Excellent correlation was found between the protein distribution data obtained with this system and the data from matrix assisted laser desorption ionization (MALDI) chemical imaging analyses of serial sections. The analysis of ACTH and AVP levels in ACTH secreting and non-secreting pituitary adenomas also corroborated results from histopathology segmentation of the tumor tissue sections.
EXPERIMENTAL SECTION
Chemicals
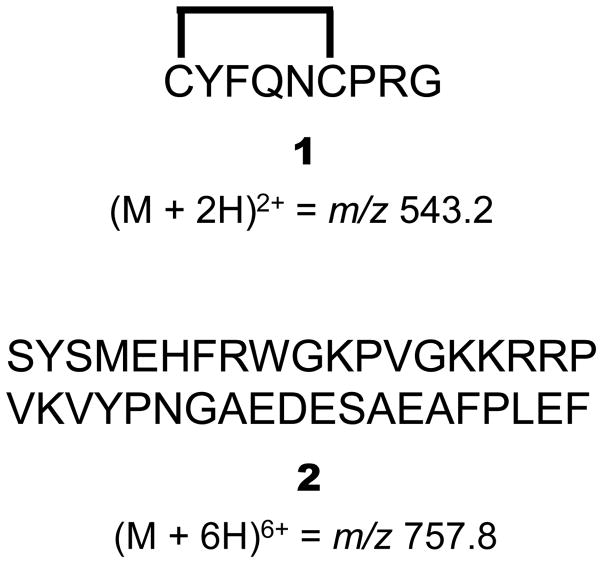
LC-MS grade Chromasolv® solvents 100/0.1 (v/v) water/formic acid (FA) and 100/0.1 (v/v) acetonitrile (ACN)/FA were obtained from Sigma Aldrich (St. Louis, MO, USA). All other solvents used in this study were of HPLC quality and purchased from Sigma Aldrich. AVP and ACTH standard (compounds 1 and 2 in Scheme 1, respectively), sinapinic acid (SA) and trifluoroacetic acid (TFA) were obtained from Sigma Aldrich.
Scheme 1.
Amino acid sequence and mass-to-charge ratio (m/z) of precursor ions for AVP (1) and ACTH (2).
Pituitary Tissue Preparation
All research subjects were recruited from surgical candidates at the neurosurgery clinic of the BWH, and gave written informed consent to the Partners Healthcare Institutional Review Board (IRB) Protocols. Pituitary adenoma samples were obtained from the BWH Neuro-Oncology Program Tissue Committee, and analyzed under approved IRB protocol. Pituitary adenoma samples were originally diagnosed as ACTH secreting pituitary adenoma (A3, A4, and A5) and non-secreting adenoma (N1) based on the clinical findings. The normal pituitary tissue used in these experiments came from a 48-year-old female who passed away from a leiomyosarcoma. The post-mortem interval until the autopsy was conducted was 18 hours. Nothing from the autopsy report indicated that there was anything abnormal about this specific tissue. Tissue sections were prepared on a Microm HM 550 (Thermo Scientific, Waltham, MA, USA) with the microtome chamber chilled at −22 °C and the specimen holder set at −18 °C. The sections were prepared at a thickness of 10 μm for MALDI chemical imaging and histochemistry analysis, and 40 μm for liquid extraction-HPLC-ESI-MS/MS analysis. For MALDI chemical imaging, the sections were thaw mounted onto indium tin oxide (ITO) glass slides (Bruker Daltonics, Billerica, MA). For liquid extraction-HPLC-ESI-MS/MS and histochemistry analyses, the sections were mounted on 1″ × 3″ optical slides (Fisher, Pittsburgh PA). The sections were kept at −80 °C until analysis. Before analysis they were brought to room temperature over 30 minutes inside a desiccator. For each mass spectrometry analysis, lipids were removed by washing each tissue with 70% EtOH for 2 minutes, followed by fresh 70% EtOH for 1 minute, and then 95% EtOH for 1 minute. After this washing, the slides were dried in a desiccator for at least 30 minutes.
Hematoxylin and Eosin Staining for Histochemical Analysis
The histochemical analysis was performed on a sister section of those samples that were analyzed by mass spectrometric techniques. The protocol was done as previously described. [36] Sections were then dried at room temperature in a hood and covered with histological mounting medium (Permount®, Fisher Chemicals, Fair Lawn, NJ) followed by a glass cover slide.
MALDI Chemical Imaging
The normal pituitary section was prepared by depositing matrix containing sinapinic acid (10 mg/mL in 60/40/0.1 (v/v/v) ACN/water/TFA) onto each ITO slide using an ImagePrep automated sprayer (Bruker Daltonics, Billerica, MA, USA). MALDI chemical imaging was then performed using an UltrafleXtreme MALDI TOF/TOF (Bruker Daltonics, Germany) equipped with a 1 kHz smartbeam laser. The spectra were acquired in positive linear mode with a mass range of m/z 500–25,000 using an external mass calibration based on a mixture of peptide and protein calibration standards. Each pixel in the chemical image was acquired with 800 laser shots and the chemical image was acquired with 100 μm spatial resolution. The MALDI images were created with the FlexImaging 4.0 software package (Bruker Daltonics, MA) using a root mean square normalization method.
Liquid Microjunction Surface Sampling-HPLC-ESI-MS/MS Analysis
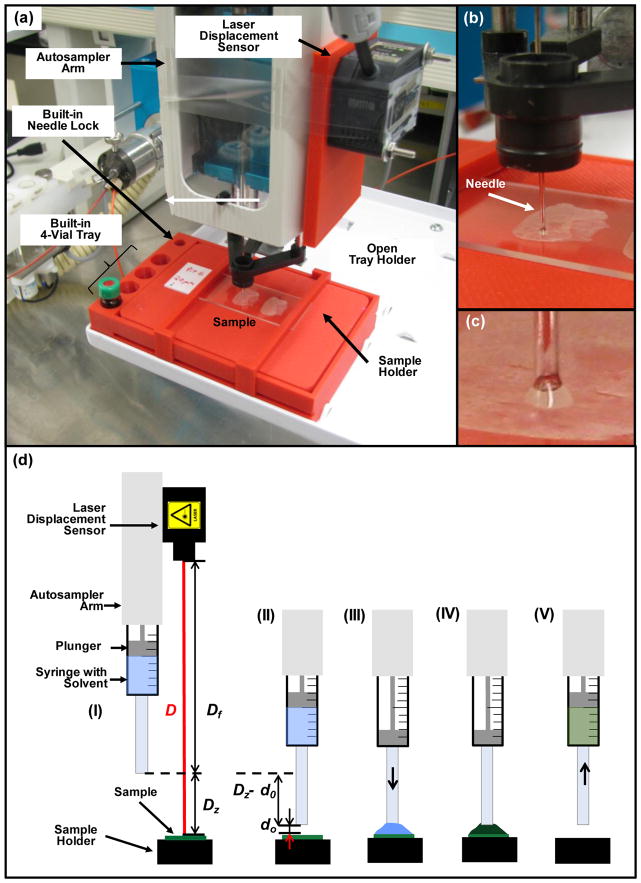
High contrast/resolution optical images of tissue samples mounted on glass slides 1″ × 3″ in size were acquired individually pre-analysis using a Dino-Lite Premier digital microscope (AnMo Electronics Corp., Taiwan) and associated software at a resolution of 3150 dpi (about 40x zoom; samples A3, A4, A5 and N1) and 1455 dpi (about 18.5x zoom; samples Pit6) for best visualization of morphological details. For analysis, glass slides holding the tissue sections were secured in a custom sample holder of size equal to a microtiter plate (Figure 1a). The custom sample holder was designed in OpenSCAD [37] and printed using acrylonitrile butadiene styrene (ABS) plastic employing a Dimension 1200es (Stratasys, Eden Prairie, MN) 3D printer. The holder included a spring-loaded sample region, space for 4 individual extraction solvent vials and a smaller diameter hole used in locking the needle guide to assist with switching the injector needle configuration into surface sampling mode. The spring-loaded mechanism was an improvement over the last series of our 3D printed custom sample trays [32] enabling a quicker sample placement and removal as compared to using double sided tape to secure the sample to the holder. The optical image of the mounted tissue for selection of surface locations to be sampled was acquired using a flatbed scanner (model Perfection v300 Photo, Epson America Inc., Long Beach, CA, USA) controlled with the in-house developed software dropletProbe Premium©. The surface sampling process utilized an HTS-PAL autosampler (LEAP Technologies Inc., Carrboro, NC) equipped with a 100-μL L-MARK® 22s-gauge gastight syringe with a fixed needle (part no: LMK- 2620719, 152 μm i.d., 717 μm o.d., LEAP Technologies Inc.). This setup was similar to that described previously [28,29,31,32]. Changes included the use of a spring loaded custom 3D printed sample holder (see above) and entire control of the autosampler by dropletProbe Premium© rather than by autosampler software LEAPShell 3™ (LEAP Technologies Inc.) [28,29,32] or by mass spectrometry software Analyst™ (AB SCIEX, Concord, Ontario, Canada) [31]. This latter change shortened the time for method development and provided more precise positioning of the autosampler syringe needle along the vertical Z-axis for an individual surface location by making a needle to surface distance measurement just prior to the sampling process. (see detailed discussion below) A standard HPLC/MS hardware profile in Analyst™ was responsible for HPLC and MS control, and data acquisition. Communication control and data flow between the instruments are illustrated in Scheme 2.
Figure 1.
(a) Photograph of the laser displacement sensor equipped HTS-PAL autosampler hosting the 3D-printed sample holder with built-in needle lock and a built-in 4-vial tray. (b) Magnified view of needle in locked position dispensing liquid onto the surface. (c) Zoomed in view of liquid junction between the tip of the needle and the sample. (d) Schematic of the surface sampling process including (I) the positioning of the laser beam above a defined surface spot followed by the measurement of the laser sensor-to-surface distance (D) from which syringe tip-to-surface distance (Dz) is then calculated using a previously determined and fixed laser sensor-to-syringe tip distance (Df), (II) the positioning of the syringe needle at a predefined distance (d0) above the defined surface spot, (III) dispensing a discrete volume of extraction solvent onto a surface creating a liquid junction between the needle and the surface, (IV) dissolution of the analyte in the extraction solvent, and (V) the liquid is drawn back into the syringe needle after a predefined extraction time.
Scheme 2.
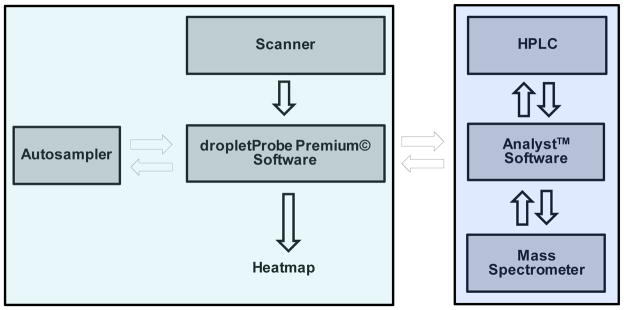
Workflow of the automated liquid microjunction surface sampling autosampler/HPLC/MS-MS system.
Surface locations to be sampled were selected using the optical image. Once the sample queue was completed (see Electronic Supplementary Material (ESM), Fig. S1), the required HPLC/MS acquisition method and MS data file names were transferred into Analyst™ via a text file to create an Analyst™ sample queue. With the system controlled by dropletProbe Premium©, surface analysis was commenced by the autosampler first drawing 5 μL of 90/10/0.1 (v/v/v) water/ACN/FA extraction solvent from a vial in one of the built-in vial holders (Figure 1a) located on the custom sample tray into the syringe needle and barrel. This was followed by switching the syringe needle configuration into surface sampling mode using the needle lock hole (Figure 1a) also located on the custom sample tray. After this, the laser distance unit was positioned above a surface location to be sampled where the laser sensor-to-surface distance (D) was measured (Figure 1d, I). Using D and a previously determined vertical offset (Df) between the laser sensor and the probe (tip of the autosampler syringe needle), the actual probe-to-surface distance (Dz = D – Df) was calculated in dropletProbe Premium©. The syringe needle was then positioned above the given surface spot and the probe was moved down vertically by Dz – d0 to obtain the predetermined optimal d0=0.2 mm probe-to-surface distance (Figure 1d, II). As illustrated in Figure 1d (III), this step was followed by dispensing a discrete volume of extraction solvent (2 μL in this work) onto a surface creating a liquid junction between the needle and the surface (Figures 1b and 1c). After a 2 s extraction time (Figure 1d, IV), the liquid was drawn back into the syringe needle (Figure 1d, V), followed by switching the needle configuration from surface sampling mode to injection mode (needle leveled with the needle guide), and the extract transferred to an injector and injected onto a XBridge™ BEH300 C4 column (2.1 × 100 mm, 3.5 μm particle size; Waters, Milford, MA, USA) for subsequent HPLC/MS analysis employing an Agilent 1100 HPLC pump (Agilent Technologies, Santa Clara, CA) to deliver the separation solvents coupled to an API 4000 triple quadrupole mass spectrometer (AB SCIEX, Concord, Ontario, Canada). Video S1 in the ESM shows the surface sampling process schematically depicted in Figure 1d. HPLC separation solvents A and B were 100/0.1 (v/v) water/FA and 100/0.1 (v/v) ACN/FA, respectively. The 10-min-long gradient separation included the following steps: 0–0.5 min: 90% A; 0.5–3 min: linear gradient to 70% A; 3–5 min: linear gradient to 20% A; 5–6 min: linear gradient to 90% A; and 6–10 min: 90% A. Solution flow rate was 200 μL/min.
Selected reaction monitoring (SRM) transitions of m/z 543.2 → 328.3 and m/z 757.8 → 876.2 were monitored for AVP (cpd 1) and ACTH (cpd 2), respectively using positive ion mode ESI with an emitter voltage of 5.0 kV employing collision energies of 27 eV (cpd 1) and 23 eV (cpd 2) with a declustering potential of 80 V. Dwell time was 50 ms for each transition monitored. Turbo sprayer heater temperature was 200 °C. Mass spectrometry conditions were optimized infusing 0.2 μM solutions of the respective proteins in 50/50/0.1 (v/v/v) water/ACN/FA. Scheme 1 shows the compound structures and the monitored precursor ions.
RESULTS AND DISCUSSION
Profiling Normal Cadaveric Human Pituitary Gland Tissue
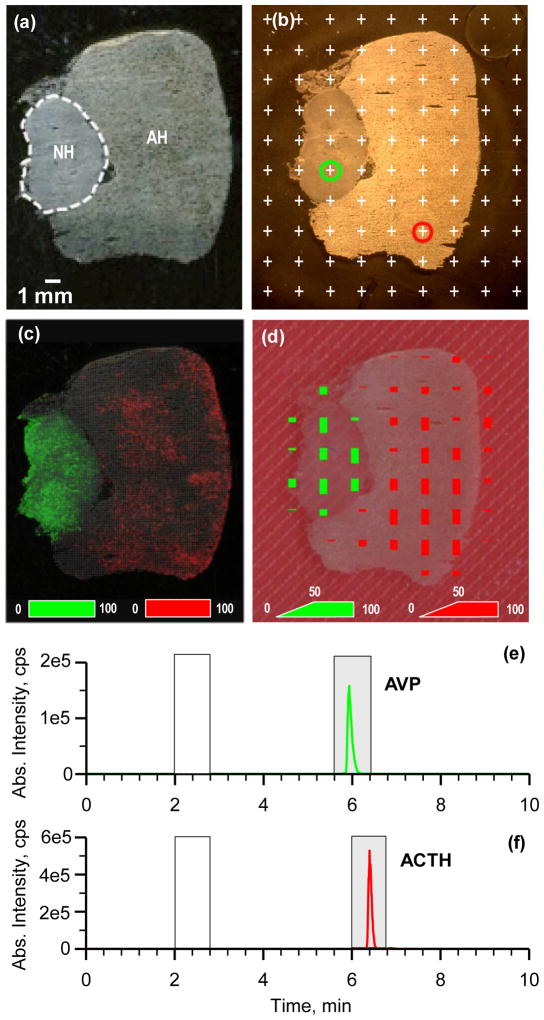
In order to assess the suitability of the current liquid microjunction surface sampling-HPLC-ESI-MS/MS system towards protein detection sister sections of a non-diseased cadaveric human pituitary gland (coded Pit6) were analyzed by MALDI imaging and by the aforementioned setup. Figure 2a shows an optical image of one of the tissues section taken before MALDI chemical imaging with both the adenohypophysis (AH) and neurohypophysis (NH) regions of the pituitary clearly visible. Distribution of AVP (green color) and ACTH (red color) obtained by MALDI chemical imaging (analysis time of 3.5 hrs, 100 μm × 100 μm pixel size) among the different tissue subtypes is shown in Figure 2c. The signal for AVP dominated the NH region while the signal for ATCH was dominant in the AH region. Figure 2b shows a scanned optical image of a sister section of the sample presented in Figure 2a. The 90 surface locations marked with white plus signs are on the nodes of a 9 × 10 grid with 2 mm spacing and represent the locations chosen for analysis by droplet-based liquid microjunction surface sampling-HPLC-ESI-MS/MS. The areas sampled included both the anterior AH and the posterior NH regions of the pituitary as well as regions outside the tissue onto the glass-mounting slide. Given the solvent and extraction conditions, the diameter of a liquid junction at the tissue surface (i.e., the area sampled) at each of these points was about 1.5 – 2 mm. The sample throughput of the system was about 11 min/sample with the time for the chromatographic separation being predominate. For the 90 sampling locations the total analysis time (including samples analyzed outside the tissue margins) was about 16.5 hrs. Chromatograms respectively associated with the circled green and red sampling positions in Figure 2b are presented in Figure 2e and 2f for the spatially resolved detection and quantitation of AVP and ACTH. These chromatograms were generated using the SRM transitions for AVP (cpd 1, m/z 543.2 → 328.3, Figure 2e) and ACTH (cpd 2, m/z 757.8 → 876.2, Figure 2f). To automatically calculate compound specific distributions of cpds 1 and 2 (i.e., heat maps), the dropletProbe Premium© software was provided with the retention time ranges for background and peak area calculation [29,31,32]. Gray and white sections show the time ranges used for peak integration (Rt=5.6–6.4 min for cpd 1, Rt=6–6.8 min for cpd 2) and background calculation (Rt=2–2.8 min for both cpds), respectively. It is important to note, that similar to earlier applications, [29,31,32] background-corrected signal only provides a relative distribution of the analyte of interest and does not necessarily reflect the absolute amounts present. The heat maps from the droplet sampling data were overlaid on the optical image to show the relative intensity of the signals detected for AVP and ATCH using green and red bars, respectively (Figure 2d). Comparison of these protein distribution results with those obtained by MALDI chemical imaging (Figure 2c) finds good agreement between the two techniques. In each data set AVP was dominant in the NH region and ACTH dominant in the AH region of the pituitary.
Figure 2.
(a) Optical image of a human pituitary gland thin tissue section taken before MALDI MSI shown in (c) with neurohypophysis and adenohypophysis regions marked. (b) Scanned optical image of a sister section of the sample presented in (a) showing the sampled surface locations (white plus signs) 2 mm apart. (c) Chemical images of (green) AVP (cpd 1, m/z 1085±1 Da) and (red) ACTH (cpd 2, m/z 4542±1 Da) obtained by MALDI MSI with a pixel size of 100 μm × 100 μm with intensity scales shown in the bottom. (d) Heatmaps of (green) cpd 1 and (red) cpd 2 obtained analyzing the tissue shown in (b) by droplet-based liquid microjunction surface sampling-HPLC-ESI-MS/MS. Intensity scales (height of corresponding bars) to create heatmaps are shown in the bottom. 100% intensity corresponds to 9.52×10⁵ and 2.64×10⁶ counts for cpds 1 and 2, respectively. Signal levels at sampling spots marked with green and red circles in (c) were recorded during a 10 min HPLC/MS-MS analysis for (e) cpd 1 (m/z 543.2 → 328.3) and (f) cpd 2 (m/z 757.8 → 876.2). Gray and white sections show the time ranges used for peak integration (Rt=5.6–6.4 min for cpd 1, Rt=6–6.8 min for cpd 2) and background calculation (Rt=2–2.8 min for both cpds), respectively.
Profiling Multiple Normal and Tumor Human Pituitary Gland Tissues
The analytical utility of the current droplet-based liquid extraction surface sampling-HPLC-ESI-MS/MS system for potential clinical application was evaluated for the analysis of cadaveric non-tumor pituitary gland thin tissue sections (Pit6, see above), and surgically removed ACTH secreting (coded A3, A4, and A5, obtained from different specimens) and non-secreting (coded N1) pituitary adenomas. A subset of pituitary adenoma, microadenomas, are too small to be detected with diagnostic imaging such as magnetic resonance imaging (MRI), but the presentation of clinical symptoms triggered by the overproduction of pituitary hormones suggests the presence of a pituitary tumor. [38,39] Cushing syndrome is observed in patients affected by ACTH secreting adenomas.[39] The ability to directly localize the tumor during pituitary surgery through the detection of hormone levels differing between malignant and normal tissues would significantly enhance surgical precision and allow preservation of healthy functioning gland.
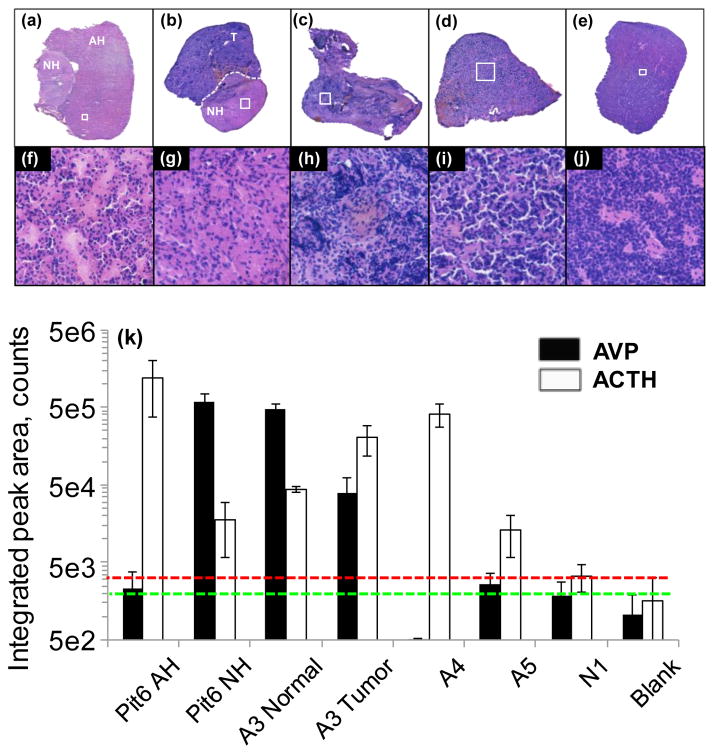
Optical images of H&E-stained samples are shown in Figures 3a–e. Portions of the same tissues are shown with higher magnification images (corresponding to areas marked by white rectangles in Figures 3a–e) in Figures 3f–j (areas of about 0.28 mm × 0.28 mm in size) to resolve detailed histological information. Figure 3k shows averaged integrated chromatographic peak areas with standard deviation for AVP and ACTH levels for Pit6 AH and NH regions, normal NH and ACTH secreting malignant regions of sample A3, ACTH secreting A4 and A5 tumor samples and non-secreting N1 pituitary adenomas, and for clean glass slide surface used as blank. (These values are also summarized in Table S1 in the ESM.) The green and red dashed lines in the plot indicate background signal levels plus standard deviation for AVP and ACTH, respectively. Three tissue samples at a minimum of two different locations apiece were analyzed for each tissue subtype. Individual sampled locations and corresponding integrated signal levels of AVP and ACTH for samples Pit6, A3, A4, A5 and N1 are shown in the ESM in Figures S2–S6, respectively. Due to their expected chemical variability, results for different regions of samples coded Pit6 and A3 are shown separately in Figure 3k. In agreement with the known histological presentation of normal pituitary gland sample Pit6, ACTH and AVP were found dominant respectively in the AH and NH regions of the gland. Protein levels in the normal NH region of sample A3 were found to be similar to that of the NH region of Pit 6, as expected. However, higher ACTH levels were found in the tumor region of A3 as delineated by histopathology evaluation. In addition, elevated AVP level for this sample indicated the possible NH origin of this malignant tissue. ACTH secreting sample A4, that indicated a highly tumorous structure on the H&E-stained images in Figures 3c and 3h, exhibited a high level of ACTH while AVP signal was negligible. Histopathological evaluation of ACTH secreting sample A5 suggested a similar structure to that of the AH region of normal Pit6 with some indication of tumor penetration in the tissue (see Figures 3f and 3i). In agreement with histopathology, protein levels were found to be similar to that of AH region of Pit 6 with ACTH level being about 10x above background level. Finally, highly malignant (see Figure 3j) non-ACTH secreting tumor sample N1 exhibited protein signals that were statistically at background level.
Figure 3.
Optical images of H&E-stained samples: (a) Pit6 - non-tumor pituitary gland showing AH and NH regions; (b) A3 – ACTH secreting tumor (T) region and normal pituitary NH region; (c) A4 - ACTH secreting tumor; (d) A5 - ACTH secreting tumor; (e) N1 – non-ACTH secreting adenoma. (f)–(j) Zoomed in areas marked by white rectangles (all representing an area of about 0.28 mm × 0.28 mm in size) in (a)–(e), respectively. (k) Integrated chromatographic peak areas of (filled columns) AVP and (empty columns) ACTH obtained for the different tissue samples. Green and red dashed lines indicate background signal levels with standard deviation added for AVP and ACTH, respectively.
CONCLUSION
We here described the profiling of two proteins – AVP and ACTH – from normal human pituitary gland and pituitary adenoma tissue sections using a fully automated droplet-based liquid extraction-HPLC-ESI-MS/MS system. Heat maps of the two proteins of interest recorded with 2-mm-spatial resolution over a cadaveric normal human pituitary gland revealed that AVP was found to be most concentrated in the posterior neurohypophysis and ACTH was found predominantly in the anterior adenohypophysis regions. These results were in good agreement with results obtained by MALDI chemical imaging, and aligned with the known distribution of these hormones in the pituitary. In addition, ACTH and AVP levels obtained from surgically removed ACTH secreting and non-secreting pituitary adenomas agreed with histopathology evaluation of these samples.
On the basis of these results and the relative simplicity, rapidity and specificity of the current methodology, the potential exists for this basic technology, with further advancement, to be used to assist surgical decision-making. In the present work, profiling of ACTH and AVP took 11 min per sample with the time for the chromatographic separation being predominate. This timeframe is comparable to that of traditional histopathology evaluation, while providing detailed molecular information currently unattainable during surgery. Switching from HPLC to current state-of-the-art ultra performance liquid chromatography (UPLC) would already offer a 5–8 time decrease in chromatography separation time (current 10 minutes) with concomitant improvement in detection sensitivity and chromatographic resolution [40]. This envisions that separation of all common pituitary proteins with an upper molecular weight of about 24 kDa [41] can be accomplished in about 3–4 min based on our experience separating proteins with a molecular weight around 15–16 kDa [30].
More broadly, monitoring proteins levels in a rapid fashion could have numerous additional applications that could be highly transformative for surgery. For instance, the ability to detect specific pituitary hormones may have an application in the evaluation of pituitary tumor resection specimens – particularly those of microadenomas such as those that secrete ACTH and other hormones like prolactin or growth hormone. Such tumors are only millimeters in size and can be difficult for surgeons to visualize and for pathologists to detect by microscopic review of H&E stained frozen sections. Our previous work demonstrated successful sampling of crude cut bulk tissues [32] with sampling locations that differed in height by as much as 1.9 mm, and some samples as narrow as 1 mm. Those results pave the way for testing this automated sampling system in various diagnostic applications including for cancer detection from tissue biopsy samples directly in the operating environment without the need of a skilled operator.
Supplementary Material
Acknowledgments
This project was supported by AB Sciex through a Cooperative Research and Development Agreement (CRADA NFE-10-02966). The API 4000 used in this work was provided on loan from AB Sciex as part of the CRADA. NYRA was supported by the Daniel E. Ponton Fund for the Neurosciences, the DFCI Pediatric Low-Grade Astrocytoma (PLGA) Program, and the NIH Director’s New Innovator Award (Grant 1DP2OD007383-01). The authors would like to thank Aaron Bickel, James Glick and Jimmy Flarakos from Novartis Institutes for Biomedical Research (Cambridge, MA) for their valuable help in 3D printing of the custom tray. ORNL is managed by UT-Battelle, LLC for the U.S. Department of Energy under contract DE-AC05-00OR22725.
Biographies

David Calligaris, PhD, is currently a postdoctoral researcher at Brigham and Women’s Hospital-Harvard Medical School. He received in 2011 his PhD in Biochemistry from Aix- Marseille University, Marseille, France. His research is focusing on biological mass spectrometry applied to cancer research.
Daniel Feldman received his B.S. in chemistry and biology from Brandeis University in 2012. Following his undergraduate education, he worked as a research assistant in the Surgical Molecular Imaging Lab at Brigham and Women’s Hospital. He is currently pursuing a medical degree at Drexel University College of Medicine.

Armen Changelian received his B.A. in biological sciences from Northwestern University in 2014. He performed research as a visiting student at the McGovern Institute for Brain Research at MIT, focusing on the role of differential gene expression in neurodegenerative disorders. He currently works as a technical research assistant in the Surgical Molecular Imaging Lab at Brigham and Women’s Hospital.

Edward R. Laws, Jr., MD, is the Director; Professor Emeritus of Neurological Surgery at Brigham and Women’s Hospital, Boston, MA. He received his doctoral degree from Johns Hopkins University School of Medicine, Baltimore, MD, and completed his residency at Johns Hopkins Hospital. His clinical interests include pituitary tumors, low-grade gliomas, malignant gliomas, craniopharyngioma, minimally invasive transnasal endoscopic pituitary surgery, and extended transsphenoidal surgery for parasellar tumors.

Sandro Santagata, MD PhD, is an Assistant Professor of Pathology at Harvard Medical School; Neuropathologist at the Brigham and Women’s Hospital and an Affiliated Member at the Broad Institute. He leads a laboratory at the Harvard Institute of Medicine on understanding the molecular pathology of brain tumors. He completed his MD, PhD at Mount Sinai Medical School of New York University in 2002 (New York, NY) and received a certification of anatomic pathology and neuropathology from the American Board of Pathology in 2007.

Nathalie Y.R. Agar, PhD, is the founding Director of the Surgical Molecular Imaging Laboratory (SMIL) in the Department of Neurosurgery at Brigham and Women’s Hospital, and Assistant Professor of Surgery and of Radiology at Harvard Medical School. Her multidisciplinary training includes a B.Sc. in Biochemistry (1997), PhD in Chemistry (2002), a postdoctoral fellowship in Neurology and Neurosurgery from McGill University, and further postdoctoral training in Neurosurgery at the Brigham and Women’s Hospital. From this unique background, she has developed a research program integrating approaches from chemistry to improve the care of patients affected by brain tumors.

Vilmos Kertesz, PhD, is a research staff scientist at the Oak Ridge National Laboratory. He received his PhD in 1997 in electrochemistry from Eotvos Lorand Science University, Budapest, Hungary. His research is focusing on atmospheric pressure surface sampling and ionization methods for sensitive, automated, high throughput analysis and chemical imaging of analytes on surfaces.

Gary J. Van Berkel, PhD, is a distinguished scientist and Leader of the Organic and Biological Mass Spectrometry Group at the Oak Ridge National Laboratory. He received his PhD in Analytical Chemistry from Washington State University, Pullman, WA in 1987. His research interests are in the area of atmospheric pressure ionization source fundamentals and ambient based methods for surface sampling and ionization combined with mass spectrometry for chemical profiling and imaging of surfaces.
Footnotes
This manuscript has been authored by UT-Battelle, LLC under Contract No. DE-AC05–00OR22725 with the U.S. Department of Energy. The United States Government retains and the publisher, by accepting the article for publication, acknowledges that the United States Government retains a non-exclusive, paid-up, irrevocable, world-wide license to publish or reproduce the published form of this manuscript, or allow others to do so, for United States Government purposes. The Department of Energy will provide public access to these results of federally sponsored research in accordance with the DOE Public Access Plan (http://energy.gov/downloads/doe-public-access-plan).
References
- 1.Santagata S, Eberlin LS, Norton I, Calligaris D, Feldman DR, Ide JL, Liu X, Wiley JS, Vestal ML, Ramkissoon SH, Orringer DA, Gilla KK, Dunn IF, Dias-Santagata D, Ligon KL, Jolesz FA, Golby AJ, Cooks RG, Agar NYR. PNAS. 2014;111:11121–11126. doi: 10.1073/pnas.1404724111. [DOI] [PMC free article] [PubMed] [Google Scholar]
- 2.Balog J, Sasi-Szabo L, Kinross J, Lewis MR, Muirhead LJ, Veselkov K, Mirnezami R, Dezso B, Damjanovich L, Darzi A, Nicholson JK, Takats Z. Sci Trans Med. 2013;5:194ra93. doi: 10.1126/scitranslmed.3005623. [DOI] [PubMed] [Google Scholar]
- 3.Goodman S, O’Connor A, Kandil D, Khan A. Arch Pathol Lab Med. 2014;138:57–64. doi: 10.5858/arpa.2012-0441-RA. [DOI] [PubMed] [Google Scholar]
- 4.Rey-Dios R, Hattab EM, Cohen-Gadol AA. Acta Neurochir. 2014;156:1071–1075. doi: 10.1007/s00701-014-2097-6. [DOI] [PubMed] [Google Scholar]
- 5.Spicer J, Benay C, Lee L, Rousseau M, Andalib A, Kushner Y, Marcus V, Ferri L. Ann Surg Oncol. 2014;21:2580–2586. doi: 10.1245/s10434-014-3669-7. [DOI] [PubMed] [Google Scholar]
- 6.Ramos-Vara JA, Miller MA. Vet Pathol. 2014;51:42–87. doi: 10.1177/0300985813505879. [DOI] [PubMed] [Google Scholar]
- 7.Eberlin LS, Norton I, Dill AL, Golby AJ, Ligon KL, Santagata S, Cooks RG, Agar NYR. Cancer Res. 2012;72:645–654. doi: 10.1158/0008-5472.CAN-11-2465. [DOI] [PMC free article] [PubMed] [Google Scholar]
- 8.Eberlin LS, Liu XH, Ferreira CR, Santagata S, Agar NYR, Cooks RG. Anal Chem. 2011;83:8366–8371. doi: 10.1021/ac202016x. [DOI] [PMC free article] [PubMed] [Google Scholar]
- 9.Calligaris D, Caragacianu D, Liu X, Norton I, Thompson CJ, Richardson AL, Golshan M, Easterling ML, Santagata S, Dillon DA, Jolesz FA, Agara NYR. PNAS. 2014;111:15184–15189. doi: 10.1073/pnas.1408129111. [DOI] [PMC free article] [PubMed] [Google Scholar]
- 10.Balog J, Szaniszlo T, Schaefer KC, Denes J, Lopata A, Godorhazy L, Szalay D, Balogh L, Sasi-Szabo L, Toth M, Takats Z. Anal Chem. 2010;82:7343–7350. doi: 10.1021/ac101283x. [DOI] [PubMed] [Google Scholar]
- 11.Kertesz V, Van Berkel GJ, Vavrek M, Koeplinger KA, Schneider BB, Covey TR. Anal Chem. 2008;80:5168–5177. doi: 10.1021/ac800546a. [DOI] [PubMed] [Google Scholar]
- 12.Van Berkel GJ, Pasilis SP, Ovchinnikova O. J Mass Spectrom. 2008;43:1161–1180. doi: 10.1002/jms.1440. [DOI] [PubMed] [Google Scholar]
- 13.Van Berkel GJ, Sanchez AD, Quirke JME. Anal Chem. 2002;74:6216–6223. doi: 10.1021/ac020540+. [DOI] [PubMed] [Google Scholar]
- 14.Van Berkel GJ, Kertesz V, King RC. Anal Chem. 2009;81:7096–7101. doi: 10.1021/ac901098d. [DOI] [PubMed] [Google Scholar]
- 15.Van Berkel GJ, Kertesz V, Koeplinger KA, Vavrek M, Kong AT. J Mass Spectrom. 2008;43:500–508. doi: 10.1002/jms.1340. [DOI] [PubMed] [Google Scholar]
- 16.Kertesz V, Van Berkel GJ. J Mass Spectrom. 2010;45:252–260. doi: 10.1002/jms.1709. [DOI] [PubMed] [Google Scholar]
- 17.Edwards RL, Griffiths P, Bunch J, Cooper HJ. Proteomics. 2014;14:1232–1238. doi: 10.1002/pmic.201300316. [DOI] [PubMed] [Google Scholar]
- 18.Randall EC, Bunch J, Cooper HJ. Anal Chem. 2014;86:10504–10510. doi: 10.1021/ac503349d. [DOI] [PubMed] [Google Scholar]
- 19.Sarsby J, Martin NJ, Lalor PF, Bunch J, Cooper HJ. J Am Soc Mass Spectrom. 2014;25:1953–1961. doi: 10.1007/s13361-014-0967-z. [DOI] [PMC free article] [PubMed] [Google Scholar]
- 20.Martin NJ, Bunch J, Cooper HJ. J Am Soc Mass Spectrom. 2013;24:1242–1249. doi: 10.1007/s13361-013-0658-1. [DOI] [PMC free article] [PubMed] [Google Scholar]
- 21.Edwards RL, Creese AJ, Baumert M, Griffiths P, Bunch J, Cooper HJ. Anal Chem. 2011;83:2265–2270. doi: 10.1021/ac1030804. [DOI] [PMC free article] [PubMed] [Google Scholar]
- 22.Edwards RL, Griffiths P, Bunch J, Cooper HJ. J Am Soc Mass Spectrom. 2012;23:1921–1930. doi: 10.1007/s13361-012-0477-9. [DOI] [PubMed] [Google Scholar]
- 23.Rao W, Celiz AD, Scurr DJ, Alexander MR, Barrett DA. J Am Soc Mass Spectrom. 2013;24:1927–1936. doi: 10.1007/s13361-013-0737-3. [DOI] [PMC free article] [PubMed] [Google Scholar]
- 24.Tomlinson L, Fuchser J, Futterer A, Baumert M, Hassall DG, West A, Marshall PS. Rapid Commun Mass Spectrom. 2014;28:995–1003. doi: 10.1002/rcm.6869. [DOI] [PubMed] [Google Scholar]
- 25.Geho MD, Espina V, Liotta LA, Petricoin EF, Wulfkuhle JD. In: Chapter 9. “Clinical Proteomics” in Molecular Genetic Pathology. Cheng L, Zhang DY, editors. Humana Press; Totowa, NJ: 2008. [Google Scholar]
- 26.Masucci JA, Mahan AD, Kwasnoski JD, Caldwell GW. Current Topics Med Chem. 2012;12:1243–1249. doi: 10.2174/156802612800672916. [DOI] [PubMed] [Google Scholar]
- 27.Ackermann BL, Berna MJ, Eckstein JA, Ott LW, Chaudhary AK. Ann Rev Anal Chem. 2008;1:357–396. doi: 10.1146/annurev.anchem.1.031207.112855. [DOI] [PubMed] [Google Scholar]
- 28.Kertesz V, Van Berkel GJ. Anal Chem. 2010;82:5917–5921. doi: 10.1021/ac100954p. [DOI] [PubMed] [Google Scholar]
- 29.Kertesz V, Van Berkel GJ. Bioanal. 2013;5:819–826. doi: 10.4155/bio.13.42. [DOI] [PubMed] [Google Scholar]
- 30.Van Berkel GJ, Kertesz V. Rapid Commun Mass Spectrom. 2013;27:1329–1334. doi: 10.1002/rcm.6580. [DOI] [PubMed] [Google Scholar]
- 31.Kertesz V, Paranthaman N, Moench P, Catoire A, Flarakos J, Van Berkel GJ. Bioanal. 2014;6:2599–2606. doi: 10.4155/bio.14.130. [DOI] [PubMed] [Google Scholar]
- 32.Kertesz V, Weiskittel TM, Van Berkel GJ. Anal Bioanal Chem. 2015;407:2117–2125. doi: 10.1007/s00216-014-8287-5. [DOI] [PubMed] [Google Scholar]
- 33.Abu-Rabie P, Spooner N. Bioanal. 2011;3:2769–2781. doi: 10.4155/bio.11.270. [DOI] [PubMed] [Google Scholar]
- 34.Heinig K, Wirz T, Gajate-Perez A. Bioanal. 2010;2:1873–1882. doi: 10.4155/bio.10.133. [DOI] [PubMed] [Google Scholar]
- 35.Kertesz V, Van Berkel GJ. Rapid Commun Mass Spectrom. 2014;28:1553–1560. doi: 10.1002/rcm.6931. [DOI] [PubMed] [Google Scholar]
- 36.Calligaris D, Norton I, Feldman DR, Ide JL, Dunn IF, Eberlin LS, Cooks RG, Jolesz FA, Golby AJ, Santagata S, Agar NY. J Mass Spectrom. 2013;48:1178–1187. doi: 10.1002/jms.3295. [DOI] [PMC free article] [PubMed] [Google Scholar]
- 37.OpenSCAD is Free Software released under the General Public License version 2 http://www.openscad.org. Last checked on May 1, 2015.
- 38.Aihara H, Tamaki N, Ueyama T, Ishihara Y, Kondoh T. Neuro Surg. 1996;24:1119–1123. [PubMed] [Google Scholar]
- 39.Flitsch J, Schmid SM, Bernreuther C, Winterberg B, Ritter MM, Lehnert H, Burkhardt T. Pituitary. 2014;18:279–282. doi: 10.1007/s11102-014-0591-8. [DOI] [PubMed] [Google Scholar]
- 40.http://www.waters.com/webassets/cms/library/docs/720002064en.pdf Last checked on May 1 2015
- 41.Nussey S, Whitehead S. Endocrinology: An Integrated Approach, Chapter 7: The pituitary gland. BIOS Scientific Publishers; Oxford: 2001. [PubMed] [Google Scholar]
Associated Data
This section collects any data citations, data availability statements, or supplementary materials included in this article.


