

Abstract
Summary: Precision-recall (PR) and receiver operating characteristic (ROC) curves are valuable measures of classifier performance. Here, we present the R-package PRROC, which allows for computing and visualizing both PR and ROC curves. In contrast to available R-packages, PRROC allows for computing PR and ROC curves and areas under these curves for soft-labeled data using a continuous interpolation between the points of PR curves. In addition, PRROC provides a generic plot function for generating publication-quality graphics of PR and ROC curves.
Availability and implementation: PRROC is available from CRAN and is licensed under GPL 3.
Contact: grau@informatik.uni-halle.de
1 Introduction
The assessment of classifier performance is a recurring task in machine learning and data mining, and in particular in bioinformatics applications. It assists researchers in identifying the most promising approach for the classification problem at hand. For binary classification tasks, the receiver operating characteristic (ROC) curve and the area under this curve (AUC-ROC) are widely accepted as a general measure of classifier performance. In many bioinformatics applications, however, positive examples are substantially less abundant than negative examples, resulting in a highly imbalanced class ratio. For instance, the number of target genes of a microRNA is substantially smaller than the number of non-target genes. In such cases, the precision-recall (PR) curve and AUC (AUC-PR) is better suited for comparing the performance of individual classifiers than the ROC curve and AUC-ROC (Davis et al., 2005).
Often, the decision for the true class labels of a given data point is arguable and, for instance, based on an arbitrary threshold for some continuous measurement or based on multiple, possibly contradictory, expert labelings. However, the choice of this threshold decisively influences classifier training and assessment. One solution to this problem is the transition from hard-labeling to soft-labeling, where each data point is assigned to both classes with a certain probability that reflects confidence in the labeling (Grau et al., 2013; Mihaljevic et al., 2014). Although soft-labeling has been used extensively for classifier training in the past, it has been neglected for classifier assessment (Keilwagen et al., 2014).
Computing empirical AUC-PR and AUC-ROC values from a limited set of test data points requires interpolation between discrete supporting points corresponding to a series of classification threshold affecting the classification result. AUC-ROC can be computed by linear interpolation between the supporting points of the curve for hard-labeled and soft-labeled data. In contrast, Davis and Goadrich (2006) show that for AUC-PR an interpolation along the true positives is more accurate than linear interpolation for hard-labeled data, while Boyd et al. (2013) and Keilwagen et al. (2014) propose a more fine-grained, continuous interpolation between the supporting points of the PR curve. Only the latter can also be used for soft-labeled data (Keilwagen et al., 2014).
In Table 1, we list several common R-packages for computing PR or ROC curves or their AUCs, which in some cases provide further performance measures. For PR curves, however, none of the previous packages uses the more accurate interpolation of Davis and Goadrich (2006) or the continuous interpolation of Boyd et al. (2013) and Keilwagen et al. (2014). Hence, none of these packages is applicable to soft-labeled data.
Table 1.
R-packages for computing PR and ROC curves, and their AUCs; “both”: AUC and curve can be computed; “linear”: linear interpolation, “DG”: interpolation of Davis and Goadrich (2006), “con.”: interpolation of Boyd et al. (2013); Keilwagen et al. (2014)
| Package | AUC | PerfMeas | pROCa | ROCRb | PRROC |
|---|---|---|---|---|---|
| Version | 0.3.0 | 1.2.1 | 1.7.3 | 1.0–5 | 1.1 |
| PR curve | |||||
| Hard-labeled | No | Both | No | Curve | Both |
| Interpolation | N/A | Linear | N/A | Linear | DG/con |
| Soft-labeled | No | No | No | No | Both |
| ROC curve | |||||
| Hard-labeled | Both | AUC | Both | Both | Both |
| Soft-labeled | No | No | No | No | Both |
| Plotting | Yes | Std. R | Yes | Yes | Yes |
In this article, we present the R-package PRROC, which closes both gaps by (i) using the continuous interpolation of Keilwagen et al. (2014) for computing and drawing PR curves and, by this means, (ii) enabling the computation of PR and ROC curves, and AUC-PR and AUC-ROC for soft-labeled and hard-labeled data. In addition, PRROC optionally computes curves and AUC values for the optimal, the worst and the random classifier as a reference. These references are particularly useful for (a) PR curves and (b) ROC and PR curves in case of soft-labeled data, where, for instance, the minimum and maximum AUC might differ from 0 and 1, respectively. Finally, PRROC provides a plotting function for generating publication-quality plots of PR and ROC curves.
2 Use cases
In this section, we present typical applications of the PRROC R-package. Complete listings of the corresponding R-code and further examples are available in the R vignette of PRROC.
First, we consider the scenario that we developed a novel approach for a classification problem with ‘hard class labels’ and now want to assess its performance on an independent test dataset. Further assume that the classification scores of the data points belonging to the positive class are stored in a vector fg, and those of the negative class in bg. Using PRROC, we can compute the ROC and PR curve, respectively, by
roc<-roc.curve(fg,bg,curve=T);
pr<-pr.curve(fg,bg,curve=T);
obtain the AUC values with print(roc); print(pr), and plot the curves with plot(roc); plot(pr). An ROC curve obtained by this procedure is shown in the left panel of Figure 1.
Fig. 1.
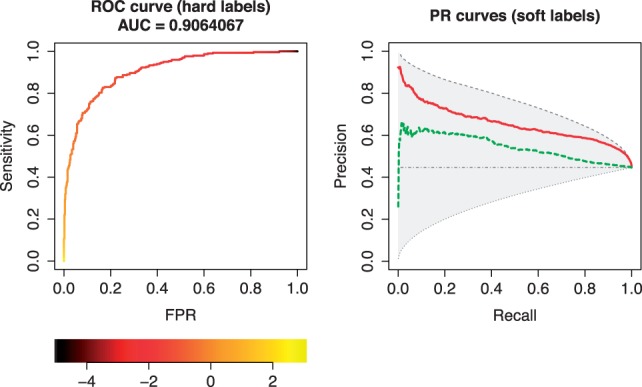
Plots of ROC (left) and PR (right) curves generated by PRROC. For the ROC curve, we consider hard-labeled data and show the plotting variant with a color scale that indicates classification thresholds yielding the points on the curve. For the PR curve, we consider soft-labeled data and show a comparative plot for two classifiers as solid and dashed lines. We also include the maximal and minimal possible curves and the curve of a random classifier for the given soft-labels
Alternatively, classification scores for both classes may be stored in one joint vector (x) and the corresponding class labels (1/0 for positive/negative class) in another vector (lab). In this case, we can compute the ROC and PR curves by
roc<-roc.curve(x,weights.class0=lab,curve=T);
pr<-pr.curve(x,weights.class0=lab,curve=T);
Second, we consider a scenario for a classification problem with ‘soft class labels’, where each data point belongs to the positive class with probability P and to the negative class with probability (1−P). We assume that the classification scores are again stored in one joint vector (x) and the soft-labels, i.e., the probability of belonging to the positive class for each data point, in another vector (w). Using PRROC, we can compute the PR curve as well as the minimum and maximum curve, and the curve for the random classifier by
pr.1<-pr.curve(x,weights.class0=w,curve=T,
max.compute=T,min.compute=T,rand.compute=T)
Analogously, we compute the PR curve pr.2 for another classifier and plot both curves together with the maximum and minimum curve, and the curve of the random classifier by
plot(pr.1,col=2,max.plot=T,min.plot=T, rand.plot=T,fill.area=T,auc.main=F);
plot(pr.2,col=3,add=T)
A plot obtained by this procedure is shown in the right panel of Figure 1. We clearly see the difference in performance of the two classifiers and may conclude that the ranking implied by the classification scores behind the solid curve reconstructs the soft-labels with greater accuracy.
3 Discussion
We present PRROC, an R-package for computing PR and ROC curves as well as their AUCs for soft-labeled and hard-labeled data, which may be beneficial for typical bioinformatics applications. Additionally, PRROC provides a function for plotting PR and ROC curves within R. The PRROC package provides R documentation files and a vignette.
Conflict of Interest: none declared.
References
- Boyd K., et al. (2013) Area under the precision-recall curve: point estimates and confidence intervals. In: Blockeel H., Kersting K., Nijssen S., Železný F. (ed.) Machine Learning and Knowledge Discovery in Databases. Vol. 8190 of LNCS. Springer, Berlin, pp. 451–466. [Google Scholar]
- Davis J., Goadrich M. (2006) The relationship between precision-recall and ROC curves. In: Proceedings of the 23rd International Conference on Machine Learning. ACM, New York, pp. 233–240. [Google Scholar]
- Davis J., et al. (2005) View learning for statistical relational learning: with an application to mammography. In: Proceeding of the 19th International Joint Conference on Artificial Intelligence, pp. 677–683. [Google Scholar]
- Grau J., et al. (2013) A general approach for discriminative de novo motif discovery from high-throughput data. Nucleic Acids Res.,41,e197. [DOI] [PMC free article] [PubMed] [Google Scholar]
- Keilwagen J., et al. (2014) Area under precision-recall curves for weighted and unweighted data. PLoS One, 9, e92209. [DOI] [PMC free article] [PubMed] [Google Scholar]
- Mihaljevic B., et al. (2014) Multi-dimensional classification of GABAergic interneurons with Bayesian network-modeled label uncertainty. Front. Comput. Neurosci., 8, 150. [DOI] [PMC free article] [PubMed] [Google Scholar]
- Robin X., et al. (2011) pROC: an open-source package for R and S+ to analyze and compare ROC curves. BMC Bioinformatics, 12, 77. [DOI] [PMC free article] [PubMed] [Google Scholar]
- Sing T., et al. (2005) ROCR: visualizing classifier performance in R. Bioinformatics, 21, 3940–3941. [DOI] [PubMed] [Google Scholar]