

Abstract
The field of proton lung MRI is advancing on a variety of fronts. In the realm of functional imaging, it is now possible to use arterial spin labeling (ASL) and oxygen-enhanced imaging techniques to quantify regional perfusion and ventilation, respectively, in standard units of measure. By combining these techniques into a single scan, it is also possible to quantify the local ventilation-perfusion ratio, which is the most important determinant of gas-exchange efficiency in the lung. To demonstrate potential for accurate and meaningful measurements of lung function, this technique was used to study gravitational gradients of ventilation, perfusion, and ventilation-perfusion ratio in healthy subjects, yielding quantitative results consistent with expected regional variations.
Such techniques can also be applied in the time domain, providing new tools for studying temporal dynamics of lung function. Temporal ASL measurements showed increased spatial-temporal heterogeneity of pulmonary blood flow in healthy subjects exposed to hypoxia, suggesting sensitivity to active control mechanisms such as hypoxic pulmonary vasoconstriction, and illustrating that to fully examine the factors that govern lung function it is necessary to consider temporal as well as spatial variability. Further development to increase spatial coverage and improve robustness would enhance the clinical applicability of these new functional imaging tools.
In the realm of structural imaging, pulse sequence techniques such as ultrashort echo-time (UTE) radial k-space acquisition, ultrafast steady-state free precession (SSFP), and imaging-based diaphragm triggering can be combined to overcome the significant challenges associated with proton MRI in the lung, enabling high-quality three-dimensional imaging of the whole lung in a clinically reasonable scan time. Images of healthy and cystic fibrosis subjects using these techniques demonstrate substantial promise for non-contrast pulmonary angiography and detailed depiction of airway disease. Although there is opportunity for further optimization, such approaches to structural lung imaging are ready for clinical testing.
Keywords: functional lung imaging, arterial spin labeling, specific ventilation imaging, ventilation-perfusion ratio, oxygen-enhanced pulmonary MRI, structural lung imaging, ultrashort echo time, respiratory triggering
Introduction
Proton-based MRI has not historically played a large role in human lung imaging. At the 2013 International Pulmonary Imaging Workshop held at the University of Pennsylvania, only 6 of the 70 oral presentations centered on proton lung MRI, despite the fact that most medical centers in the developed world have access to a clinical MRI scanner. By contrast, there were 20 presentations involving hyperpolarized-gas MRI, which can currently be performed at only a handful of research centers worldwide.
The root of this disparity lies in the unfortunate reality that the lung is an unfriendly environment for proton MRI. Water density in the lung varies from about 10-25% depending on inflation level [1], compared with 80-90% for most body tissues. The T2* of lung parenchyma is also unusually small, ranging from about 1 ms at total lung capacity to 2 ms at residual volume [1]. Respiratory motion presents an additional challenge. Breath-hold duration is generally limited to 20-30 seconds even in the most cooperative subjects, inhibiting the ability to signal average to overcome the signal limitations in the lung. Consequently, it has not been possible to achieve the same level of diagnostic image quality from lung MRI that we have become accustomed to in other parts of the body.
A variety of different pulse sequence techniques and acquisition procedures have been developed to address these challenges. One such technique is ultrashort echo-time (UTE) MRI, which is specifically designed to image short T2* tissues such as lung parenchyma [2] and cortical bone [3]. This technique is usually implemented by sampling k space on a spoke-radial trajectory, which naturally lends itself to three-dimensional (3D) acquisition. However, imaging times of several minutes are required to achieve fine spatial resolution. Thus to apply this technique in the lung, some form of respiratory gating must be used [4]. Despite this limitation, radial UTE techniques offer significant promise for high-quality diagnostic imaging in the lung [5].
Although the T2* of lung parenchyma is much shorter than most soft tissues in the body, it is still long enough to obtain useful signal from a conventional gradient-echo acquisition, for instance to quantify water density in the lung [1]. By using extremely short repetition times (TR < T2*), it is also possible to make effective use of balanced steady-state free precession (SSFP) pulse sequences for imaging lung parenchyma [6]. Whereas a spoiled gradient-echo pulse sequence scrambles any remaining transverse magnetization before the next excitation RF pulse, a coherent pulse sequence such as balanced SSFP recycles this magnetization into the next TR window, enhancing the steady-state signal from on-resonance spins. In the lung, this technique could partially offset the low signal density in the parenchyma.
The short T2* of lung parenchyma primarily results from spin dephasing in the presence of magnetic-field variations caused by the numerous air/tissue interfaces in the alveoli. However these field variations are largely static at constant lung volume, making it possible to partially reverse this dephasing by applying refocusing RF pulses. The T2 is much longer than T2* in the lung, and is actually similar to that of other body tissues. This makes it possible to obtain useful signal-to-noise ratio (SNR) in the parenchyma during a breath-hold acquisition, by imaging thick slices of the lung using a fast spin-echo pulse sequence such as HASTE (half-Fourier acquisition single-shot turbo spin-echo) [7]. Since a large fraction of the parenchyma signal is from capillary blood, HASTE imaging can be used in combination with arterial spin labeling techniques to generate regional sensitivity to pulmonary perfusion [8, 9], which is of particular interest for functional lung imaging. A fast spin-echo image acquisition can also be preceded by an inversion-recovery preparation to generate sensitivity to T1-shortening agents such as inhaled oxygen, which enables MRI measurement of ventilation [10, 11].
At the above-mentioned workshop in Philadelphia, groups from the Pulmonary Imaging Laboratory at the University of California, San Diego (UCSD) and the Center for In-Vivo Hyperpolarized Gas MRI at the University of Virginia (UVA) shared their latest innovations in the area of proton lung MRI, including temporal imaging of lung function, imaging measurements of ventilation-perfusion ratio, and high-quality 3D structural imaging. In the pages that follow we summarize these new developments, each of which utilizes a different combination of the specialized MR techniques discussed above to access interesting and meaningful information about lung physiology and health. We start by introducing functional imaging techniques that permit regional quantification of pulmonary blood flow and ventilation and go on to describe how these techniques can be adapted to investigate spatiotemporal dynamics of lung function. Next we discuss how imaging measures of pulmonary ventilation and perfusion can be combined to quantify regional ventilation-perfusion ratios. Finally, promising new proton MRI techniques for high-resolution pulmonary imaging are presented.
Temporal Dynamics in the Lung
The primary function of the lung is to enable gas exchange between inspired air and the bloodstream. This process is most efficient when local alveolar ventilation (V˙A), which represents the delivery of fresh gas to the gas-exchanging portion of the lung, is well matched to local perfusion (Q˙), which represents the delivery of arterial blood to the capillary beds lining the alveolar walls. Both V(˙)A and Q(˙) are quantitative functional parameters and refer to the volume of air and blood, respectively, delivered per unit time. Today it is well recognized that both ventilation and perfusion vary regionally throughout the lung [12]. In the normal lung these variations are primarily the result of gravitational distortion [13, 14] and vascular/airway branching structure [15], and in the diseased lung there is an additional contribution from spatially heterogeneous patterns of disease.
However, what is often not acknowledged is that both ventilation and perfusion are under active control and may vary, not only spatially, but also temporally as a result of these control mechanisms. Further, these mechanisms are interrelated so that a reduction in ventilation (for example as the result of bronchoconstriction) to a region of the lung can lead to a reduction in pulmonary blood flow due to the activation of hypoxic pulmonary vasoconstriction [16], with the net effect being to (partially) normalize the regional ventilation to perfusion ratio, optimizing gas exchange [12].
Thus, while we acknowledge the presence and potential usefulness of these active control mechanisms, scant attention has been paid to the spatial-temporal variability of either pulmonary blood flow or ventilation that must result from their actions. This is largely a result of a lack of adequate tools with which to study spatial-temporal variations. Such studies inevitably require repeated measurements, and techniques that give spatial information are often limited in the number of repetitions that can be performed either due to intrinsic constraints such as a limited number of identifiable markers in microsphere studies, or due to dose limitations from contrast agents or ionizing radiation. Non-contrast proton MRI provides a means by which temporal variability in the lung can be addressed with a useful level of spatial resolution without these constraints, making it applicable for repeated studies in humans.
Temporal Imaging of Pulmonary Blood Flow
Arterial spin labeling (ASL) is an MRI technique originally developed for quantifying perfusion in the brain, which uses MR-tagged blood as an endogenous contrast agent for generating sensitivity to blood flow [17]. In the lung, a variant of this technique termed ASL-FAIRER (flow-sensitive alternating inversion recovery with an extra radiofrequency pulse) can be used to quantify regional pulmonary perfusion [18, 19]. The Pulmonary Imaging Laboratory at UCSD has made extensive use of this technique to study the spatial heterogeneity of blood flow in the human lung, examining various topics such as the gravitational distribution of pulmonary blood flow [20], the effect of prone positioning [21], abnormal pulmonary circulation in subjects susceptible to high altitude pulmonary edema [22], the effect of normal ageing on pulmonary blood flow heterogeneity [23] and other topics [24–26].
In ASL-FAIRER, two cardiac-gated images of a slice of the lung are acquired five or more seconds apart, each during diastole, using a HASTE pulse sequence. In one case the HASTE acquisition is preceded by a slice-selective inversion/saturation RF preparation overlaid on the imaged slice, the effect of which is to minimize the available MR signal in the imaged slice. The time between this “tagging” preparation and the image acquisition is set to encompass one systolic ejection period (typically ∼80% of the subject's R-R interval, individually set for each subject), and during that time blood from outside the imaged slice (which did not see the tag and so retains its full MR signal) flows in, yielding a blood-bright image. For the second image the process is repeated except that this time the tagging preparation is spatially non-selective, so that blood flowing into the imaged slice has also been subject to the signal minimization, yielding a blood-dark image. Subtraction of the blood-dark image from the blood-bright image eliminates signal from any static elements in both images, leaving an image of blood delivered to the slice in one systolic ejection period. This process is illustrated in Figure 1.
Figure 1.
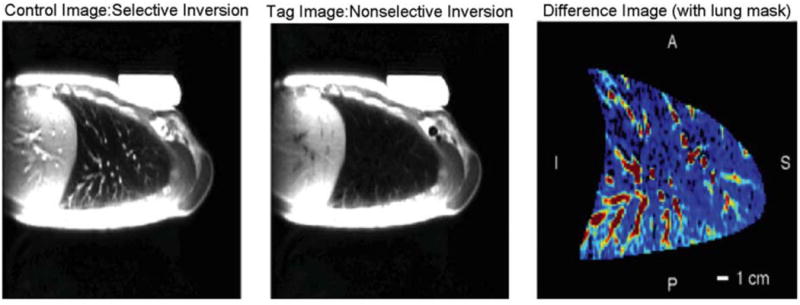
ASL-FAIRER in the healthy supine lung. A blood-bright (control) image and a blood-dark (tag) image are acquired approximately 5 seconds apart. Subtraction yields an image of pulmonary blood delivered to the slice during the delay time between the magnetic tag and the image acquisition, encompassing one systolic ejection period. These are images of a 15 mm sagittal slice through the middle of the right lung. The HASTE pulse sequence collects 72 phase-encoding lines of a 128×256 matrix with ∼3.0×1.5 mm in-plane resolution, using an inter-echo time of 4.5 ms. Reproduced with permission from [26].
The ASL imaging procedure described above utilizes a pair of images collected about 5 seconds apart during a single ∼8 second breath hold at a relaxed lung volume (functional residual capacity, or FRC) to measure the spatial distribution of blood flow at a single point in time. The most straightforward implementation of temporal ASL is simply to repeat the acquisition of image pairs at regular intervals. To make this procedure comfortable for the subject, we can acquire each image in a separate, much shorter breath hold (a brief suspension of respiratory effort at FRC lasting 1-2 seconds), alternating between blood-bright and blood-dark acquisitions. The five-second interval between images is chosen to allow adequate T1 recovery between acquisitions. Fortuitously, this time interval is close to the natural resting breathing frequency, but can be increased for subject comfort. Thus temporal ASL can be implemented by taking a series of alternating blood-bright and blood-dark images at a fixed repetition interval of five seconds. During this sequence the subject relaxes to FRC, briefly pauses breathing while the image is taken, and then inspires and relaxes back to FRC in time for the next image. Although this sounds complicated, the loud reproducible noises made by the scanner provide an excellent audible cue for the subject, and with only minimal training, temporal scans of up to 30 minutes are readily practical in cooperative subjects. The result is a time series of ASL measurements spaced at 10 second intervals spanning many minutes.
As temporal ASL in the lung is a new technique, only limited studies have been performed to date. The lone published study examines the effects of altered inspired O2 levels on the spatial-temporal heterogeneity of pulmonary blood flow [27]. The rationale behind this study lies in the knowledge that alveolar hypoxia results in vasoconstriction of the blood vessels flowing into the hypoxic region of the lung [12, 16]. Therefore the activation (or deactivation with hyperoxia) of any pulmonary vascular tone in the lung might reasonably be expected to alter the pulmonary blood flow distribution, and yet in normal subjects no such effect is seen when looking at the spatial heterogeneity of pulmonary blood flow [25].
To investigate this issue further, we examined the spatial-temporal heterogeneity of pulmonary blood flow in normal subjects exposed to both hypoxia (12.5% inspired O2, equivalent to an altitude of 12,500 ft or 3,800 m) and hyperoxia (100% inspired O2). This particular hypoxic stimulus has been used by us previously, and is expected to strongly engage the hypoxic pulmonary vasoconstrictive response [22, 25]. Conversely, the hyperoxic stimulus is expected to completely release any hypoxic vasoconstriction. To manipulate the inhaled oxygen concentration, the subject wore a facemask (7400 series Oro-Nasal Mask, Hans Rudolph, Shawnee, KS) equipped with a non-rebreathing T valve (Hans Rudolph) that allowed the inspired gas mixture to be switched among 12.5% oxygen, 100% oxygen, and 21% oxygen (air). All human studies were approved by the UCSD Human Research Protection Program, and all subjects provided written informed consent.
All images were collected with a General Electric 1.5 Tesla Excite MRI system using an eight-channel torso coil. Imaging parameters were the same as in Figure 1, except slice thickness was 10 mm. Images were taken in a single sagittal slice in the right lung to minimize effects from cardiac motion. The experimental procedure was a block design in which subjects inhaled room air for 80 breaths, were suddenly switched to a challenge gas (hypoxic, normoxic as a control, or hyperoxic) for 80 breaths, and then back to air. MR imaging was performed during a brief breath hold following each exhalation, alternating between blood-bright and blood-dark acquisitions as described above, yielding one ASL image every ten seconds.
In order to assess the spatial-temporal heterogeneity revealed by our imaging data, it was necessary to move beyond relative dispersion (RD, defined as the standard deviation divided by the mean, sometimes referred to as the coefficient of variation), which is a useful metric for assessing spatial heterogeneity within a single image. To do so we developed the fluctuation dispersion (FD) metric, which focuses on comparing multiple identically acquired images to a reference condition and examining the fluctuations that result. The technique is fully described in [27] and only outlined here. Briefly, a “stack” of ASL difference images (blood-bright minus blood-dark) are evaluated by first normalizing the mean of each to 1.0, to eliminate any artifacts from changes in cardiac stroke volume, changes in T1 or T2, or scanner drift. A subset of these normalized images is chosen, and the pixel-by-pixel average of this subset is used as the reference image. Each of the remaining images is then subtracted from the reference, and the standard deviation of the differences is taken as the fluctuation dispersion. Depending on what reference subset was chosen, the calculated value of FD reflects either a combination of the temporal variability in the images and any change in the underlying static distribution of blood flow (when the reference period is during the initial baseline condition, termed FDGlobal) or just the temporal variability in the images (when the reference period is from within a particular physiological condition, termed FDLocal) [27].
As shown in Figure 2, significant changes were observed in FDLocal only when the lung was exposed to hypoxia (indicating a change in the temporal variability of pulmonary blood flow), whereas both hypoxia and hyperoxia resulted in changes in FDGlobal (indicating a change in the underlying pattern of blood flow distribution). These results suggest that there is a degree of pulmonary vascular tone under normoxic conditions that is altered by both hypoxia and hyperoxia. This study also illustrates that in order to fully examine the factors that control pulmonary blood flow, it is necessary to look at the temporal domain in addition to considering spatial heterogeneity.
Figure 2.
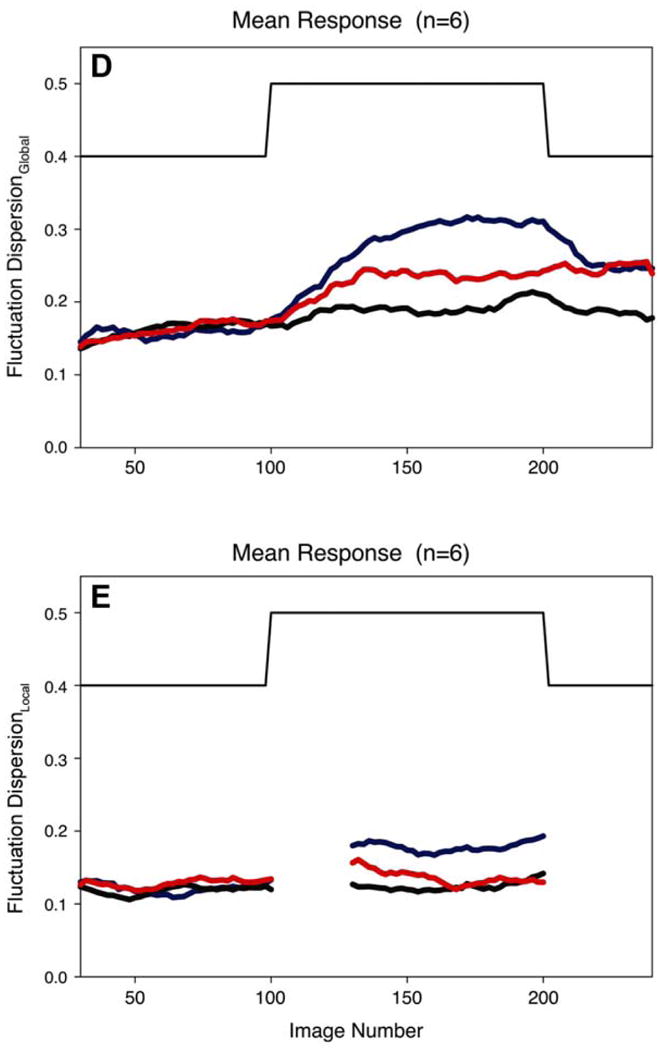
The time course of Fluctuation Dispersion (see text for details), both FDGlobal (panel D) and FDLocal (panel E), as subjects were switched from breathing air to one of three different gas mixtures: hypoxic (blue), normoxic (black), and hyperoxic (red). Note that both hypoxia and hyperoxia resulted in changes in fluctuation dispersion, indicating alterations in pulmonary vascular tone from both atypical gas mixtures compared to breathing air. Reproduced with permission from [27].
Temporal Imaging of Pulmonary Ventilation
Assessing temporal changes in ventilation using MRI is more challenging than assessing those in perfusion. Ventilation is a dynamic process that equilibrates on a relatively slow time scale. Unlike blood flowing in one direction through a vessel, not all of the air in a functional lung unit is exchanged with each breathing cycle. To measure this exchange rate, one must introduce a contrast agent into the inspired gas mixture and observe its buildup in the lung over time.
Using inhaled hyperpolarized gas as the contrast agent allows its buildup in the lung to be imaged directly, with good spatial resolution and SNR [28, 29]. However, relating the measured signal evolution to quantitative ventilation can be difficult, because the hyperpolarized magnetization is continually decaying throughout the measurement procedure due to effects other than ventilation. More importantly, the repeated image acquisitions necessary to obtain a single quantitative measurement, which ultimately represents a time-averaged mean ventilation during the measurement interval, are already quite resource intensive, and the ability to repeat this procedure multiple times in order to observe temporal variations is limited by gas availability and cost.
Oxygen-enhanced pulmonary MRI is a proton-based technique that uses inhaled 100% O2 as an exogenous contrast agent to generate sensitivity to ventilation [10, 30–34]. The basic principle behind this method is that the presence of oxygen in the lung airspaces shortens the T1 of the surrounding tissue. This allows oxygen buildup in the air spaces to be detected indirectly, by measuring its effect on the MR signal in the parenchyma. The group at UCSD has developed a procedure that takes the basic O2-enhanced imaging method and places it on a quantitative basis, by using it to monitor a multiple breath wash-in of O2 [11].
Under this procedure, the subject wears a facemask as described previously and breathes in a block pattern consisting of 20 breaths of room air alternating with 20 breaths of 100% O2. Following each exhalation, a T1-weighted image is acquired of a single 15-mm slice using a global-inversion-recovery HASTE pulse sequence. Typical imaging parameters are the same as those used for the ASL acquisitions, but with inversion recovery time TI = 1100 ms which optimizes contrast between air and oxygen breaths [30]. As in the ASL measurement procedure, subjects are trained to synchronize their breathing with the scanner and suspend ventilation at FRC during the ∼1-2 second period when image acquisition occurs.
Following each air-to-oxygen transition, the MR signal in ventilated lung regions rises to a new plateau level as the alveolar gas equilibrates with the new inhaled level of O2. The rate at which O2 is washed into (or out of) a lung region is proportional to the regional specific ventilation, defined as the ratio of inspired fresh gas volume (thus excluding dead-space reinspiration) to resting lung volume. Therefore regions of high specific ventilation show rapid changes in MR signal intensity whereas regions of low specific ventilation change more slowly. Since it is the time constant of this signal change that depends on specific ventilation (and not the absolute signal nor the absolute signal change, whose values depend on the regional ventilation-perfusion ratio), it is not necessary to measure absolute T1 values, and the regional specific ventilation can be quantified from a series of T1-weighted images obtained during the air/oxygen transitions. The entire procedure takes ∼18 minutes as the switch between breathing air and breathing O2 is repeated several times to ensure good statistics in the face of weak SNR in the lung parenchyma. Our technique implicitly assumes that regional specific ventilation remains constant during data acquisition; quantification converges to the average value when this assumption is not met.
Recently, we showed that by applying a sliding-window evaluation over the entire 18 minute data set and accepting a slight degradation of quantitative accuracy, we could use our specific-ventilation imaging (SVI) procedure to follow the recovery of ventilation in a previously bronchoconstricted subject (Figure 3). In this figure, the left-most specific-ventilation image shows the lack of bronchoconstriction before methacholine challenge, and the subsequent three windows show ∼7 minute averages computed every ∼5 minutes. As time progresses there is a recovery of the initial ventilation defects, especially in the dependent caudal lung region.
Figure 3.
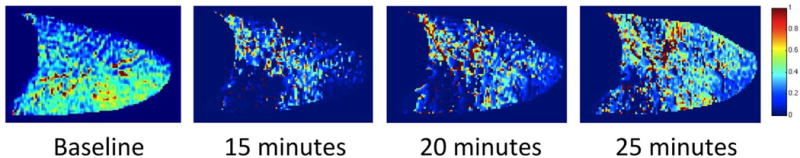
The time course of recovery following methacholine challenge. The leftmost panel shows the map of specific ventilation obtained before challenge with a uniform pattern of ventilation. The remaining panels show SV maps obtained at the indicated times after challenge. The development of ventilation defects due to bronchoconstriction (especially in the dependent caudal lung) and subsequent recovery of ventilation to these regions can be clearly seen from left to right in the figure.
Although the required multiple-breath approach to SVI limits the temporal resolution to the order of a few minutes (compared to a few seconds in the case of perfusion imaging), it nevertheless offers the promise of physiologically and clinically relevant spatial-temporal information. Further, both time-dependent ventilation and perfusion imaging open the door to investigations that were previously inaccessible without proton-MRI.
Ventilation-Perfusion Matching
Although ventilation and perfusion are important functional parameters in their own right, it is the local ventilation-perfusion (V˙)A/Q˙) ratio that primarily determines the efficiency of gas exchange in the lung. Indeed, V˙A/Q˙ mismatch is the most important cause of hypoxemia in lung disease. Disruption of V˙A/Q˙ matching is a hallmark of chronic obstructive pulmonary disease [35], and patients with pulmonary hypertension [36], asthma [37], pulmonary fibrosis [38] and acute respiratory distress syndrome [39] also experience severe V˙A/Q˙ mismatch resulting in impaired lung function.
Much of what we know about the disruption of V˙A/Q˙. matching in the lung is derived from studies using the multiple inert has elimination technique (MIGET), developed by Wagner and West in the 1970s [40, 41]. In MIGET, trace amounts of inert marker gases are dissolved in saline and infused intravenously. The concentration of these gases is subsequently measured in expired air and in arterial and mixed venous blood, and these measurements are used to calculate the distribution of V˙A/Q˙ ratios across multiple gas-exchange units.
The primary advantage of MIGET is that it is fully quantitative, allowing the distributions of ventilation and perfusion to be expressed as functions of V˙A/Q˙ ratio. However, MIGET suffers from three important limitations that have prevented its broad implementation clinically. First, the technique is highly invasive, requiring at least two and often three catheters to be placed in the subject. Second, it is technically difficult to obtain high quality data, to the extent that less than a dozen centers worldwide are proficient in the technique. Third and perhaps most importantly, despite the inherently regional nature of V˙A/Q˙ mismatch, MIGET provides no spatial information, but rather gives a global distribution and index of overall mismatch as identified by the standard deviation of the ventilation and perfusion distributions.
An ideal technique to quantify V˙A/Q˙ relationships would be noninvasive, able to be implemented in most clinical settings, and offer high-resolution spatial information. In addition, lack of exposure to ionizing radiation would be desirable. Proton MRI is therefore appealing, particularly for techniques that can be implemented on 1.5T clinical scanners without hardware modification. It should be noted that 1.5T scanners are often preferred for lung imaging because susceptibility differences at the numerous air-fluid interfaces within the lung, which are the primary cause of short T2* in the parenchyma, are worse at higher field strength. It remains to be seen whether the techniques described here could be applied as successfully at 3T.
Quantitative Imaging of the Ventilation-Perfusion Ratio
To develop a procedure for assessing V˙A/Q˙. with proton MRI, we start with the ASL and O2-enhanced imaging techniques described above for measuring pulmonary perfusion and specific ventilation, respectively. To make the procedure fully quantitative, however, requires several auxiliary measurements to be incorporated.
First, since a close-fitting surface coil is used to acquire the MR images, a regionally varying normalization factor must be applied to the ASL measurements to compensate for the spatially uneven coil sensitivity. This correction map is calculated on a subject-by-subject basis by acquiring low resolution gradient-echo images of the target slice using both the torso coil and the scanner body coil, which is assumed to have spatially uniform sensitivity over the imaged slice [42]. Such a correction is not required for the SVI measurements because the specific ventilation is calculated from the rate of signal change, not the absolute signal change.
Second, the signal difference between the blood-bright and blood-dark ASL images must be converted to delivered blood volume, to obtain a quantitative measure of pulmonary blood flow. This is accomplished by placing a silicone phantom with known T1, T2, and proton density next to the subject within the imaging field of view. The mean signal magnitude from image voxels fully contained in this phantom is then used to calibrate the proton density and thus the blood volume represented by the ASL difference images, based on reported values of water density and relaxation parameters for human blood [43].
Although this auxiliary measurement allows the local blood volume represented by the ASL difference images to be quantified, one must be careful in interpreting the resulting blood volume as a representation of flow. Such an interpretation is based on the assumption that one systolic ejection of tagged blood is delivered to the imaged slice during the interval between the application of the tag and the image acquisition, and is imaged before it has time to leave. Whereas this is likely true in the small vessels which represent perfusion, it is not the case in larger blood vessels. This is because some of these larger, conduit vessels are fully saturated with signal and thus are not sensitive to flow. In addition, some of the conduit vessels carry tagged blood that is destined for distant capillary beds and thus contain signal that does not represent perfusion to the slice of interest. Consequently a threshold based on modeling studies [44] is applied to exclude voxels contained in larger conduit vessels from the analysis, with the result that the remaining flow largely represents capillary perfusion. Since the conduit vessels do not participate in gas exchange, eliminating these voxels does not compromise the V˙A/Q˙. ratio measurement. However, it should be recognized that blood flow may be overestimated in voxels that contain both capillaries and conduit vessels but fall below the threshold for exclusion.
Finally, it is alveolar ventilation, not specific ventilation, which is relevant to determining V˙A/Q˙ matching. Regional alveolar ventilation V˙A is the delivery rate of fresh gas to a region of lung by inspiration, whereas regional specific ventilation is the ratio of the inspired volume of fresh gas delivered to the region with each breath divided by the volume of gas already resident in the volume (in this case the gas volume of the region at FRC). Thus to convert specific ventilation to alveolar ventilation, we must know the volume of the gas resident in the region at FRC. A measurement of lung density at FRC provides this missing piece, by making the assumption that a proton density image of the lung has only two components: a water fraction and gas fraction. Under this assumption, the resident gas component of each voxel can be calculated as 1 minus lung density.
Using a technique described in detail elsewhere [1], it is possible to quantify regional proton density in up to three slices of the lung during a nine-second breath hold, by using a fast gradient-echo pulse sequence to measure the parenchyma signal at two short echo times (1.0 ms and 1.8 ms), and extrapolating the signal measurements back to time zero on a pixel-by-pixel basis. The zero-time signal magnitudes are then calibrated to proton density based on the signal measured in the silicone phantom. The images used for this procedure are collected with the body coil, to minimize effects of coil nonuniformity. This approach explicitly assumes that the proton density measurement captures all of the non-air components in a voxel. This is not strictly true, as lung tissue contains a small fraction of material that is not water-containing and therefore does not show up in the magnetic resonance signal [45]. The net result of neglecting this component is that the volume of resident gas is overestimated by ∼3-5%, a level which is biologically insignificant.
Practical Implementation
To summarize, we can measure regional V˙A/Q˙ ratio using proton MRI by combining three imaging techniques [46]: (1) ASL-FAIRER to measure regional perfusion, (2) oxygen-enhanced MRI to measure regional specific ventilation, and (3) fast gradient-echo with multiple short echo times to measure regional lung density. From the specific ventilation and lung density images, alveolar ventilation is calculated on a voxel-by-voxel basis as the product of specific ventilation, the volume fraction of air (equal to 1 minus lung density), and the frequency of breathing. Finally, regional V˙A/Q˙ is computed as the voxel-by-voxel ratio of the alveolar ventilation and quantitative perfusion maps.
To implement this in practice, subjects are positioned in the MRI scanner (1.5 Tesla Signa HDx TwinSpeed, General Electric Medical Systems, Milwaukee, WI) in the desired posture and a silicone phantom is placed next to the subject for quantification of perfusion and lung density images as described above. Subjects wear a facemask equipped with a non-rebreathing valve as described previously, which allows the inspired gas to be switched between oxygen and air. The expiration side of the non-rebreathing valve is connected via MRI compatible respiratory tubing to a metabolic cart in the console room (Parvomedics, Truemax 2400, Sandy, UT) and expired respiratory frequency and tidal volume are measured.
MRI measurements of pulmonary blood flow and specific ventilation are merged into a single 18-minute ASL-SVI pulse sequence, to minimize any change in physiological conditions between the two measurements. Lung density images are acquired before and after the combined ASL-SVI acquisition, using both the body coil and the torso coil. During the combined ASL-SVI pulse sequence, subjects breathe in a block pattern alternating between 20 breaths of room air and 20 breaths of 100% oxygen. Eighteen of these breaths are used to acquire inversion recovery HASTE images as described previously, for use in calculating specific ventilation. The other two breaths (numbers 17 and 18) are used to acquire “tag” and “control” ASL images. Only the ASL images acquired during the air blocks are used to calculate the perfusion side of the V˙A/Q˙ ratio, to exclude any potential impact of breathing 100% oxygen on the quantification of perfusion.
Example images of lung density, alveolar ventilation, quantitative perfusion, and V˙A/Q˙ ratio, obtained from a healthy subject in the supine posture, are shown in Figure 4. Before calculating these composite images, the raw images of specific ventilation, proton density, and perfusion are registered and smoothed, convolving them with a 2D Gaussian full width at half maximum of 7 voxels and a standard deviation of 3 voxels. A lung mask that excludes large conduit vessels and voxels outside the lung, treating them as missing data, is applied to the raw images before smoothing. The net result is a map of local V˙A/Q˙ ratio with an effective spatial resolution of ∼1 cubic centimeter.
Figure 4.
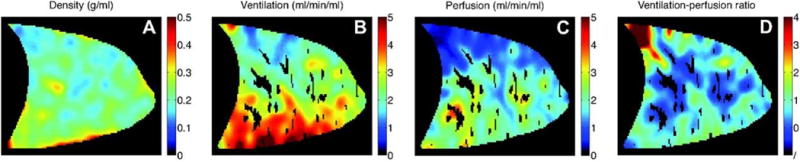
Example images of (A) lung density, (B) alveolar ventilation, (C) perfusion, and (D) V˙A/Q˙ ratio in a sagittal slice of the right lung in a healthy subject positioned in the supine posture. Voxels with larger conduit blood vessels are excluded from the calculation of regional perfusion and V˙A/Q˙ ratio since they do not represent perfusion and incorrectly map as regions of shunt. Reproduced with permission from [46].
This technique was used to perform a comparison of gravitationally dependent V˙A/Q˙ distributions in supine versus prone postures [46]. The effects of gravity on the lung are manifested as vertical gradients in intrapleural pressure (affecting alveolar size and therefore V˙A) and hydrostatic pressure (affecting Q˙), which in turn lead to vertical gradients in both ventilation and blood flow. Although these gradients have different magnitudes, they point in the same direction and thus act to facilitate V˙A/Q˙ matching despite the underlying variations in V˙A and Q˙. In moving from supine to prone posture, the gravitational effects are largely reversed. However, modeling studies suggest that due to the shape of the lungs within the thorax there is an interplay between lung shape and gravity, such that the gradient of intrapleural pressure is smaller in prone posture compared to supine [47]. Our experimental findings were consistent with this theoretical result and further showed that the gravitationally oriented gradients of ventilation, perfusion, and V˙A/Q˙ ratio were all smaller in prone compared to supine posture, resulting in a more uniform vertical distribution of V˙A/Q˙ ratios (Figure 5) [46]. In addition, the regions of high V˙A/Q˙ ratio often present in nondependent lung regions in the supine posture were reduced in prone posture. These results are similar to measurements in animals [48, 49] and may have implications for improving gas exchange in mechanically ventilated patients.
Figure 5.
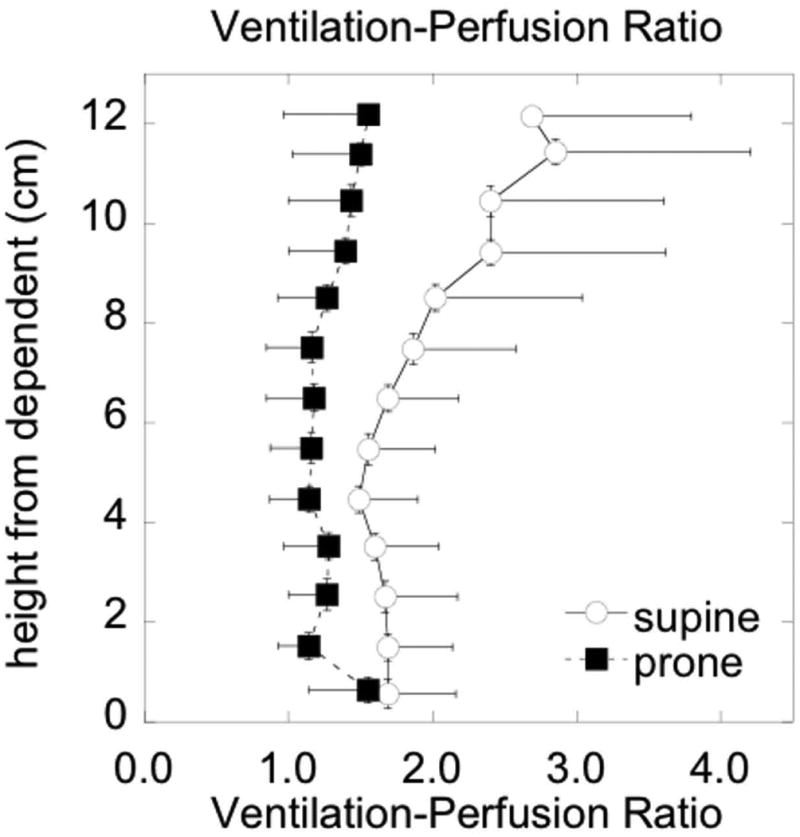
Effect of prone versus supine positioning on the gravitational gradient of the ventilation-perfusion ratio in healthy subjects. In prone posture the vertical distribution of regional V˙A/Q˙ ratios is more uniform. Reproduced with permission from [46].
Three-Dimensional Structural Imaging
Computed tomography (CT) is currently the clinical modality of choice for structural lung imaging, due to its unmatched spatial resolution and sensitivity to a wide range of tissue densities. However, CT also suffers from some drawbacks relative to MRI, including radiation exposure and generally inferior soft-tissue contrast. Although clinical MRI cannot approach the spatial resolution possible with CT, recent developments allow three-dimensional spatial resolution on the order of a cubic millimeter to be achieved in the lung [5]. Furthermore, the lack of ionizing radiation makes proton MRI an attractive option for longitudinal studies, particularly in children, and the ability to better differentiate tissue types enhances its potential usefulness in subjects with lung disease.
Pulse Sequence Design
A pulse-sequence strategy for 3D structural imaging must deal effectively with all three major challenges associated with proton MRI in the lung, namely short T2*, low proton density, and respiratory motion. The lung imaging group at UVA is exploring a multi-pronged approach, which combines an ultrashort echo-time (UTE) k-space acquisition, a balanced SSFP excitation scheme, and an imaging-based respiratory navigator, to enable whole-lung coverage with isotropic spatial resolution in a clinically reasonable scan time.
Ultrashort echo-time MRI is a pulse-sequence technique that can be used to capture the short-lived parenchyma signal during the initial free induction decay following an excitation RF pulse rather than using spin echoes to refocus the signal at a later echo time as is done in a single-shot fast spin-echo (e.g. HASTE) pulse sequence. This is accomplished by opening the data acquisition window as soon as possible after the excitation RF pulse, while simultaneously applying a magnetic field gradient to collect a radial line of k space data, as illustrated in Figure 6a. This process is then repeated, with the gradient oriented in different directions, to sample the interior of a circle (2D) or sphere (3D) in k space. Such an acquisition naturally lends itself to 3D imaging, since a spatially nonselective (and thus extremely brief) excitation RF pulse can be used, permitting echo times below 100 μs to be easily achieved [50].
Figure 6.
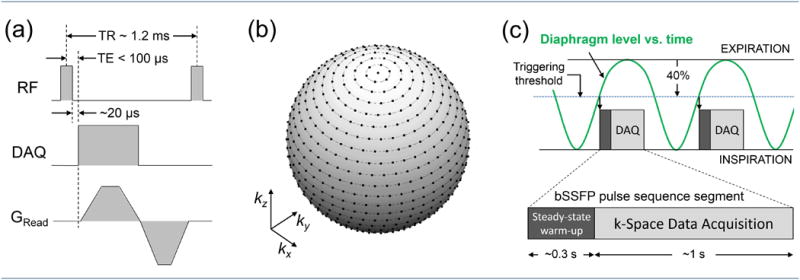
(a) Balanced SSFP pulse sequence combined with a 3D radial UTE acquisition. The readout gradient direction varies for each excitation to evenly sample the interior of a sphere in k space. To avoid nerve stimulation, the gradient slew rates are usually smaller than the hardware limit, and a slightly longer ramp time is often used for the first (readout) lobe. Standard 0°/180° phase alternation is applied to the excitation RF pulses. (b) A sphere in k space, showing a fully sampled spoke-radial k-space trajectory corresponding to a 25×25×25 Cartesian matrix. The dots on the surface of the sphere indicate the endpoints of the radial spokes. The equivalent Cartesian matrix for an actual, high-resolution lung scan is much larger than the one used for this example, resulting in much denser sampling than shown here. (c) Respiratory triggering of the segmented acquisition. The triggering threshold is set in advance by the operator, and is expressed as a percentage of the normal diaphragm excursion between inspiration and expiration. A 40% threshold setting is depicted here.
The UTE acquisition is usually incorporated into a spoiled RF excitation scheme, identical to a spoiled gradient-echo pulse sequence, although a spoke radial UTE acquisition is technically not considered a gradient-echo pulse sequence since no echo is formed by the readout gradient [3]. It was recently demonstrated that by using a respiratory bellows signal to synchronize image acquisition with the subject's breathing cycle, this type of pulse sequence can be used to generate whole-lung 3D images with unprecedented spatial resolution and SNR, revealing structural features such as airway walls, lobar fissures, and patterns of pulmonary fibrosis with a level of detail not typically seen in 2D spin-echo acquisitions at longer echo times [5].
Another pulse-sequence strategy that has attracted recent interest for structural imaging of human lungs is balanced steady-state free precession (SSFP) [6, 51, 52]. An optimized balanced SSFP acquisition yields higher steady-state MR signal than an equivalent spoiled gradient-echo acquisition, especially for extremely short repetition times [53]. The downside of an SSFP pulse sequence is that off-resonance spin precession can drive the steady-state magnetization to zero, causing bands of reduced signal in regions of significant magnetic field variation, as are often found at the base of the lung. Fortunately, this effect can be suppressed simply by reducing TR. It was recently shown that by using ultrafast repetition times approaching 1 ms, which is shorter than the typical T2* value of lung parenchyma at 1.5 Tesla, a single-breath-hold, balanced SSFP acquisition with 3D Cartesian k-space encoding can be used to generate proton lung images that show enhanced parenchyma signal without off-resonance banding artifacts [6].
The group at UVA has developed a pulse sequence for imaging the lung that combines the UTE and balanced SSFP techniques. The basic pulse sequence is shown in Figure 6a. A brief (typically 80-120 μs, depending on flip angle) rectangular RF pulse is used to excite the magnetization, and data acquisition begins as soon as possible (typically 20 μs) after the end of the excitation RF pulse. The readout gradient begins 10 μs later, to allow a brief settling time before acquiring k-space data. In order to minimize TR, the readout gradients are executed as quickly as possible. A slew rate somewhat less than the hardware limit must often be used for one or both of the gradient lobes, however, to avoid violating calculated peripheral nerve stimulation limits. The total moment of the readout lobe is chosen to reach the desired spatial resolution in k space, and data is sampled during both ramp up and ramp down. Since the gradient moment must be rewound to meet the balanced-SSFP condition, this strategy minimizes the size of the rewinding lobe, which further reduces the necessary TR.
The resulting k-space trajectory consists of radial spokes, each of which begins at the center of k space and ends on the surface of a sphere whose radius corresponds to the desired spatial resolution. To achieve an isotropic field of view, the angle of each spoke (and thus the direction of each readout gradient) must be varied so that the endpoints evenly cover the surface of this sphere. In our implementation, this is achieved by arranging the endpoints such that each lies on a circle concentric with the kz axis, as shown in Figure 6b. These circles are spaced so that the distance between them along the surface is constant and is approximately equal to the minimum separation necessary to meet the Nyquist criterion for the desired field of view. The endpoints are also evenly spaced around each circle, and the number lying on each circle is chosen such that their spacing along the circle is as close as possible to the spacing between the circles. This is somewhat different from other methods used to evenly sample the surface of a sphere in k space [54], but is similarly efficient. The acquisition of the corresponding spokes is ordered sequentially, such that the spoke that ends at the top point of the sphere is acquired first, then all spokes that end on the top-most circle are collected next, and so on.
Achieving whole lung coverage with fine spatial resolution using this type of acquisition requires a total scan time much longer than a breath hold. For instance, to meet the Nyquist criterion for sampling a 200×200×200 Cartesian-equivalent matrix, which yields 2 mm isotropic resolution for a 400 mm field of view, more than a hundred thousand uniformly distributed radial spokes are required. Therefore the necessary scan time is on the order of minutes, even for repetition times as short as 1 ms. To allow the scan to be performed while the subject is breathing comfortably, while avoiding image artifacts due to respiratory motion, we use an image-based navigator system (details of which are given in the next section) to trigger data acquisition at a specified point in the breathing cycle.
On the pulse sequence side, triggering is accommodated by dividing the full k-space acquisition into brief segments of equal length. The number of excitations in each segment is specified in advance by the operator, and is set so that the length of each segment is ∼25-40% of the subject's natural breathing period. Whenever the pulse sequence receives a trigger from the navigator system, it executes one segment of the acquisition, resuming the sequentially ordered k-space trajectory where the previous segment left off. In order to minimize effects due to non-continuous data acquisition, the first hundred or more excitations of each new segment are executed using the gradient orientation corresponding to the last k-space line of the previous segment, without acquiring new data (Figure 6c). This procedure ensures that the SSFP pulse sequence is in (or nearly in) steady state whenever imaging data is acquired.
Respiratory Triggering
To synchronize our 3D image acquisition with the respiratory cycle, we make use of the imaging navigator system built into our scanner's control platform. We outline the basic navigator strategy here. A more in-depth description of this system, which is referred to as prospective acquisition correction or PACE by the manufacturer, is provided in reference [55]. Under this system, the craniocaudal position of the diaphragm (that is, its position along the head-foot direction) is monitored by repeatedly acquiring low-resolution 2D images of a coronal slice through the middle of the lung while the subject breathes normally. Whenever the diaphragm position crosses an operator-specified threshold, the navigator system triggers acquisition of one segment of the main pulse sequence.
To initiate this procedure, a set of multi-plane scout images is first obtained to determine where to position the navigator slice. A sagittal slice from such a planning set is shown in Figure 7a. The operator positions the navigator window (superimposed rectangle) over the highest point of the dome of the diaphragm under the right lung. In the image shown here, the horizontal location of the window specifies the anterior-posterior slice position of the navigator images, and the vertical extent of the window specifies the craniocaudal region within each navigator image that should be examined to find the lung-diaphragm interface.
Figure 7.
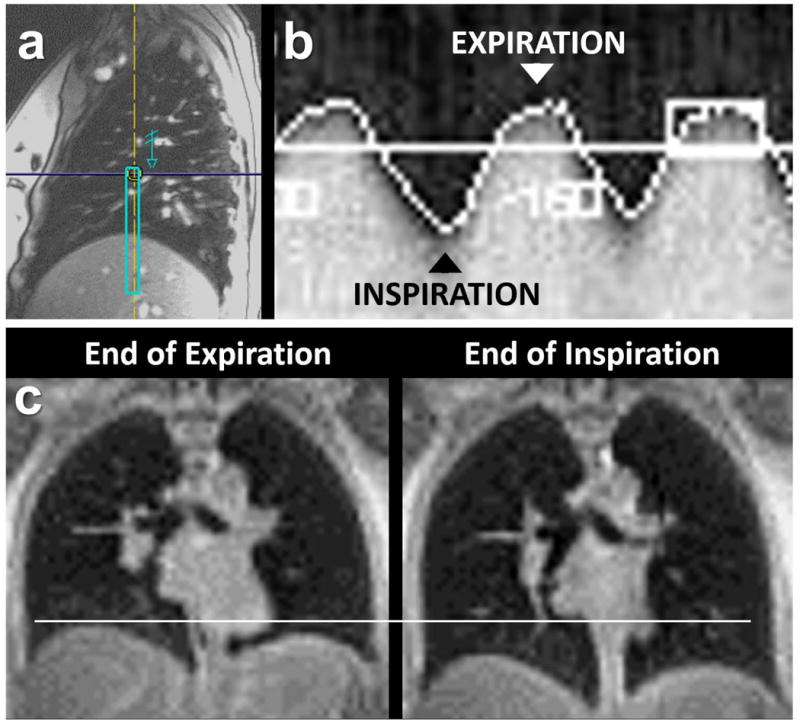
Elements of the respiratory triggering procedure. (a) Sagittal planning image through the middle of the right lung, showing the position of the navigator window (superimposed rectangle). (b) Navigator trace showing the craniocaudal position of the diaphragm as a function of time during free breathing. (c) Example coronal images from two separate, low-resolution 3D scans, each triggered at a different part of the respiratory cycle.
A portion of the resulting navigator trace is shown in Figure 7b. Each vertical column of this composite image is constructed from a single navigator image acquisition, and essentially shows the MR signal profile along the head-foot direction within the navigator window. The corresponding position of the diaphragm, as determined by the analysis software, is superimposed as a bright white pixel. The prospective triggering threshold can be set at any level on the upslope of this trace, and is specified by the operator as a percentage of the full normal range, as depicted in Figure 6c. To demonstrate the flexibility of this procedure, Figure 7c shows coronal slices from two separate, low-resolution 3D scans of the same subject, triggered at end-expiration and end-inspiration, respectively.
Upon starting a respiratory triggered scan, the pulse sequence is initially under the control of the navigator system, which repeatedly acquires navigator images every 150 ms at the specified slice location. During this initial learning phase, which takes less than one minute, the software determines the normal range of diaphragm positions for the freely breathing subject. Once the learning phase is complete, the software calculates the desired triggering level based on the relative percentage specified by the operator. Whenever the diaphragm position crosses this level, the navigator system cedes control to the main pulse sequence, which executes a segment of the 3D k-space acquisition, as described above and illustrated in Figure 6c. After this segment has been acquired, the sequence returns control to the navigator system, which resumes acquisition of navigator images until the next time the diaphragm position crosses the triggering level. Because the navigator images are acquired with a very low flip angle (∼3°) [55], the longitudinal magnetization in the navigator slice is never fully depleted. Thus the spins located within this slice rapidly approach the same steady state as spins located outside this slice once the main SSFP imaging segment begins, and no residual effects of the 2D navigator acquisition are evident in the main 3D lung image.
Imaging Examples
The images shown here were collected in the supine position with a 1.5 Tesla scanner (Siemens Avanto), using a multi-channel flexible RF coil placed on the subject's chest and two multi-channel elements of the spine coil placed beneath the subject on the scanner table. Studies were performed under an IRB-approved MRI protocol, and subjects gave written informed consent. Radial image reconstruction was performed on the scanner's own image analysis computer using a custom C++ implementation of standard k-space gridding techniques [56], allowing the reconstructed images to be displayed directly on the scanner console and manipulated using the full suite of standard viewing tools.
Figure 8 shows pairs of coronal images reconstructed at similar slice positions, from two separate 3D scans of an 18 year-old male with cystic fibrosis. The upper images were obtained during a continuous 2.5-minute scan without respiratory triggering. These images illustrate that unlike a conventional Cartesian k-space acquisition, a radial acquisition does not lead to coherent image artifacts or “ghosts” in the presence of periodic motion such as breathing or heartbeat [57]. Instead the image simply appears blurred in regions of substantial motion, as seen here around the diaphragm.
Figure 8.
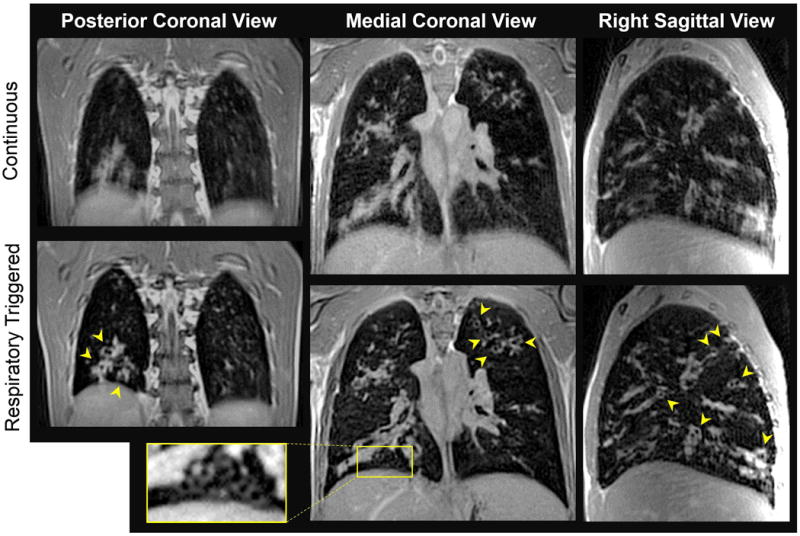
Three-dimensional structural imaging in cystic fibrosis. The upper row of images show 2mm-thick coronal views reconstructed from a non-triggered 3D scan, performed while the subject was freely breathing. The lower images are 2mm-thick views at the same slice positions, reconstructed from an equivalent respiratory triggered, segmented acquisition. Although the actual data acquisition time was the same for both scans (2.5 min), the total scan time was considerably longer for the respiratory triggered acquisition (7 min), since k-space data was acquired during only ∼35% of the respiratory period. Arrows point to thickened airways viewed in cross section, and the rectangular inset shows a cluster of even smaller airways. Many of these fine details are not well resolved in the non-triggered scan. Pulse sequence parameters included: flip angle = 15°; TR/TE = 1.18/0.09 ms; voxel size = 2.0 mm isotropic; FOV= 392 mm; equivalent Cartesian matrix = 196×196×196; 121,952 radial spokes; trigger threshold = 50%; readout gradient amplitude = 17.5 mT/m, ramp time = 230 μs, flat top time = 110 μs.
The lower images were obtained using the respiratory triggering procedure described above. Total scan time was 7 minutes. The inferior lung margin is much more sharply defined in these images. Our navigator implementation is highly effective at freezing the respiratory motion, allowing better resolution of fine structural details, especially in the caudal lung regions. Numerous enlarged and thickened airways are visible throughout the lung, many of which have bright signal intensity suggesting the presence of inflammation and excess mucous (arrowheads). Other, more subtle structural features are also apparent, such as the cluster of smaller airways discernible near the diaphragm (rectangular inset).
In Figure 9, panels (a) through (c) show 20mm-thick maximum intensity projections (MIPs), reconstructed in coronal, axial, and sagittal views, from a respiratory-triggered scan of a healthy 26-year-old female. A balanced SSFP pulse sequence is known to yield bright signal from fluid-rich tissues such as blood, and the resulting signal contrast between the larger blood vessels and the surrounding parenchyma yields excellent depiction of the pulmonary vascular structure. For comparison with the 20mm-thick MIPs, a 2mm-thick axial image from the same scan is shown in (d). The oblique fissure of the right lung, which separates the inferior lobe from the superior and middle lobes, is visible in both axial reconstructions (arrows), although it is more completely defined in the MIP (b). The horizontal fissure of the right lung, which separates the middle and superior lobes, is indirectly evident in the coronal view (a) from the break in the vascular pattern (arrow).
Figure 9.
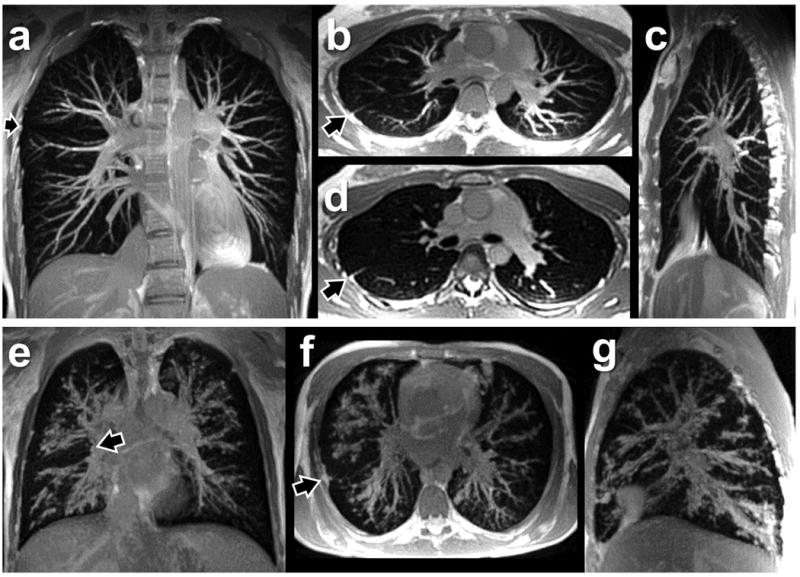
Maximum intensity projections (MIPs) in health and disease. (a-c) 20mm-thick MIPs constructed from a respiratory triggered 3D scan of a healthy subject, showing the pulmonary vasculature. (d) Single 2mm axial slice at the same location as the MIP in (b). Arrows indicate lobar fissures. (e-g) 20mm-thick MIPs constructed from the respiratory triggered scan of the cystic fibrosis subject shown in Figure 8. Mucous and inflammation in the airways, which run alongside the pulmonary arteries, obscure much of the vasculature in this subject. Despite the lack of cardiac synchronization, there are no obvious artifacts of heart motion in these 3D radial acquisitions. Pulse sequence parameters for the scan of the healthy subject included: flip angle = 15°; TR/TE = 1.19/0.09 ms; voxel size = 2.0 mm isotropic; FOV= 512 mm; equivalent Cartesian matrix = 256×256×256; 207,057 radial spokes; trigger threshold = 25%; readout gradient amplitude = 17.6 mT/m, ramp time = 240 μs, flat top time = 100 μs. Total scan time was 12 minutes; actual data acquisition occupied 4.1 minutes.
Panels (e) through (g) of Figure 9 show 20mm-thick MIPs reconstructed from the respiratory-triggered scan of the cystic fibrosis patient, at anatomic locations similar to those in (a) through (c) from the healthy subject. Instead of well-defined blood vessels with smooth margins, we primarily see enlarged, mucous-lined airways with irregular margins, reflecting a pattern of severe bronchiectasis that obscures the vasculature in these images. The totality of this disease pattern, which involves much of the airway tree, is not obvious from the thin-slice images shown in Figure 8, but is clearly revealed when multiple slices are combined into thick MIPs. The MIP reconstructions also enhance the conspicuity of the lobar fissures (arrows), including the horizontal fissure in the coronal view (e) and the oblique fissure in the axial view (f).
Discussion
The field of proton lung MRI is advancing on a variety of fronts. In the realm of functional imaging, it is now possible to regionally quantify both ventilation and perfusion, which are the two central components of lung function, and to combine these measurements to regionally quantify the V˙A/Q˙ ratio [46]. The combined use of ASL and O2-enhanced lung imaging to assess ventilation-perfusion relationships was first demonstrated more than a decade ago [58]. Since then, the methodological refinements summarized above have given these functional imaging techniques a rigorous quantitative footing, yielding measurements of V˙A and Q˙ in standard units (ml/min per unit volume) and thus V˙A/Q˙ in units of (ml air/min)/(ml blood/min). Quantification in standard units is valuable, as it allows one to recognize exactly what is being measured, and moreover permits the measurement to be interpreted within the vast body of existing medical knowledge and clinical standards of care.
This level of quantitative rigor comes at a price, however, in terms of spatial coverage and scan time. For the perfusion measurement, the slice-selective nature of the ASL tag preparation limits simultaneous application to a few thick slices of the lung. Although greater spatial coverage could certainly be obtained by accumulating multiple slices in multiple breath-hold acquisitions, the basic technique does not lend itself to volumetric acquisition. For the specific ventilation measurement, there is no inherent barrier to volumetric imaging, since the contrast agent (O2) is administered globally. However, the wash-in nature of the technique requires relatively long observation times to measure the specific ventilation in a given region, limiting the opportunity to expand spatial coverage. In addition, the low MR signal density in the lung parenchyma requires averaging the measurements of several air/O2 transitions to accumulate adequate SNR. As currently implemented the acquisition time for the combined ASL-SVI pulse sequence is eighteen minutes for a single slice of lung, primarily due to the length of the SVI measurement. Until almost full lung coverage can be achieved in a clinically reasonable scan time, these techniques are largely suitable for physiological research and have limited applicability in the clinical arena.
Another limitation of the SVI technique is that it does not allow the extremes of V˙A/Q˙ mismatch to be fully quantified. In any lung unit where specific ventilation is greater than ∼0.6, equilibration occurs within a single breath after each air/O2 transition, inhibiting the ability to differentiate high V˙A/Q˙ regions (also known as dead space) [11]. At the other extreme, the signal intensity in non-ventilated lung units does not change at the air/O2 transitions, inhibiting the ability to detect low V˙A/Q˙ regions that are perfused but not ventilated (also known as shunt) [46]. This latter issue is important, because shunt is an important contributor to hypoxemia in some types of lung disease [12].
An alternative approach for ventilation imaging is the so-called “Fourier decomposition” technique [59, 60], which uses an entirely different mechanism to generate sensitivity to regional ventilation. Instead of measuring the wash-in of a contrast agent such as oxygen or hyperpolarized gas, the Fourier decomposition technique aims to directly observe the inflation and deflation of the lung airspaces during breathing, by detecting the resulting periodic variation in local water density [61]. This is accomplished by acquiring a rapid time series of proton-density weighted images of the same slice, typically using a balanced SSFP pulse sequence. After registering each of these images to a common reference image, the time-domain Fourier transform is computed at each voxel location, and the amplitude of the Fourier component corresponding to the respiratory frequency is taken as a relative measure of the local ventilation. Since pulmonary blood flow is highly pulsatile in nature, and thus should also cause periodic density variations in the parenchyma, this approach might also provide sensitivity to perfusion. Indeed, Fourier decomposition of the signal evolution reveals two dominant peaks, corresponding to the breathing and heart rates, which can be used to construct ventilation-weighted and perfusion-weighted maps of the imaged slice [59, 60]. As currently implemented, however, this method lacks the quantitative rigor of the combined ASL-SVI procedure described above. Spatial coverage is also limited, since a complete image set must be generated at least twice per heartbeat in order to resolve the perfusion dependence. Despite these limitations, the Fourier decomposition technique provides an intriguing alternative approach for simultaneously assessing regional ventilation and perfusion using proton MRI.
In the clinical arena, there is growing interest in establishing MRI as a viable alternative to CT, both for general densitometry of parenchyma tissue [62, 63] and for more detailed structural imaging of pathology [5, 51, 52, 64–67]. Such efforts have examined both conventional echo-time [52, 62, 65, 66] and UTE approaches [5, 51, 63]. Regardless of the specific pulse sequence used, performing high-resolution volumetric imaging requires a scan time much longer than a breath hold, both to adequately sample a large 3D k-space matrix and to achieve reasonable SNR in the face of low proton density in the lung. Any successful approach must therefore allow the subject to breathe at some point during the acquisition. One option is to simply ignore the presence of respiratory motion and image continuously while the subject is freely breathing [63]. In the continuous scan shown in Figure 8, diaphragm motion does not seem to compromise image quality in the upper lobes of the lung, but blurring in the lower lobes obscures many of the fine structural details. Thus although this strategy may be sufficient for coarse imaging measurements of lung density, it is not likely to be acceptable for general clinical use.
The other option is to use some form of respiratory gating or triggering to synchronize data acquisition with the respiratory cycle. This is typically accomplished by using either an external sensor such as a respiratory bellows, which generates a signal that reflects the periodic expansion of the torso during breathing, or an imaging-based navigator such as the one demonstrated here. The chief advantage of an imaging navigator is that it directly tracks diaphragm motion, which is the primary source of respiratory artifacts. The chief disadvantage of an imaging navigator is that, unlike the respiratory bellows method, the main imaging pulse sequence must be interrupted to acquire the navigator signal. As such, this method of respiratory synchronization must be implemented as a triggered (rather than gated) acquisition, which requires a priori segmentation of the pulse sequence. Because the main pulse sequence only receives a trigger when the diaphragm position enters the acceptance window, and not when it leaves the acceptance window, the segment length must be chosen conservatively to ensure that the diaphragm position remains in the acceptance window throughout the acquisition of each segment. This arrangement is less time efficient than a gated acquisition, in which data acquisition is simply gated on and off as the (independently acquired) respiratory tracking signal passes in and out of the specified acceptance window [5], but is more effective at suppressing respiratory artifacts [68].
The use of a respiratory navigator permits the subject to breathe normally during the acquisition, which removes any fundamental requirement to minimize total scan time. The respiratory-triggered scans of the cystic fibrosis and healthy subjects shown here took 7 and 12 minutes, respectively. For the sake of patient comfort and clinical feasibility, however, it is still desirable to keep the scan as short as possible. Since our balanced SSFP pulse sequence already uses the shortest possible TR (∼1 ms), the only opportunity to reduce acquisition time is to acquire fewer k-space rays. The images shown in Figures 8 and 9 were acquired using a fully sampled radial k-space trajectory, such that the Nyquist criterion is met at the edges of the equivalent Cartesian matrix. Thus there is significant room to speed up these acquisitions without sacrificing spatial resolution, by reducing the angular sampling density below the Nyquist limit. To avoid introducing image artifacts, any of the numerous algorithms developed for reconstructing undersampled radial k-space data, such as non-Cartesian SENSE [69], compressed sensing [70], or other constrained reconstruction methods [71] could be straightforwardly applied to such an acquisition. The required number of k-space rays could be further reduced by narrowing the field of view that must be encoded by the 3D k-space trajectory. This could be accomplished by using a fast slice-selective (instead of nonselective) RF pulse to excite a thick slab perpendicular to the head-foot direction, at the cost of slightly longer TR. These strategies have been used effectively in other UTE implementations [5].
A promising structural imaging application for the 3D imaging technique demonstrated above is non-contrast pulmonary angiography. Balanced SSFP has long been recognized as a good pulse sequence strategy for imaging the pulmonary vasculature due to its bright fluid signal. Early work focused on Gadolinium-enhanced acquisitions [72, 73], but recent concerns about the safety of Gadolinium-based contrast agents [74] have since broadened the appeal of imaging methods that do not rely on contrast injection. The early SSFP implementations also required relatively long repetition times (∼5 ms) to achieve high spatial resolution, leaving the images susceptible to off-resonance artifacts. Building on the work of Bieri [6], the imaging results shown in Figure 9 demonstrate the potential for non-contrast, 3D pulmonary angiography using ultrafast SSFP pulse sequences. A spoke-radial k-space trajectory requires the shortest possible repetition time for a given spatial resolution, thereby providing maximum immunity to off-resonance SSFP artifacts, and the use of respiratory triggering allows one to image as long as necessary to achieve the desired combination of spatial resolution, field of view, and SNR without relying on contrast enhancement.
Outlook
The wide variety of MRI techniques discussed in this article are allowing fundamental aspects of lung physiology to be studied in both the spatial and temporal domains, and are laying the foundation for diagnostic-quality imaging of the human lung using proton MRI. The structural imaging techniques demonstrated here improve the spatial resolution, SNR, and spatial coverage achievable in the lung, without requiring contrast injection or difficult breath hold maneuvers, which greatly enhances their potential clinical usefulness. Although these techniques can be implemented on most modern scanners without hardware modification, they do require specialized software tools and custom pulse sequence development. Fortunately, incorporating such capabilities into the basic imaging platform is an active area of development for all the major scanner manufacturers, and it is likely that many of the features necessary for high-resolution structural imaging of the lung will become standard in the near future.
A major strength of the functional imaging methods demonstrated in this article is that they provide regional quantification of basic functional parameters in standard units of measure, which greatly enhances the physiological interpretation and clinical usefulness of the results. The ability to quantify regional V˙A/Q˙ mismatch, which could previously only be quantified using global measurements, opens up a new avenue for investigating the most important cause of impaired gas exchange in lung disease, whereas the effort to probe temporal dynamics of lung function represents an entirely new direction for physiological investigation. These techniques can be performed on virtually any 1.5 Tesla clinical scanner without additional hardware and with relatively minor pulse-sequence modifications, which makes them accessible to the greater medical community. Spatial coverage remains a challenge, however, which limits their current applicability in the clinical arena.
Some of the techniques that enable 3D structural imaging of the lung might also prove useful for functional imaging, and there are many potential opportunities for synergy. For instance, a fast spoiled UTE pulse sequence has certain characteristics that are highly relevant to the basic O2-enhanced imaging technique, including inherent T1 weighting, relatively strong parenchyma signal, and natural insensitivity to T2* variations [75]. Since this type of pulse sequence also offers better time efficiency than the spin-echo acquisitions previously used for O2-enhanced lung imaging, a UTE approach could facilitate greater spatial coverage than is practical with the slice-selective SVI implementation, which is a limitation of the SVI technique described above.
The use of respiratory triggering might also benefit the multiple-breath SVI and temporal ASL acquisitions described above. As currently implemented, these functional imaging techniques rely on active subject cooperation to synchronize image acquisition with breathing, which makes them impractical for use in young children, somnolent subjects, or patients with disease who are unable to sustain regular breathing throughout the 18-minute scan. By instead using an imaging-based navigator to trigger image acquisition at the end of each expiration, it might be possible to adapt these techniques for use in less cooperative subjects while maintaining quantitative accuracy. Expanding the range of subjects that could be imaged with these techniques would represent a significant step toward clinical applicability. Finally, the ability to combine the structural information with the functional information—essentially “one stop shopping” for characterizing pulmonary structure and function with proton MRI—might further aid in translation of these techniques into the clinical arena.
The development of new investigational tools often leads to new understanding. For example, today it is universally accepted that pulmonary blood flow is spatially heterogeneous. Any textbook of pulmonary physiology discusses the Zone Model of the distribution of pulmonary blood flow, and many include comments on the important non-gravitational components of pulmonary blood flow distribution. While the Zone Model is now taught to every medical student, it is instructive to recognize that this large, gravitationally oriented heterogeneity in pulmonary blood flow was once unimagined. In a retrospective essay John West wrote: “On a personal note, it is difficult now to realize that at that time [the introduction of inhaled 15O] there was no notion that the distribution of pulmonary blood flow was uneven, and we were utterly astonished by the findings.” [76]. In essence, if we lack the tools to observe something, it may well go unnoticed.
Acknowledgments
Grant Support: Supported by NIH grant R21 HL118539 from the National Heart, Lung, and Blood Institute, and by Siemens Medical Solutions.
Abbreviations
- UTE
ultrashort echo time
- SSFP
steady-state free precession
- FRC
functional residual capacity
- MIGET
multiple inert gas elimination technique
- HASTE
half-Fourier acquisition single-shot turbo spin-echo
- UCSD
University of California, San Diego
- UVA
University of Virginia
- V˙A
alveolar ventilation
- Q˙
perfusion
- ASL
arterial spin labeling
- FAIRER
flow-sensitive alternating inversion recovery with an extra radiofrequency pulse
- RD
relative dispersion
- FD
fluctuation dispersion
- SVI
specific ventilation imaging
- CT
computed tomography
References
- 1.Theilmann RJ, Arai TJ, Samiee A, Dubowitz DJ, Hopkins SR, Buxton RB, Prisk GK. Quantitative MRI measurement of lung density must account for the change in T2* with lung inflation. J Magn Reson Imaging. 2009;30:527–534. doi: 10.1002/jmri.21866. [DOI] [PMC free article] [PubMed] [Google Scholar]
- 2.Bergin CJ, Pauly JM, Macovsk A. Lung parenchyma: projection reconstruction MR imaging. Radiology. 1991;179:777–781. doi: 10.1148/radiology.179.3.2027991. [DOI] [PubMed] [Google Scholar]
- 3.Robson MD, Gatehouse PD, Bydder M, Bydder GM. Magnetic resonance: an introduction to ultrashort TE (UTE) imaging. J Comput Assist Tomogr. 2003;27:825–846. doi: 10.1097/00004728-200311000-00001. [DOI] [PubMed] [Google Scholar]
- 4.Schmidt MA, Yang GZ, Keegan J, Jhooti P, Gatehouse PD, Carr DH, Hansell DM, Firmin DN. Non-breath-hold lung magnetic resonance imaging with real-time navigation. MAGMA. 1997;5:123–128. doi: 10.1007/BF02592243. [DOI] [PubMed] [Google Scholar]
- 5.Johnson KM, Fain SB, Schiebler ML, Nagle S. Optimized 3D ultrashort echo time pulmonary MRI. Magn Reson Med. 2013;70:1241–1250. doi: 10.1002/mrm.24570. [DOI] [PMC free article] [PubMed] [Google Scholar]
- 6.Bieri O. Ultra-Fast Steady State Free Precession and Its Application to In Vivo 1H Morphological and Functional Lung Imaging at 1.5 Tesla. Magn Reson Med. 2013;70:657–663. doi: 10.1002/mrm.24858. [DOI] [PubMed] [Google Scholar]
- 7.Hatabu H, Gaa J, Tadamura E, Edinburgh KJ, Stock KW, Garpestad E, Edelman RR. MR imaging of pulmonary parenchyma with a half-Fourier single-shot turbo spin-echo (HASTE) sequence. Eur J Radiol. 1999;29:152–159. doi: 10.1016/s0720-048x(98)00167-3. [DOI] [PubMed] [Google Scholar]
- 8.Mai VM, Berr SS. MR perfusion imaging of pulmonary parenchyma using pulsed arterial spin labeling techniques: FAIRER and FAIR. J Magn Reson Imaging. 1999;9:483–487. doi: 10.1002/(sici)1522-2586(199903)9:3<483::aid-jmri18>3.0.co;2-#. [DOI] [PubMed] [Google Scholar]
- 9.Hatabu H, Tadamura E, Prasad PV, Chen Q, Buxton R, Edelman RR. Noninvasive pulmonary perfusion imaging by STAR-HASTE sequence. Magn Reson Med. 2000;44:808–812. doi: 10.1002/1522-2594(200011)44:5<808::aid-mrm20>3.0.co;2-4. [DOI] [PubMed] [Google Scholar]
- 10.Edelman RR, Hatabu H, Tadamura E, Li W, Prasad PV. Noninvasive assessment of regional ventilation in the human lung using oxygen-enhanced magnetic resonance imaging. Nat Med. 1996;2:1236–1239. doi: 10.1038/nm1196-1236. [DOI] [PubMed] [Google Scholar]
- 11.Sa RC, Cronin MV, Henderson AC, Holverda S, Theilmann RJ, Arai TJ, Dubowitz DJ, Hopkins SR, Buxton RB, Prisk GK. Vertical distribution of specific ventilation in normal supine humans measured by oxygen-enhanced proton MRI. J Appl Physiol. 2010;109:1950–1959. doi: 10.1152/japplphysiol.00220.2010. [DOI] [PMC free article] [PubMed] [Google Scholar]
- 12.West JB. Respiratory Physiology—The Essentials. Lippincott Williams & Wilkins; Baltimore: 2012. [Google Scholar]
- 13.West JB, Dollery CT, Naimark A. Distribution of blood flow in isolated lung; Relation to vascular and alveolar pressures. J Appl Physiol. 1964;19:713–724. doi: 10.1152/jappl.1964.19.4.713. [DOI] [PubMed] [Google Scholar]
- 14.Hughes JM, Glazier JB, Maloney JE, West JB. Effect of lung volume on the distribution of pulmonary blood flow in man. Respir Physiol. 1968;4:58–72. doi: 10.1016/0034-5687(68)90007-8. [DOI] [PubMed] [Google Scholar]
- 15.Glenny RW, Bernard S, Robertson HT, Hlastala MP. Gravity is an important but secondary determinant of regional pulmonary blood flow in upright primates. J Appl Physiol. 1999;86:623–632. doi: 10.1152/jappl.1999.86.2.623. [DOI] [PubMed] [Google Scholar]
- 16.Dawson C. Role of pulmonary vasomotion in physiology of the lung. Physiol Rev. 1984;64:544–616. doi: 10.1152/physrev.1984.64.2.544. [DOI] [PubMed] [Google Scholar]
- 17.Williams DS, Detre JA, Leigh JS, Koretsky AP. Magnetic resonance imaging of perfusion using spin inversion of arterial water. Proc Natl Acad Sci USA. 1992;89:212–216. doi: 10.1073/pnas.89.1.212. [DOI] [PMC free article] [PubMed] [Google Scholar]
- 18.Mai VM, Hagspeil KD, Christopher JM, Do HM, Altes T, Knight-Scott J, Stith AL, Maier T, Berr SS. Perfusion imaging of the human lung using flow-sensitive alternating frequency inversion recovery with an extra radiofrequency pulse (FAIRER) Magn Reson Imaging. 1999;17:355–361. doi: 10.1016/s0730-725x(98)00190-8. [DOI] [PubMed] [Google Scholar]
- 19.Bolar DS, Levin DL, Hopkins SR, Frank LF, Liu TT, Wong EC, Buxton RB. Quantification of regional pulmonary blood flow using ASL-FAIRER. Magn Reson Med. 2006;55:1308–1317. doi: 10.1002/mrm.20891. [DOI] [PubMed] [Google Scholar]
- 20.Hopkins SR, Henderson AC, Levin DL, Yamada K, Arai T, Buxton RB, Prisk GK. Vertical gradients in regional lung density and perfusion in the human lung: the Slinky effect. J Appl Physiol. 2007;103:240–248. doi: 10.1152/japplphysiol.01289.2006. [DOI] [PMC free article] [PubMed] [Google Scholar]
- 21.Prisk GK, Yamada K, Henderson AC, Arai TJ, Levin DL, Buxton RB, Hopkins SR. Pulmonary perfusion in the prone and supine postures in the normal human lung. J Appl Physiol. 2007;103:883–894. doi: 10.1152/japplphysiol.00292.2007. [DOI] [PMC free article] [PubMed] [Google Scholar]
- 22.Hopkins SR, Garg J, Bolar DS, Balouch J, Levin DL. Pulmonary blood flow heterogeneity during hypoxia in subjects with prior high altitude pulmonary edema (HAPE) Am J Respir Crit Care Med. 2005;171:83–87. doi: 10.1164/rccm.200406-707OC. [DOI] [PubMed] [Google Scholar]
- 23.Levin DL, Buxton RB, Speiss JR, Arai T, Balouch J, Hopkins SR. Effects of age on pulmonary perfusion heterogeneity measured by magnetic resonance imaging. J Appl Physiol. 2007;102:2064–2070. doi: 10.1152/japplphysiol.00512.2006. [DOI] [PubMed] [Google Scholar]
- 24.Burnham KJ, Arai TJ, Dubowitz DJ, Henderson AC, Holverda S, Buxton RB, Prisk GK, Hopkins SR. Pulmonary perfusion heterogeneity is increased by sustained heavy exercise in humans. J Appl Physiol. 2009;107:1559–1568. doi: 10.1152/japplphysiol.00491.2009. [DOI] [PMC free article] [PubMed] [Google Scholar]
- 25.Arai TJ, Henderson AC, Dubowitz DJ, Levin DL, Friedman PJ, Buxton RB, Prisk GK, Hopkins SR. Hypoxic pulmonary vasoconstriction does not contribute to pulmonary blood flow heterogeneity in normoxia in normal supine humans. J Appl Physiol. 2009;106:1057–1064. doi: 10.1152/japplphysiol.90759.2008. [DOI] [PMC free article] [PubMed] [Google Scholar]
- 26.Hopkins SR, Prisk GK. Lung perfusion measured using magnetic resonance imaging: New tools for physiological insights into the pulmonary circulation. J Magn Reson Imaging. 2010;32:1287–1301. doi: 10.1002/jmri.22378. [DOI] [PMC free article] [PubMed] [Google Scholar]
- 27.Asadi AK, Cronin MV, Sa RC, Theilmann RJ, Holverda S, Hopkins SR, Buxton RB, Prisk GK. Spatial-temporal dynamics of pulmonary blood flow in the healthy human lung in response to altered FIO2. J Appl Physiol. 2013;114:107–118. doi: 10.1152/japplphysiol.00433.2012. [DOI] [PMC free article] [PubMed] [Google Scholar]
- 28.Emami K, Xu Y, Hamedani H, Profka H, Kadlecek S, Xin Y, Ishii M, Rizi RR. Accelerated fractional ventilation imaging with hyperpolarized Gas MRI. Magn Reson Med. 2013;5:1353–1359. doi: 10.1002/mrm.24582. [DOI] [PMC free article] [PubMed] [Google Scholar]
- 29.Horn FC, Deppe MH, Marshall H, Parra-Robles J, Wild JM. Quantification of regional fractional ventilation in human subjects by measurement of hyperpolarized 3He washout with 2D and 3D MRI. J Appl Physiol. 2014 doi: 10.1152/japplphysiol.00378. in press. [DOI] [PubMed] [Google Scholar]
- 30.Chen Q, Jakob PM, Griswold MA, Levin DL, Hatabu H, Edelman RR. Oxygen enhanced MR ventilation imaging of the lung. MAGMA. 1998;7:153–161. doi: 10.1007/BF02591332. [DOI] [PubMed] [Google Scholar]
- 31.Arnold JF, Fidler F, Wang T, Pracht ED, Schmidt M, Jakob PM. Imaging lung function using rapid dynamic acquisition of T1-maps during oxygen enhancement. MAGMA. 2004;16:246–253. doi: 10.1007/s10334-004-0034-z. [DOI] [PubMed] [Google Scholar]
- 32.Mai VM, Chen Q, Bankier AA, Edelman RR. Multiple inversion recovery MR subtraction imaging of human ventilation from inhalation of room air and pure oxygen. Magn Reson Med. 2000;43:913–916. doi: 10.1002/1522-2594(200006)43:6<913::aid-mrm21>3.0.co;2-p. [DOI] [PubMed] [Google Scholar]
- 33.Mai VM, Liu B, Li W, Polzin J, Kurucay S, Chen Q, Edelman RR. Influence of oxygen flow rate on signal and T1 changes in oxygen-enhanced ventilation imaging. J Magn Reson Imaging. 2002;16:37–41. doi: 10.1002/jmri.10131. [DOI] [PubMed] [Google Scholar]
- 34.Mai VM, Tutton S, Prasad PV, Chen Q, Li W, Chen C, Liu B, Polzin J, Kurucay S, Edelman RR. Computing oxygen-enhanced ventilation maps using correlation analysis. Magn Reson Med. 2003;49:591–594. doi: 10.1002/mrm.10395. [DOI] [PubMed] [Google Scholar]
- 35.Wagner PD, Dantzker DR, Dueck R, Clausen JL, West JB. Ventilation-perfusion inequality in chronic obstructive pulmonary disease. J Clin Invest. 1977;59:203–216. doi: 10.1172/JCI108630. [DOI] [PMC free article] [PubMed] [Google Scholar]
- 36.Melot C, Naeije R, Mols P, Vandenbossche JL, Denolin H. Effects of nifedipine on ventilation/perfusion matching in primary pulmonary hypertension. Chest. 1983;83:203–207. doi: 10.1378/chest.83.2.203. [DOI] [PubMed] [Google Scholar]
- 37.Wagner PD, Dantzker DR, Iacovoni VE, Tomlin WC, West JB. Ventilation-perfusion inequality in asymptomatic asthma. Am Rev Respir Dis. 1978;118:511–524. doi: 10.1164/arrd.1978.118.3.511. [DOI] [PubMed] [Google Scholar]
- 38.Agusti AG, Roca J, Gea J, Wagner PD, Xaubet A, Rodriguez-Rosin R. Mechanisms of gas-exchange impairment in idiopathic pulmonary fibrosis. Am Rev Respir Dis. 1991;143:219–225. doi: 10.1164/ajrccm/143.2.219. [DOI] [PubMed] [Google Scholar]
- 39.Ralph DD, Robertson HT, Weaver LJ, Hlastala MP, Carrico CJ, Hudson LD. Distribution of ventilation and perfusion during positive end-expiratory pressure in the adult respiratory distress syndrome. Am Rev Respir Dis. 1985;131:54–60. doi: 10.1164/arrd.1985.131.1.54. [DOI] [PubMed] [Google Scholar]
- 40.Wagner PD, Naumann PF, Laravuso RB. Simultaneous measurement of eight foreign gases in blood by gas chromatography. J Appl Physiol. 1974;36:600–605. doi: 10.1152/jappl.1974.36.5.600. [DOI] [PubMed] [Google Scholar]
- 41.Hlastala MP. Multiple inert gas elimination technique. J Appl Physiol. 1984;56:1–7. doi: 10.1152/jappl.1984.56.1.1. [DOI] [PubMed] [Google Scholar]
- 42.Henderson AC, Prisk GK, Levin DL, Hopkins SR, Buxton RB. Characterizing pulmonary blood flow distribution measured using arterial spin labeling. NMR Biomed. 2009;22:1025–1035. doi: 10.1002/nbm.1407. [DOI] [PMC free article] [PubMed] [Google Scholar]
- 43.Spees WM, Yablonskiy DA, Oswood MC, Ackerman JJ. Water proton MR properties of human blood at 1.5 Tesla: magnetic susceptibility, T1, T2, T2*, and non-Lorentzian signal behavior. Magn Reson Med. 2001;45:533–542. doi: 10.1002/mrm.1072. [DOI] [PubMed] [Google Scholar]
- 44.Burrowes KS, Buxton RB, Prisk GK. Assessing the validity of MRI-based measurements of pulmonary blood flow distribution with anatomically-realistic model of the pulmonary circulation. J Appl Physiol. 2012;113:130–141. doi: 10.1152/japplphysiol.00894.2011. [DOI] [PMC free article] [PubMed] [Google Scholar]
- 45.Julien M, Flick MR, Hoeffel JM, Murray JF. Accurate reference measurement for postmortem lung water. J Appl Physiol. 1984;56:248–253. doi: 10.1152/jappl.1984.56.1.248. [DOI] [PubMed] [Google Scholar]
- 46.Henderson AC, Sa RC, Theilmann RJ, Buxton RB, Prisk GK, Hopkins SR. The gravitational distribution of ventilation-perfusion ratio is more uniform in prone than supine posture in the normal human lung. J Appl Physiol. 2013;115:313–324. doi: 10.1152/japplphysiol.01531.2012. [DOI] [PMC free article] [PubMed] [Google Scholar]
- 47.Tawhai MH, Nash MP, Lin CL, Hoffman EA. Supine and prone differences in regional lung density and pleural pressure gradients in the human lung with constant shape. J Appl Physiol. 2009;107:912–920. doi: 10.1152/japplphysiol.00324.2009. [DOI] [PMC free article] [PubMed] [Google Scholar]
- 48.Mure M, Domino KB, Lindahl SG, Hlastala MP, Altemeier WA, Glenny RW. Regional ventilation-perfusion distribution is more uniform in the prone position. J Appl Physiol. 2000;88:1076–1083. doi: 10.1152/jappl.2000.88.3.1076. [DOI] [PubMed] [Google Scholar]
- 49.Treppo S, Mijailovich SM, Venegas JG. Contributions of pulmonary perfusion and ventilation to heterogeneity in VA/Q measured by PET. J Appl Physiol. 1997;82:1163–1176. doi: 10.1152/jappl.1997.82.4.1163. [DOI] [PubMed] [Google Scholar]
- 50.Glover GH, Pauly JM, Bradshaw KM. Boron-11 imaging with a three-dimensional reconstruction method. J Magn Reson Imaging. 1992;2:47–52. doi: 10.1002/jmri.1880020109. [DOI] [PubMed] [Google Scholar]
- 51.Failo R, Wielopolski PA, Tiddens HAWM, Hop WCJ, Mucelli RP, Lequin MH. Lung morphology assessment using MRI: A robust ultra-short TR/TE 2D steady state free precession sequence used in cystic fibrosis patients. Magn Reson Med. 2009;61:299–306. doi: 10.1002/mrm.21841. [DOI] [PubMed] [Google Scholar]
- 52.Rajaram S, Swift AJ, Capener D, Telfer A, Davies C, Hill C, Condliffe R, Elliot C, Hurdman J, Kiely DG, Wild JM. Lung morphology assessment with balanced steady-state free precession MR imaging compared with CT. Radiology. 2012;263:569–577. doi: 10.1148/radiol.12110990. [DOI] [PubMed] [Google Scholar]
- 53.Scheffler K, Lehnhardt S. Principles and applications of balanced SSFP techniques. Eur Radiol. 2003;13:2409–2418. doi: 10.1007/s00330-003-1957-x. [DOI] [PubMed] [Google Scholar]
- 54.Wong ST, Roos MS. A strategy for sampling on a sphere applied to 3D selective RF pulse design. Magn Reson Med. 1994;32:778–84. doi: 10.1002/mrm.1910320614. [DOI] [PubMed] [Google Scholar]
- 55.Klessen C, Asbach P, Kroencke TJ, Fischer T, Warmuth C, Stemmer A, Hamm B, Taupitz M. Magnetic resonance imaging of the upper abdomen using a free-breathing T2-weighted turbo spin echo sequence with navigator triggered prospective acquisition correction. J Magn Reson Imaging. 2005;21:576–582. doi: 10.1002/jmri.20293. [DOI] [PubMed] [Google Scholar]
- 56.Jackson JI, Meyer CH, Nishimura DG, Macovski A. Selection of a convolution function for Fourier inversion using gridding. IEEE Trans Med Imaging. 1991;10:473–478. doi: 10.1109/42.97598. [DOI] [PubMed] [Google Scholar]
- 57.Glover GH, Pauly JM. Projection reconstruction techniques for reduction of motion effects in MRI. Magn Reson Med. 1992;28:275–289. doi: 10.1002/mrm.1910280209. [DOI] [PubMed] [Google Scholar]
- 58.Mai VM, Bankier AA, Prasad PV, Li W, Storey P, Edelman RR, Chen Q. MR ventilation-perfusion imaging of human lung using oxygen-enhanced and arterial spin labeling techniques. J Magn Reson Imaging. 2001;14:574–579. doi: 10.1002/jmri.1221. [DOI] [PubMed] [Google Scholar]
- 59.Bauman G, Puderbach M, Deimling M, Jellus V, Chefd'hotel C, Dinkel J, Christian Hintze C, Kauczor HU, Schad LR. Non-contrast-enhanced perfusion and ventilation assessment of the human lung by means of Fourier decomposition in proton MRI. Magn Reson Med. 2009;62:656–664. doi: 10.1002/mrm.22031. [DOI] [PubMed] [Google Scholar]
- 60.Lederlin M, Bauman G, Eichinger M, Dinkel J, Brault M, Biederer J, Puderbach M. Functional MRI using Fourier decomposition of lung signal: Reproducibility of ventilation- and perfusion-weighted imaging in healthy volunteers. Eur J Radiol. 2013;82:1015–1022. doi: 10.1016/j.ejrad.2012.12.003. [DOI] [PubMed] [Google Scholar]
- 61.Zapke M, Topf HG, Zenker M, Kuth R, Deimling M, Kreisler P, Rauh M, Chefd'hotel C, Geiger B, Rupprecht T. Magnetic resonance lung function—a breakthrough for lung imaging and functional assessment? A phantom study and clinical trial. Respir Res. 2006;7:106. doi: 10.1186/1465-9921-7-106. [DOI] [PMC free article] [PubMed] [Google Scholar]
- 62.Owrangi AM, Wang JX, Wheatleya A, McCormack DG, Parraga G. Quantitative 1H and hyperpolarized 3He magnetic resonance imaging: Comparison in chronic obstructive pulmonary disease and healthy never-smokers. Eur J Radiol. 2014;83:64–72. doi: 10.1016/j.ejrad.2012.02.018. [DOI] [PubMed] [Google Scholar]
- 63.Lederlin M, Cremillieux Y. Three-dimensional assessment of lung tissue density using a clinical ultrashort echo time at 3 Tesla: A feasibility study in healthy subjects. J Magn Reson Imaging. 2014 doi: 10.1002/jmri.24429. in press. [DOI] [PubMed] [Google Scholar]
- 64.Wild JM, Marshall H, Bock M, Schad LR, Jakob PM, Puderbach M, Molinari F, Van Beek EJ, Biederer J. MRI of the lung (1/3): methods. Insights Imaging. 2012;3:345–353. doi: 10.1007/s13244-012-0176-x. [DOI] [PMC free article] [PubMed] [Google Scholar]
- 65.Biederer J, Beer M, Hirsch W, Wild J, Fabel M, Puderbach M, Van Beek EJ. MRI of the lung (2/3) Why… when… how? Insights Imaging. 2012;3:355–371. doi: 10.1007/s13244-011-0146-8. [DOI] [PMC free article] [PubMed] [Google Scholar]
- 66.Biederer J, Mirsadraee S, Beer M, Molinari F, Hintze C, Bauman G, Both M, Van Beek EJ, Wild J, Puderbach M. MRI of the lung (3/3)—current applications and future perspectives. Insights Imaging. 2012;3:373–386. doi: 10.1007/s13244-011-0142-z. [DOI] [PMC free article] [PubMed] [Google Scholar]
- 67.Sommer G, Tremper J, Koenigkam-Santos M, Delorme S, Becker N, Biederer J, Kauczor HU, Heussel CP, Schlemmer HP, Puderbach M. Lung nodule detection in a high-risk population: Comparison of magnetic resonance imaging and low-dose computed tomography. Eur J Radiol. 2014 doi: 10.1016/j.ejrad.2013.11.012. in press. [DOI] [PubMed] [Google Scholar]
- 68.McConnell MV, Khasgiwala VC, Savord BJ, Chen MH, Chuang ML, Edelman RR, Manning WJ. Comparison of respiratory suppression methods and navigator locations for MR coronary angiography. Am J Roentgenol. 1997;68:1369–1375. doi: 10.2214/ajr.168.5.9129447. [DOI] [PubMed] [Google Scholar]
- 69.Pruessmann KP, Weiger M, Börnert P, Boesiger P. Advances in sensitivity encoding with arbitrary k-space trajectories. Magn Reson Med. 2001;46:638–651. doi: 10.1002/mrm.1241. [DOI] [PubMed] [Google Scholar]
- 70.Feng L, Grimm R, Block Tobias K, Chandarana H, Kim S, Xu J, Axel L, Sodickson DK, Otazo R. Golden-angle radial sparse parallel MRI: Combination of compressed sensing, parallel imaging, and golden-angle radial sampling for fast and flexible dynamic volumetric MRI. Magn Reson Med. 2014 doi: 10.1002/mrm.24980. in press. [DOI] [PMC free article] [PubMed] [Google Scholar]
- 71.Block KT, Uecker M, Frahm J. Undersampled radial MRI with multiple coils. Iterative image reconstruction using a total variation constraint. Magn Reson Med. 2007;57:1086–1098. doi: 10.1002/mrm.21236. [DOI] [PubMed] [Google Scholar]
- 72.Prince MR, Narasimham DL, Stanley JC. Breath-hold gadolinium enhanced MR angiography of the abdominal aorta and its branches. Radiology. 1995;197:785–792. doi: 10.1148/radiology.197.3.7480757. [DOI] [PubMed] [Google Scholar]
- 73.Hatabu H, Gaa J, Kim D, Li W, Prasad PV, Edelman RR. Pulmonary perfusion and angiography: Evaluation with breath-hold enhance three-dimensional fast imaging steady-steady precession MR imaging with short TR and TE. Am J Roentgenol. 1996;167:653–655. doi: 10.2214/ajr.167.3.8751673. [DOI] [PubMed] [Google Scholar]
- 74.Hao D, Ai T, Goerner F, Hu X, Runge VM, Tweedle M. MRI contrast agents: basic chemistry and safety. J Magn Reson Imaging. 2012;36:1060–1071. doi: 10.1002/jmri.23725. [DOI] [PubMed] [Google Scholar]
- 75.Kruger SJ, Johnson KM, Fain SB, Cadman RV, Bell LC, Nagle SK. Oxygen enhanced lung MRI using 3D radial UTE SPGR in humans. Proceedings of the 20th Annual Meeting ISMRM; Melbourne, Australia. 2012. p. 1344. [Google Scholar]
- 76.West JB. Pulmonary Gas Flow and Gas Exchange. In: West JB, editor. Respiratory Physiology: People and Ideas. Oxford University Press; New York: 1996. pp. 140–196. [Google Scholar]