Abstract
Objectives:
Early identification of potential recovery of postanoxic coma is a major challenge. We studied the additional predictive value of EEG.
Methods:
Two hundred seventy-seven consecutive comatose patients after cardiac arrest were included in a prospective cohort study on 2 intensive care units. Continuous EEG was measured during the first 3 days. EEGs were classified as unfavorable (isoelectric, low-voltage, burst-suppression with identical bursts), intermediate, or favorable (continuous patterns), at 12, 24, 48, and 72 hours. Outcome was dichotomized as good or poor. Resuscitation, demographic, clinical, somatosensory evoked potential, and EEG measures were related to outcome at 6 months using logistic regression analysis. Analyses of diagnostic accuracy included receiver operating characteristics and calculation of predictive values.
Results:
Poor outcome occurred in 149 patients (54%). Single measures unequivocally predicting poor outcome were an unfavorable EEG pattern at 24 hours, absent pupillary light responses at 48 hours, and absent somatosensory evoked potentials at 72 hours. Together, these had a specificity of 100% and a sensitivity of 50%. For the remaining 203 patients, who were still in the “gray zone” at 72 hours, a predictive model including unfavorable EEG patterns at 12 hours, absent or extensor motor response to pain at 72 hours, and higher age had an area under the curve of 0.90 (95% confidence interval 0.84–0.96). Favorable EEG patterns at 12 hours were strongly associated with good outcome. EEG beyond 24 hours had no additional predictive value.
Conclusions:
EEG within 24 hours is a robust contributor to prediction of poor or good outcome of comatose patients after cardiac arrest.
Of patients who remain comatose after cardiac arrest, 40% to 66% never regain consciousness.1,2 Early identification of patients without potential for recovery of brain function may prevent inappropriate continuation of medical treatment.3–13 A bilaterally absent somatosensory evoked potential (SSEP) is currently the most reliable predictor of poor outcome, but its sensitivity to detect poor outcome is low.10,14
Pathologic EEG patterns, such as burst-suppression and epileptiform patterns, have been associated with poor outcome, but not invariably so.15–17 We have shown that EEG activity may be severely disturbed or completely absent in the first hours after cardiac arrest, even in patients with a good outcome. However, in patients with good neurologic recovery, EEG activity improves to a certain extent within 24 hours.3,4,18,19 Absence of any recovery within that time interval accurately predicted poor outcome.3,4 Moreover, quick recovery of EEG activity toward continuous, physiologic rhythms within 12 hours was strongly associated with a favorable neurologic outcome.3,4 In the present prospective study, we estimate the contribution of raw EEG activity to multimodal prediction of either poor or good outcome in the largest published cohort of continuous EEG monitoring of comatose patients after cardiac arrest.
METHODS
Design.
This is a prospective cohort study on continuous EEG monitoring of comatose patients after cardiac arrest, conducted on intensive care units (ICUs) of 2 teaching hospitals in the Netherlands. In the Medisch Spectrum Twente (Enschede), patients were included from June 2010 to May 2014. In Rijnstate Hospital (Arnhem), patients were included from June 2012 to May 2014. Part of the EEG results from the first 148 patients was reported previously.4
Standard protocol approvals, registrations, and patient consents.
The Medical Ethical Committee Twente approved the protocol and waived the need for informed consent for EEG monitoring and clinical follow-up.
Patients.
Consecutive adult comatose patients after cardiac arrest (Glasgow Coma Scale score ≤8), admitted to the ICU, were included. Exclusion criteria were concomitant acute stroke, traumatic brain injury, or progressive neurodegenerative disease. For practical reasons, patients were not included between 8 pm and 8 am.
Treatment.
Patients were treated according to standard protocols for comatose patients after cardiac arrest. Targeted temperature management included mild therapeutic hypothermia (33°C) in all but 3 patients admitted in Medisch Spectrum Twente. In Rijnstate Hospital, 3 patients participated in the Targeted Temperature Management trial and were treated at either 33°C or 36°C.20 Since February 2014, the target temperature was set from 33°C to 36°C. Target temperature was induced as soon as possible after arrival at the emergency room or ICU and maintained for 24 hours. Induction was achieved by IV administration of cold saline and cooling pads (Arctic Sun Temperature Management System; Medivance Inc., Louisville, CO) or a cooling mattress (Blanketrol II; Cincinnati Sub-Zero Medical Division, Cincinnati, OH). After 24 hours, passive rewarming was controlled to a speed of 0.25°C or 0.5°C per hour. In case of T >38°C and a Glasgow Coma Scale score ≤8, targeted temperature management was restarted at 36.5°C to 37.5°C for another 48 hours. In Medisch Spectrum Twente, propofol and fentanyl were used for sedation. In Rijnstate Hospital, patients received a combination of propofol, midazolam, and/or morphine. Analgosedation was usually discontinued at a body temperature of 36.5°C. In both hospitals, a nondepolarizing muscle relaxant (rocuronium or atracurium) was occasionally added in case of severe compensatory shivering.
Decisions on withdrawal of treatment.
Withdrawal of treatment was considered at ≥72, during normothermia, and off sedation. Withdrawal of treatment based on severity and prognosis of postanoxic encephalopathy was never before 72 hours. Decisions on treatment withdrawal were based on international guidelines including incomplete return of brainstem reflexes, treatment-resistant myoclonus, and bilateral absence of evoked SSEPs.11 The EEG within 72 hours was not taken into account.
EEG recordings and analyses.
Continuous EEG started as soon as possible after arrival at the ICU and continued for at least 3 days, or until discharge from the ICU. Twenty-one silver–silver chloride cup electrodes were placed on the scalp according to the international 10–20 system. A Neurocenter EEG recording system (Clinical Science Systems, the Netherlands) or a Nihon Kohden system (VCM Medical, the Netherlands) was used. All EEG analyses were prespecified and performed offline, after the registrations, blinded to the point in time of the epoch, the patient's clinical status during the recording, and outcome. Epochs of 5 minutes were automatically selected by a computer algorithm at 12, 24, 48, and 72 hours after cardiac arrest.18 Epochs with raw EEG data were presented to a reviewer by the computer, in random order. Data were visually analyzed and classified by 2 experienced reviewers (M.T.-C., M.v.P., or J.H.), independently. The reviewer was allowed to skip an epoch if no clear classification was possible. Upon disagreement, consensus was determined by consultation of a third reviewer. Epochs were classified as isoelectric, low-voltage (<20 μV), epileptiform (including evolving seizures and generalized periodic discharges [GPDs]), burst-suppression, diffusely slowed, or normal. Diffuse slowing was defined as a continuous pattern with a dominant frequency <8 Hz. Normal EEG was defined as a continuous pattern with a dominant frequency ≥8 Hz. Reactivity and anterior-posterior differentiation were not included in the definition of a normal pattern. Burst-suppression was defined as clear increases in amplitude (bursts) with interburst intervals of at least 1 second with low-voltage or absent activity (suppressions, <10 μV). Burst-suppression patterns were subdivided into patterns with and without identical bursts. Burst-suppression with identical bursts was defined as burst-suppression in which shapes of subsequent bursts are identical.19
Classified EEG data were subsequently subdivided into unfavorable patterns (isoelectric, low-voltage, or burst-suppression with identical bursts), intermediate patterns (evolving seizures, GPDs, or burst-suppression without identical bursts), and favorable patterns (continuous patterns, either diffusely slowed, or normal).
Other candidate predictors.
Other candidate predictors were based on the literature and consisted of demographic measures (age and sex), resuscitation details (cardiac arrest in or out of hospital, witnessed or not witnessed, cardial or other cause, initial rhythm, and number of shocks needed to obtain adequate rhythm and output), clinical measures (pupillary light responses at 48 hours, pupillary light responses at 72 hours, and Glasgow Coma Scale score at 72 hours after cardiac arrest), and lactate levels at 24 hours. All these other candidate predictors were retrieved retrospectively from patients' digital medical files. On admission, the first medical attendant from the ICU noted resuscitation details. Daily neurologic examination was performed by ICU personnel or consulting neurologists, and included Glasgow Coma Scale score and pupillary reflexes. Corneal reflexes were inconsistently studied and therefore not included in this analysis. Reported return of spontaneous circulation times was considered unreliable, and therefore also not included. For pupillary reflexes, we dichotomized between both absent (wide, nonreactive) or at least one present. Present pupillary reflexes included obvious light responses and pinpoint pupils in case of treatment with morphine. If a patient had a maximal Glasgow Coma Scale score (E4M6V5), pupillary reflexes were only tested on indication and assumed present, if not tested. SSEPs after electrical stimulation of the right and left median nerve were only studied in case of sustained unresponsiveness at 72 hours after cardiac arrest, at normothermia, in the absence of sedative medication. Cortical N20 responses were categorized as (at least one) present or bilaterally absent.
Outcome.
The primary outcome measure was neurologic outcome expressed as the score on the 5-point Glasgow-Pittsburgh Cerebral Performance Category (CPC) at 6 months.21 Outcome was dichotomized as “good” or “poor.” Good outcome was defined as a CPC score of 1 or 2, poor outcome as a score of 3, 4, or 5. CPC scores were obtained by telephone follow-up at 6 months by the investigators who were blinded to EEG patterns. Scoring was based on a Dutch translation of the EuroQol-6D questionnaire.
Statistical analysis.
SPSS 19 (IBM Corp., Armonk, NY) was used for analyses. The complete dataset of 277 patients was used for model derivation. Internal validation was performed by bootstrapping, generating 1,000 replications of odds ratios (ORs) of each independent predictor.22 All available data were included in univariate analyses. However, patients were excluded from possible subsequent multivariate analyses in case of any missing data.
First, univariate analyses were done to identify candidate predictors associated with poor or good outcome. After checking for normal distributions, Student t test was used for continuous variables. Pearson χ2 or Fisher exact test was used for nominal variables. Patients in whom poor outcome was predicted unequivocally by one or more single predictors (i.e., without false positives) were left out of subsequent analyses.
Second, univariate analyses were repeated for patients whose outcome could not be predicted perfectly by one or more single predictors (patients in the “gray zone”). Covariates that showed possible associations with clinical outcome in this group (p < 0.10) were included in a backward multivariate logistic regression analysis to identify independent outcome predictors (p < 0.05). Discrimination of the model consisting of the optimal combination of independent outcome predictors was assessed with receiver operating characteristic analyses for patients in the gray zone.
For the complete group of patients, sensitivity, specificity, positive predictive value, and negative predictive value were calculated for (groups of) the identified “perfect” predictors of poor or good outcome, including corresponding 95% confidence intervals (CIs). For patients in the gray zone, these measures were also calculated for various probabilities of a poor outcome according to the model. Interobserver agreement of the EEG classification was analyzed with Cohen κ.
RESULTS
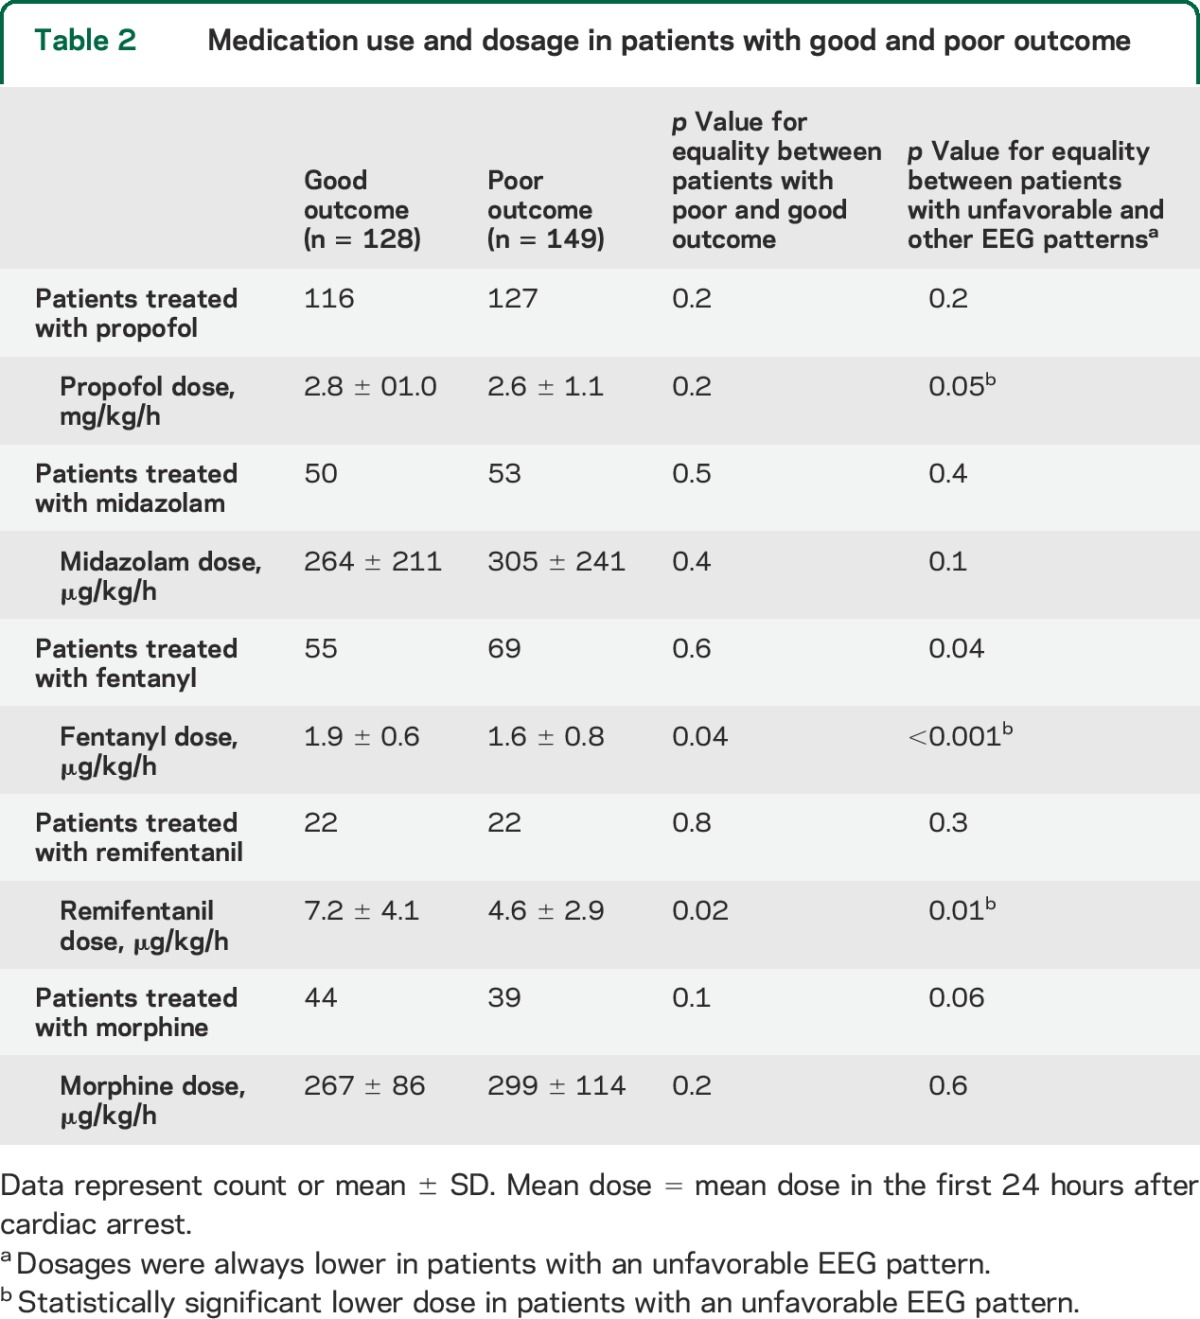
Two hundred seventy-seven consecutive patients were included, 177 in Medisch Spectrum Twente and 100 in Rijnstate Hospital (figure 1). None of the inclusions were lost to follow-up. Poor neurologic outcome occurred in 149 patients (54%), of whom 135 died. Demographic and clinical data were complete. Sporadic missing data included the cause of cardiac arrest, the initial rhythm, lactate levels at 24 hours, or EEG classification at 12, 24, 48, or 72 hours (if the EEG was started later than within 12 hours from cardiac arrest, in case of abundant artifacts, or if the patient had already died at 72 hours). Patients with and without sporadic missing data did not differ in demographic, clinical, or EEG measures, or outcome. However, SSEP studies at 72 hours were done in only 139 patients. Patients in whom SSEPs were studied more often had a poor outcome than patients in whom SSEPs were not studied (102/139 vs 47/138, p < 0.001). Patient characteristics and differences between groups of patients with good and poor outcome are presented in table 1. Medication use and dosages are presented in table 2. Of note, dosages of all analyzed medications were lower in patients with unfavorable EEG patterns, with statistically significant differences for propofol, fentanyl, and remifentanil.
Figure 1. Flow of patients through this study.
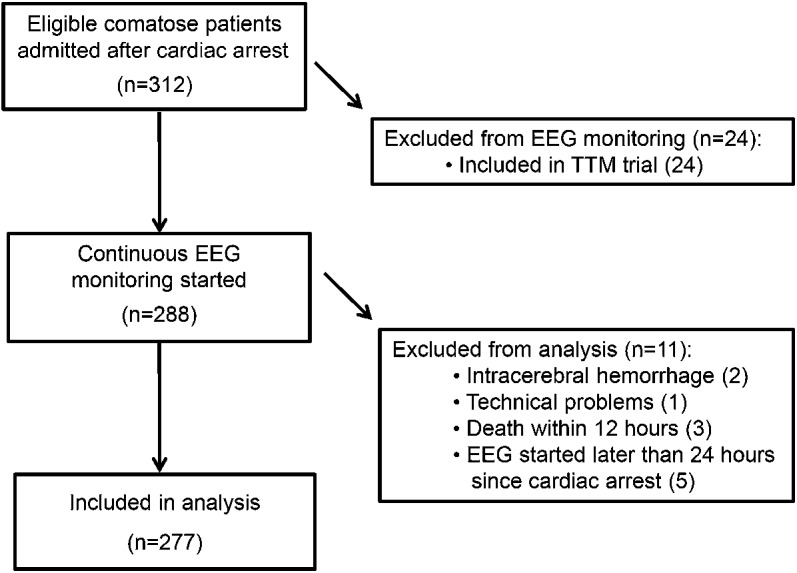
TTM = Targeted Temperature Management.
Table 1.
Patient characteristics and differences between patients with good and poor neurologic outcome
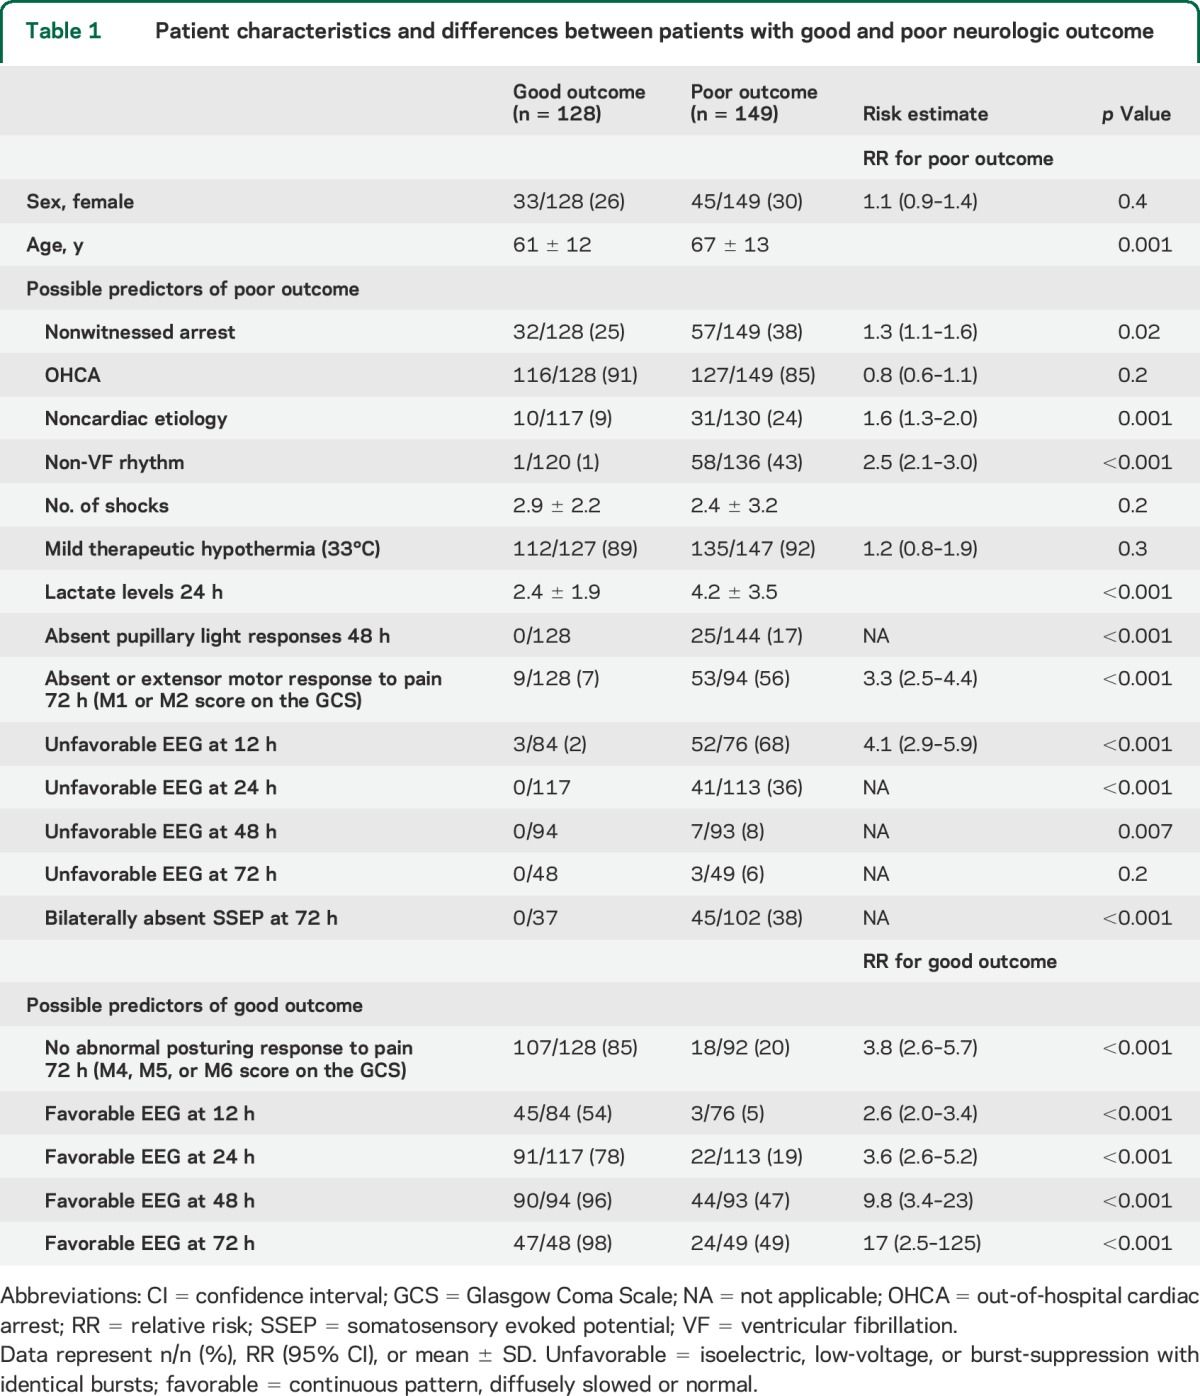
Table 2.
Medication use and dosage in patients with good and poor outcome
Single features predicting poor outcome without false positives.
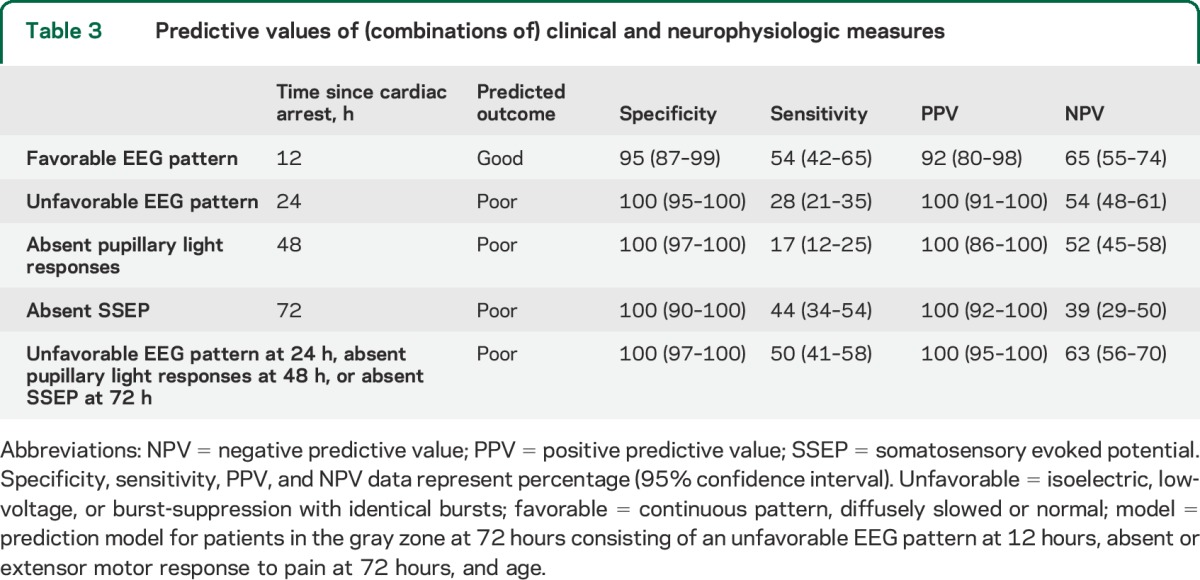
At 24 hours, an unfavorable EEG pattern (isoelectric, low-voltage, or burst-suppression with identical bursts) was present in 41 patients and unequivocally associated with poor outcome. At 48 hours, absence of pupillary light responses was present in an additional 15 patients and also unequivocally associated with poor outcome. At 72 hours, a bilaterally absent SSEP was observed in an additional 18 patients, and also unequivocally associated with poor outcome. Sensitivity, specificity, and positive and negative predictive values of (combinations of) these outcome predictors are summarized in table 3. Seven patients with a poor outcome had an unfavorable EEG pattern at 24 hours and absence of pupillary light responses and absent SSEPs. In 39, 2 of these indicators were observed. In 28, only one was observed. Fifteen patients had an unfavorable EEG pattern at 24 hours with a preserved SSEP at 72 hours. Seventeen patients had an intermediate or favorable EEG pattern at 24 hours with an absent SSEP at 72 hours.
Table 3.
Predictive values of (combinations of) clinical and neurophysiologic measures
Prediction of poor outcome of patients in the gray zone.
In 203 patients, outcome could not be predicted “perfectly” based on an unfavorable EEG pattern at 24 hours, absence of pupillary light responses at 48 hours, or absent SSEP responses at 72 hours. We call these patients in the “gray zone.” Of patients in the gray zone, 75 had a poor outcome. The following covariates were associated with poor outcome in univariate analysis: higher age, nonventricular fibrillation initial rhythm, unfavorable EEG pattern at 12 hours, higher lactate levels at 24 hours, and absent or extensor motor response to pain at 72 hours. The strongest independent predictor of poor outcome was an unfavorable EEG pattern at 12 hours (OR 30 [95% CI 5.1–174], p < 0.001), followed by absent or extensor motor response to pain at 72 hours (OR 12 [95% CI 2.8–48], p = 0.001) and higher age (OR 1.1 for each additional year [95% CI 1.0–1.2], p = 0.015). The receiver operating characteristic curve of a predictive model based on these 3 measures has an area under the curve of 0.90 (95% CI 0.84–0.96; figure 2). With bootstrapping, we confirmed all statistically significant associations, but with a wide 95% CI for the association between an unfavorable EEG pattern at 12 hours and poor outcome (OR 33, 95% CI 10.0–9.7ˑ109).
Figure 2. Receiver operating characteristic analysis for multimodal prediction of poor outcome at 6 months after cardiac arrest of comatose patients who were still in the “gray zone” at 72 hours.
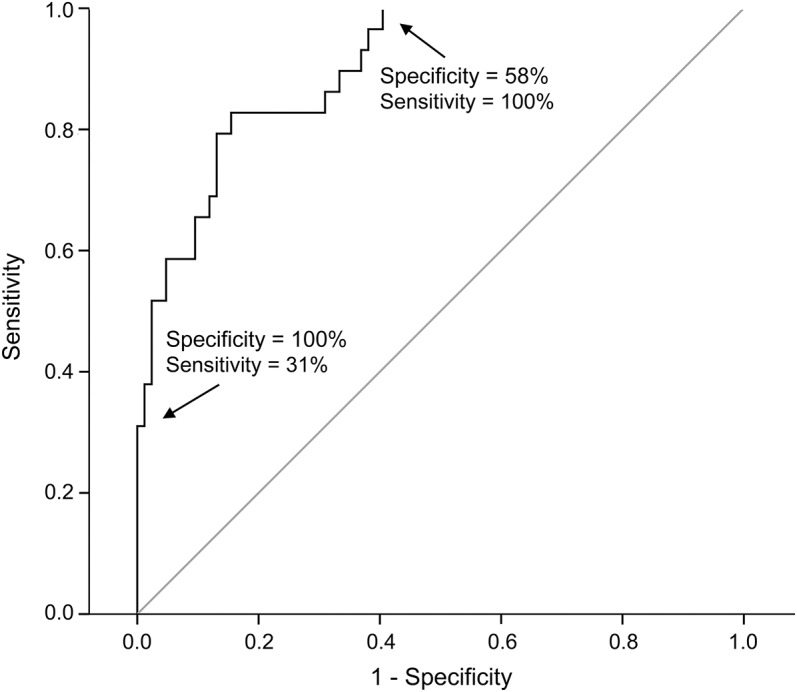
The model includes an unfavorable EEG pattern at 12 hours (isoelectric, low-voltage, or burst-suppression with identical burst patterns), absent or extensor motor response to pain at 72 hours, and age. The area under the curve is 0.90. At a predicted value of a poor outcome of 86%, specificity = 1 (100%) and sensitivity = 0.31 (31%). Note that this predictive performance only applied to comatose patients who were still in the gray zone at 72 hours, which indicates that patients with an unfavorable EEG pattern at 24 hours, absence of pupillary light responses at 48 hours, or absent somatosensory evoked potentials at 72 hours were not included in this analysis.
Prediction of good outcome of patients in the gray zone.
Absence of abnormal posturing at 72 hours (M4, M5, or M6 score on the Glasgow Coma Scale) and favorable EEG patterns at 12, 24, 48, and 72 hours (continuous pattern, diffusely slowed or normal) were associated with good outcome in univariate analyses of patients in the gray zone. The only predictor of good outcome in multiple regression analysis was a favorable EEG pattern at 12 hours, although the association with good outcome did not reach statistical significance (OR 7.3 [95% CI 0.5–134], p = 0.10). Predictive measures are given in table 2. The only patients with a favorable EEG pattern at 12 hours and a poor outcome died of nonneurologic causes (2 cardiac shock, 1 cardiac arrest). Continuous rhythms did not include typical alpha coma or theta coma patterns.
Interobserver agreement.
Interobserver agreement for designation of an unfavorable EEG pattern was 0.71.
DISCUSSION
We demonstrate the additional value of early EEG measurements for prediction of outcome of comatose patients after cardiac arrest. At 24 hours after cardiac arrest, persistent isoelectricity, low-voltage activity, or burst-suppression with identical bursts predicted a poor outcome without false positives. For patients who were still in the gray zone at 72 hours, an unfavorable EEG pattern at 12 hours was the strongest independent predictor of a poor outcome. Rapid recovery toward continuous patterns within 12 hours was almost invariably associated with a good neurologic outcome. Associations between EEG and outcome decreased with increasing time since cardiac arrest. This is explained by an evolution of the EEG toward less specific patterns beyond 24 hours.
The results of this study are partly in accordance with our own3,4,19 and other9,15–17,23,24 previous reports. However, current predictive values are higher, without false positives for unfavorable EEG patterns at 24 hours for poor outcome prediction. We consider timing an important determinant. Whereas most assume that the reliability of EEG regarding designating severity of encephalopathy increases with time,11 we observe the opposite.3,18 Apparently, in postanoxic encephalopathy, improvement of brain activity up to a minimum level within 24 hours is essential. In case of sufficient EEG recovery within 12 hours, the likelihood of a good neurologic outcome is high and survival depends on failure of other organs than the brain.
We stress that predictive values are high, despite the use of mild therapeutic hypothermia and sedative medication. We state that isoelectric, low-voltage, or burst-suppression with identical burst patterns cannot be solely induced by hypothermia, propofol, or midazolam. Propofol-induced EEG changes are well known (figure e-1 on the Neurology® Web site at Neurology.org). In the dosages that were used, patterns remain continuous with anteriorization of the “alpha” rhythm.25 If burst-suppression is induced, bursts are heterogeneous and appear and disappear gradually.26,27 Otherwise, identical burst-suppression patterns have flat interburst intervals and abrupt transitions between bursts and suppressions.19
Another determinant of the observed predictive values is the definition of unfavorable EEG patterns. We label persistent isoelectric or low-voltage patterns as unfavorable, together with the subgroup of burst-suppression with identical bursts. Although burst-suppression in general and GPDs are usually considered as “malignant” patterns,11,28 we classified these as intermediate. We acknowledge that burst-suppression and GPDs may indicate severe postanoxic encephalopathy. However, such patterns are in fact miscellanies of heterogeneous EEG activity with diverse probabilities of recovery. Outcome prediction based on these categories was only moderate.11,28 In this cohort of 277 patients, 11 had GPDs or clearly evolving seizures in the analyzed 5-minute epochs. All had a poor outcome. It is likely that more patients had episodes with such activity during the remaining time. Whether or not treatment of electrographic status epilepticus improves outcome in these patients is being studied in a randomized multicenter trial (NCT02056236).29
Besides unfavorable EEG patterns at 24 hours, absence of pupillary light responses and SSEPs predicted poor outcome unequivocally. This is as expected1,7,10,14 and included in current guidelines.11 In 39 patients 2 indicators and in 28 only 1 of the indicators of poor outcome were present, indicating that these predictors are complementary.
Although this study meets the criteria of Standards for Reporting of Diagnostic Accuracy Studies (www.stard-statement.org), it has limitations. First, a potential problem in unblinded studies investigating diagnostic accuracy is the self-fulfilling prophecy. This characterizes almost all studies on this topic.5,9,10,14 EEG classifications were assigned offline, blinded for patients' outcome, but attending physicians were not blinded for the EEG registration. However, guidelines on treatment continuation were strictly followed and do not include the EEG during the first 72 hours. Second, visual analysis of raw EEG data is subject to personal preferences. Still, visual analysis is considered gold standard. EEG analysis was done by 2 reviewers, independently, according to strict definitions, and blinded to patients' outcome. Interobserver agreement was 0.71, which is higher than the values of 0.20 to 0.65 reported for the SSEP.30 Third, there was probably selection bias in performing SSEPs, which were only studied in case of sustained unresponsiveness at 72 hours.
Supplementary Material
ACKNOWLEDGMENT
The authors thank Prof. Dr. J.A.M. van der Palen for advice on and help with statistical analysis, Eline van Staveren and Monique Raaijmakers for assistance with data collection, Carin Eertman for relentless practical contributions, and the entire ICU staffs and all clinical neurophysiology lab technicians from Medisch Spectrum Twente and Rijnstate Hospital for the extensive support and constructive collaboration.
GLOSSARY
- CI
confidence interval
- CPC
Cerebral Performance Category
- GPD
generalized periodic discharge
- ICU
intensive care unit
- OR
odds ratio
- SSEP
somatosensory evoked potential
Footnotes
Supplemental data at Neurology.org
AUTHOR CONTRIBUTIONS
Jeannette Hofmeijer: study design and conceptualization, data interpretation and analysis, writing first draft. Tim M.J. Beernink, Frank H. Bosch, and Albertus Beishuizen: revising the manuscript for intellectual content. Marleen C. Tjepkema-Cloostermans and Michel J.A.M. van Putten: study design and conceptualization, data interpretation and analysis, revising the manuscript for intellectual content.
STUDY FUNDING
Dutch Ministry of Economic Affairs, Agriculture and Innovation, province Overijssel and Gelderland (ViP Brain Networks project).
DISCLOSURE
J. Hofmeijer, T. Beernink, F. Bosch, A. Beishuizen, and M. Tjepkema-Cloostermans report no disclosures relevant to the manuscript. M. van Putten is cofounder of Clinical Science Systems. Go to Neurology.org for full disclosures.
REFERENCES
- 1.Zandbergen EG, de Haan RJ, Stoutenbeek CP, Koelman JH, Hijdra A. Systematic review of early prediction of poor outcome in anoxic-ischaemic coma. Lancet 1998;352:1808–1812. [DOI] [PubMed] [Google Scholar]
- 2.Bernard SA, Gray TW, Buist MD, et al. Treatment of comatose survivors of out-of-hospital cardiac arrest with induced hypothermia. N Engl J Med 2002;346:557–563. [DOI] [PubMed] [Google Scholar]
- 3.Cloostermans MC, van Meulen FB, Eertman CJ, Hom HW, van Putten MJ. Continuous electroencephalography monitoring for early prediction of neurological outcome in postanoxic patients after cardiac arrest: a prospective cohort study. Crit Care Med 2012;40:2867–2875. [DOI] [PubMed] [Google Scholar]
- 4.Tjepkema-Cloostermans M, Hofmeijer J, Trof RJ, Blans MJ, Beishuizen A, van Putten MJ. EEG predicts outcome in patients with postanoxic coma during mild therapeutic hypothermia. Crit Care Med 2015;43:159–162. [DOI] [PubMed] [Google Scholar]
- 5.Bouwes A, Binnekade JM, Kuiper MA, et al. Prognosis of coma after therapeutic hypothermia: a prospective cohort study. Ann Neurol 2012;71:206–212. [DOI] [PubMed] [Google Scholar]
- 6.Cronberg T, Rundgren M, Westhall E, et al. Neuron-specific enolase correlates with other prognostic markers after cardiac arrest. Neurology 2011;77:623–630. [DOI] [PubMed] [Google Scholar]
- 7.Fugate JE, Wijdicks EF, Mandrekar J, et al. Predictors of neurologic outcome in hypothermia after cardiac arrest. Ann Neurol 2010;68:907–914. [DOI] [PubMed] [Google Scholar]
- 8.Al Thenayan E, Savard M, Sharpe M, Norton L, Young B. Predictors of poor neurologic outcome after induced mild hypothermia following cardiac arrest. Neurology 2008;71:1535–1537. [DOI] [PubMed] [Google Scholar]
- 9.Rossetti AO, Oddo M, Logroscino G, Kaplan PW. Prognostication after cardiac arrest and hypothermia: a prospective study. Ann Neurol 2010;67:301–307. [DOI] [PubMed] [Google Scholar]
- 10.Oddo M, Rossetti AO. Early multimodal outcome prediction after cardiac arrest in patients treated with hypothermia. Crit Care Med 2014;42:1340–1347. [DOI] [PubMed] [Google Scholar]
- 11.Wijdicks EF, Hijdra A, Young GB, Bassetti CL, Wiebe S; Quality Standards Subcommittee of the American Academy of Neurology. Practice parameter: prediction of outcome in comatose survivors after cardiopulmonary resuscitation (an evidence-based review): report of the Quality Standards Subcommittee of the American Academy of Neurology. Neurology 2006;67:203–210. [DOI] [PubMed] [Google Scholar]
- 12.Arrich J, Holzer M, Havel C, Müllner M, Herkner H. Hypothermia for neuroprotection in adults after cardiopulmonary resuscitation. Cochrane Database Syst Rev 2012;9:CD004128. [DOI] [PubMed] [Google Scholar]
- 13.Kamps MJ, Horn J, Oddo M, et al. Prognostication of neurologic outcome in cardiac arrest patients after mild therapeutic hypothermia: a meta-analysis of the current literature. Intensive Care Med 2013;39:1671–1682. [DOI] [PubMed] [Google Scholar]
- 14.Zandbergen EG, Hijdra A, Koelman JH, et al. Prediction of poor outcome within the first 3 days of postanoxic coma. Neurology 2006;66:62–68. [DOI] [PubMed] [Google Scholar]
- 15.Rossetti AO, Carrera E, Oddo M. Early EEG correlates of neuronal injury after brain anoxia. Neurology 2012;78:796–802. [DOI] [PubMed] [Google Scholar]
- 16.Rundgren M, Rosén I, Friberg H. Amplitude-integrated EEG (aEEG) predicts outcome after cardiac arrest and induced hypothermia. Intensive Care Med 2006;32:836–842. [DOI] [PubMed] [Google Scholar]
- 17.Crepeau AZ, Rabinstein AA, Fugate JE, et al. Continuous EEG in therapeutic hypothermia after cardiac arrest: prognostic and clinical value. Neurology 2013;80:339–344. [DOI] [PubMed] [Google Scholar]
- 18.Tjepkema-Cloostermans MC, van Meulen FB, Meinsma G, van Putten MJ. A cerebral recovery Index (CRI) for early prognosis in patients after cardiac arrest. Crit Care 2013;17:R252. [DOI] [PMC free article] [PubMed] [Google Scholar]
- 19.Hofmeijer J, Tjepkema-Cloostermans MC, van Putten MJ. Burst-suppression with identical bursts: a distinct EEG pattern with poor outcome in postanoxic coma. Clin Neurophysiol 2014;125:947–954. [DOI] [PubMed] [Google Scholar]
- 20.Nielsen N, Wetterslev J, Cronberg T, et al. Targeted temperature management at 33°C versus 36°C after cardiac arrest. N Engl J Med 2013;369:2197–2206. [DOI] [PubMed] [Google Scholar]
- 21.Cummins RO, Chamberlain DA, Abramson NS, et al. Recommended guidelines for uniform reporting of data from out-of-hospital cardiac arrest: the Utstein Style. A statement for health professionals from a task force of the American Heart Association, the European Resuscitation Council, the Heart and Stroke Foundation of Canada, and the Australian Resuscitation Council. Circulation 1991;84:960–975. [DOI] [PubMed] [Google Scholar]
- 22.Steyerberg EW, Harrell FE, Borsboom GJ, Eijkemans MJ, Vergouwe Y, Habbema JD. Internal validation of predictive models: efficiency of some procedures for logistic regression analysis. J Clin Epidemiol 2001;54:774–781. [DOI] [PubMed] [Google Scholar]
- 23.Thenayan EA, Savard M, Sharpe MD, Norton L, Young B. Electroencephalogram for prognosis after cardiac arrest. J Crit Care 2010;25:300–304. [DOI] [PubMed] [Google Scholar]
- 24.Rossetti AO, Urbano LA, Delodder F, Kaplan PW, Oddo M. Prognostic value of continuous EEG monitoring during therapeutic hypothermia after cardiac arrest. Crit Care 2010;14:R173. [DOI] [PMC free article] [PubMed] [Google Scholar]
- 25.Hindriks R, van Putten MJ. Meanfield modeling of propofol-induced changes in spontaneous EEG rhythms. Neuroimage 2012;60:2323–2334. [DOI] [PubMed] [Google Scholar]
- 26.Kusters AH, Vijn PC, van den Brom WE, Haberham ZL, Venker-van Haagen AJ, Hellebrekers LJ. EEG-burst-suppression-controlled propofol anesthesia in the dog. Vet Q 1998;20(suppl 1):S105–S106. [DOI] [PubMed] [Google Scholar]
- 27.Reddy RV, Moorthy SS, Mattice T, Dierdorf SF, Deitch RD. An electroencephalographic comparison of effects of propofol and methohexital. Electroencephalogr Clin Neurophysiol 1992;83:162–168. [DOI] [PubMed] [Google Scholar]
- 28.Sandroni C, Cariou A, Cavallaro F, et al. Prognostication in comatose survivors of cardiac arrest: an advisory statement from the European Resuscitation Council and the European Society of Intensive Care Medicine. Intensive Care Med 2014;40:1816–1831. [DOI] [PMC free article] [PubMed] [Google Scholar]
- 29.Ruijter BJ, van Putten MJ, Horn J, et al. Treatment of Electroencephalographic Status Epilepticus After Cardiopulmonary Resuscitation (TELSTAR): study protocol for a randomized controlled trial. Trials 2014;15:433. [DOI] [PMC free article] [PubMed] [Google Scholar]
- 30.Zandbergen EGJ, Hijdra A, de Haan RJ, et al. Interobserver variation in the interpretation of SSEPs in anoxic-ischaemic coma. Clin Neurophysiol 2006;117:1529–1535. [DOI] [PubMed] [Google Scholar]
Associated Data
This section collects any data citations, data availability statements, or supplementary materials included in this article.


