Abstract
Statins are widely used in clinics to lower cholesterol levels. Recently, they have been shown to positively affect bone formation and bone mass in a rat model. The aim of this study was to investigate the effect of pravastatin, simvastatin and lovastatin on the osteoblastic differentiation of human mesenchymal stem cells (MSCs) in vitro. Cell number, alkaline phosphatase (ALP) activity, matrix mineralization and gene expression pattern were determined. Pravastatin did not affect cell differentiation. Simvastatin and lovastatin enhanced bone morphogenetic protein 2 (BMP-2) mRNA levels. In contrast, ALP activity and mRNA levels were suppressed by statins, as well as the DNA content and cell activity (MTT). An increase in apoptotic events was observed at high concentrations of statins, along with high Ca-45 incorporation. Lower concentrations of statins did not increase apoptotic staining, but also failed to induce calcification. When statin-induced calcification did occur, the morphology of the deposits was very different from the conventional nodule formation; the calcium was laid down along the membranes of the rounded cells suggesting it was as a result of cell death. Our results indicate that statins are not able to differentiate human MSCs into osteoblasts and that high concentrations of statins (>1 μM) have a cytotoxic effect.
Keywords: adult bone marrow stem cells, mesenchymal stem cells, toxicity, differentiation, hydroxymethylglutaryl-CoA reductase inhibitors
Introduction
Statins are inhibitors of 3-hydroxy-3-methylglutaryl coenzyme A (HMG-CoA) reductase. The product of this enzyme is mevalonate, a precursor of isoprenoid pathways in cells. Isoprenoids are building blocks of several important, sometimes essential end-products, such as: farnesylated and geranyl-geranylated proteins, ubiquinone, cholesterol, and through this latter into steroid hormones, vitamin-D, bile acids and lipoproteins [1]. The activity of many proteins is regulated by isoprenylation and/or addition of cholesterol [2]. Statins interfere with isoprenoid production, which will lead to altered protein synthesis [3].
Mevalonate and cholesterol are also essential for DNA replication and cell proliferation [4]. Besides modulating the cell cycle, statins also reduce cholesterol production. Consequently, the blood low-density lipoprotein levels decrease, and this prevents arteriosclerosis. Statins have further beneficial effects on vascular walls and on platelets [3].
The influence of statins on bone mass was first reported by Mundy et al. [5]. Lovastatin and simvastatin increased bone mass when injected subcutaneously or administered orally in rodents. It was also reported that statin therapy increased bone mass and reduced fracture risk in osteoporotic patients [6–8]. However, other studies could not show any significant difference between statin-treated patients and control [9–11].
Statins have been shown to affect both osteoclast and osteoblast cells at different levels. An inhibitory effect of statins on bone resorption was demonstrated recently by several research groups [12, 13]. They suggested that statins act on osteoclasts similarly to bisphosphonates, by the inhibition of farnesylation and geranylgeranylation of proteins, leading to inactivation of osteoclasts through cytoskeletal changes.
In addition, statins appear to enhance osteoblast function. Maeda et al. reported that statins induced the gene expression of several osteoblast markers (BMP-2, VEGF, ALP, COL1, BSP, OCN) in a pre-osteoblastic mouse cell line [14]. Pitavastatin enhanced bone morphogenetic protein 2 (BMP-2) and osteocalcin expression in primary human osteoblasts, by inhibiting Rho-kinase activity [15].
These publications illustrate that statins affect a range of tissues and cell types in vivo, and that they may be candidates to treat different types of diseases. In the elaborate environment of a living organism, many factors can modulate or even reverse the effect of a drug. It can be mediated by other cell types, for example through paracrine or endocrine signaling. The system is less complex in case of tissue engineering applications. In vitro, usually only one or a few cell types are used. Mesenchymal stem cells (MSCs) are often applied in bone tissue engineering constructs, where they are stimulated by BMPs or other factors to differentiate towards an osteoblastic phenotype. It is therefore important to know how statins influence MSCs in a simple in vitro system.
The aim of this study was to investigate the effect of different statins on the osteoblastic differentiation of primary human MSCs. Such differentiation process has been previously shown in rodent and human cell line. Simvastatin induced osteoblastic differentiation in mouse MC3T3-E1 cells and lovastatin induced osteogenesis in human D1 cell line. At the same time, adipogenic differentiation was inhibited [16, 17].
There are few reports regarding the effect of statins on primary human MSCs, and the results are rather controversial. Fluvastatin and simvastatin induced osteogenic differentiation in two separate studies [18, 19]. On the contrary, Lee et al. found that fluvastatin and lovastatin promoted neuroglial, but not osteoblastic differentiation of hMSCs [20]. There is also disagreement between studies on rodent MSCs [21, 22].
In some of the above-mentioned reports, non-standard reagents or complicated cell isolation methods were used. Therefore, we intended to clarify how unmodified, commercially available statins affect the osteoblastic differentiation of bone marrow-derived human MSCs in vitro. Should statins induce osteoblastic differentiation of MSCs, they might be useful in bone tissue engineering applications as osteogenic factors. In the present study, three statins (simvastatin, lovastatin and pravastatin) were examined.
Materials and methods
Isolation and expansion of MSCs
Bone marrow was obtained from the Schulthess Klinik (Zürich, Switzerland) with the written consent of the patients (ethical approval Nr: EK:38/2003). The marrow (30–60 ml) was aspirated into several S–Monovettes (Sarstedt, Germany). Heparin (15,000 IU) was added to each 8.5 ml tube to prevent clot formation. The samples were kept at room temperature during shipping, and the MSCs were isolated within 1 day from harvesting. First, the bone marrow was diluted 1:3 with MEM (Gibco, Luzern, Switzerland) medium containing 5% foetal bovine serum (FBS) (Gibco, lot Nr. 40G1640K and 40F9311K). Then, the mixture was layered on a Ficoll cushion (Histopaque-1077, Sigma-Aldrich, Buchs, Switzerland). After centrifuging at 800 g for 20 min., the mononuclear cells were recovered from the liquid interface, and were washed with αMEM. The isolated cells were plated in polystyrene cell culture flasks (TPP, Switzerland) and were supplemented with MEM medium, 10% FBS, non-essential amino acids (αMEM, Gibco) and 5 ng/ml recombinant human basic FGF (R&D Systems, lot Nr. AU854011 and AU854031, Abingdon, UK) as previously described [23–25]. The medium was changed after 3–5 days, and twice a week afterwards. When the cells reached confluence, they were detached with 0.5% trypsin in 5.3 mM EDTA, washed, and re-plated in cell culture flasks, or in 24-well plates for experiments. Only second or third passage cells were used in each experiment.
Experimental conditions
The cells were seeded in 24-well plates (TPP, Switzerland) at a density of 16,000 cells/cm2. During the first 3 days (recovery period), they were cultured in αMEM with 10% FBS. Then the medium was switched to αMEM with 10% FBS, non-essential amino acids, 10 mM-glycerophosphate (Sigma), 0.1 mM ascorbic-acid-2-phosphate (Sigma). Lovastatin, simvastatin and pravastatin (all synthetic, from Calbiochem, San Diego, CA, USA) were stored as 1000× stock solutions at −20° C. Pravastatin was reconstituted in Milli-Q water, lovastatin and simvastatin in DMSO. Non-induced control samples were supplied with DMSO 1:1000. Dexamethasone (dexa) containing medium (10 nM) was used as a positive control for cell differentiation and matrix mineralization.
DNA content
Cell number was evaluated by measuring the DNA content at different time-points. Cell monolayers were digested with 0.5 mg/ml recombinant Proteinase-K (Roche) at 56° C for approximately 16 hrs. DNA concentrations were determined with the Hoechst method as described by Labarca and Paigen [26]. Fluorescence intensity was measured with an HTS 7000 Perkin Elmer Bio Assay Reader.
MTT assay
MSCs were seeded in 24-well plates at a density of 11,000 cells/cm2, and were let to attach overnight. Culture media of interest were added the next day. At each time-point (day 0, 4, 11, 14 and 18), the media were removed, the cells were washed with phosphate-buffered saline (PBS), then 0.5 ml DMEM/F12 without phenol-red (Sigma) and 50 μl 5 mg/ml Thiazolyl Blue Tetrazolium Bromide (Sigma) was added to each well. The plates were incubated at 37° C for 4 hrs. The produced MTT-formazan was dissolved by the addition of 0.5 ml 2-propanol and agitating in the dark on an orbital shaker (SM25, Edmund Bühler, Tübingen, Germany) at room temperature, 150 cycles/min., for 1 hr.
Alkaline phosphatase activity assay
Cell monolayers were extracted with 1% Triton-X for 3 hrs at 4° C as previously described [27]. The extracts were frozen at −20° C until assayed. Alkaline phosphatase (ALP) activity was measured using the Sigma Kit No.104 for colorimetric ALP quantification on an HTS 7000 Perkin Elmer Bio Assay Reader. The resulting values were normalized to the DNA content of parallel cultures.
Real-time PCR
Cells were lysed with TRI-reagent (Molecular Research Center, Cincinnati, OH, USA) and the RNA isolation was carried out according to the protocol from the manufacturer. RNA was reverse transcribed with TaqMan reverse transcription kit (Applied Biosystems, Foster City, CA, USA) using random hexamers to initiate transcription. For real-time PCR, we used TaqMan PCR analysis kits, on a GeneAmp 7500 Real Time PCR System (Applied Biosystems). Primers and probes used are listed in Table 1. Tissue-independent ALP, gene expression assays was ordered from Applied Biosystems. BMP-2 construct was based on the work of Meury et al. [28]. The PCR reaction mixture contained TaqMan Universal PCR master mix without AmpErase UNG (Applied Biosystems), 900 nM primers (forward and reverse), 250 nM TaqMan probe, and 2 μl of cDNA sample for a total reaction volume of 25 μl. PCR conditions were 95°C for 10 min., followed by 40 cycles of amplification at 95°C for 15 sec. and 60°C for 1 min.
Table 1.
The real-time PCR primers and probes used
| Gene | Sequence/AB reference number |
|---|---|
| human 18S | internal control, Applied Biosystems |
| human tissue independent ALP | Hs00758162_m1 |
| human BMP-2 | forward: 5′-AACACTGTGCGCAGCTTCC-3′ |
| reverse: 5′-CTCCGGGTTGTTTTCCCAC-3′ | |
| probe: 5′(FAM)-CCATGAAGAATCTTTGGAAGAACTACCAGAAACTG-3′(TAMRA) |
Calcium incorporation
Cell cultures were incubated overnight with 1.25 μCi 45Ca isotope per ml, before washing three times with PBS. Afterwards, 0.5 ml 70% formic acid was added and the reaction mixture was kept at 65° for 1 hr as previously described [27]. Then, 3.5 ml of scintillation fluid was added. The radioactivity was measured with a 1414 WinSpectral Liquid Scintillation Counter.
Von Kossa staining
Monolayers in a 6-well plate (BD-Falcon, Franklin Lakes, NJ, USA) were washed with PBS, fixed in 4% buffered formalin, and washed 3× with deionized water. Then, 5% AgNO3 was added, and the plate was exposed to daylight for 30 min. The stained monolayers were washed 3× with deionized water, and fixed with 5% Na2S2O3 for 10 min. After the solution was washed away, the samples were observed under transmitted light microscope.
Apoptotic assays
Apoptotic staining of the cell monolayers was carried out with the Annexin-V-FLUOS Staining Kit according to the instructions from the manufacturer (Roche Diagnostics Gmbh, Mannheim, Germany). This system uses fluorescence labelled annexin type V protein, which binds to phosphatidylserine, thus labelling both apoptotic and necrotic cells. The counter-stain, propidium iodide, stains the nuclei of necrotic cells only. Images were acquired with a Zeiss LSM 510 confocal microscope.
Statistics
Statistical analysis was performed with the help of the R package for statistical computing [29]. None of the data sets were normally distributed, therefore the Kruskal–Wallis rank sum test was used to determine between-group differences. If the difference was significant at a P < 0.05 level, then pairwise Wilcoxon rank sum test comparisons were calculated, and the P-values were adjusted by Bonferroni’s method.
Results
Pravastatin had no effect on MSC differentiation based on the markers used in this study. There was no significant difference between pravastatin-treated cultures and non-induced controls regarding DNA content, BMP-2 and ALP expression, ALP activity or calcification. Therefore, in the following sections only the effect of simvastatin and lovastatin is discussed.
45Ca incorporation assay
The most important marker of fully differentiated osteoblasts is their ability to mineralize their own extracellular matrix. We used a radioactive assay to measure the effect of lova- and simvastatin, on 45Ca incorporation. Both showed an increase at high doses compared with control (Fig. 1A). Calcification was induced by day 18, which was earlier than the dexa-treated group.
Figure 1.
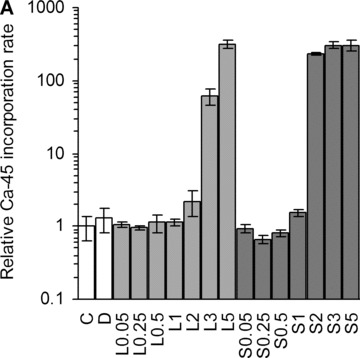
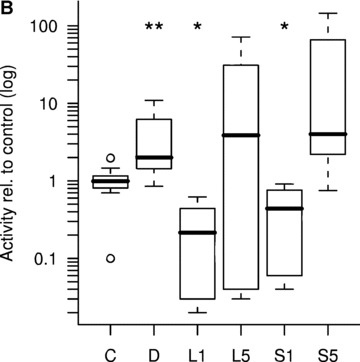
Ca-45 incorporation rates. (A) Dose-dependent increase of Ca-45 incorporation by statins at day 18. C, non-induced control; D, dexa; L, lovastatin; S, simvastatin. The numbers next to letters represent concentrations in μM. 1 donor, the error bars show S.D. of triplicates (experimental error). (B) Calcium incorporation rates relative to non-induced control after 25 days, on a logarithmic scale (3–9 donors, triplicates). C, non-induced control; D, dexa; L1, 1 μM lovastatin; L5, 5 μM lovastatin; S1, 1 μM simvastatin; S5, 5 μM simvastatin. The box contains 50% of the data points. Outliers are noted by circles. *P≤ 0.05, **P≤ 0.01 compared with non-induced control.
Based on these results, we chose to further investigate 5 μM and 1 μM concentrations, with larger sample sizes. There was no significant difference between treatment groups after 18 days (P= 0.07), although at 25 days a significant difference could be observed (Fig. 1B). As expected, the dexa-treated group had a higher activity than the non-induced control (P < 0.01). At 1 μM concentration, simva- and lovastatin samples showed a lower calcification rate (P < 0.05). The median calcification values of the 5 μM statin groups were higher than non-induced control, but the level of significance was not reached with these sample sizes.
BMP-2 expression
BMP-2 is a versatile growth factor, often associated with osteoblast differentiation. Its expression was up-regulated by statins at day 4 compared to non-induced control (Fig. 2). In contrast, dexa suppressed the expression of this gene, as has been shown before [28]. Interestingly, BMP-2 expression was increased in the non-induced control samples after 11 and 18 days of culture compared to day 4.
Figure 2.
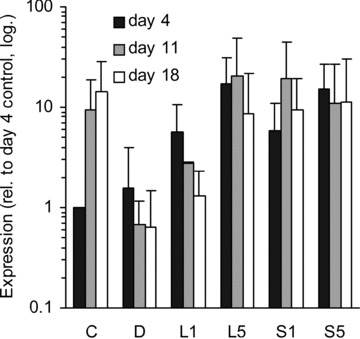
BMP-2 expression. Relative amount of BMP-2 mRNA in different treatment groups at three time-points (distinguished by greyscale shading). C, non-induced control; D, dexa; L1, 1 μM lovastatin; L5, 5 μM lovastatin; S1, 1 μM simvastatin; S5, 5 μM simvastatin. Each bar represents a mean value of 2–6 experiments (n= 2–6). All values are relative to day 4 non-induced control of the respective experiment, and are plotted on a logarithmic scale. The error bars span 1 S.D.
Statins suppress ALP activity and expression
ALP activity is another well-known marker for osteoblastic differentiation [30]. Its activity was inhibited by statins in a dose-dependent manner (Fig. 3A).
Figure 3.
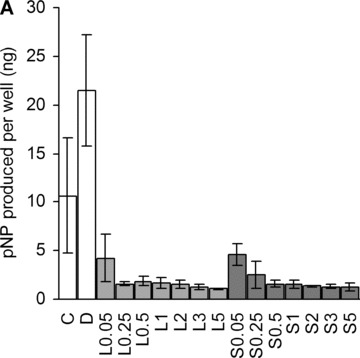
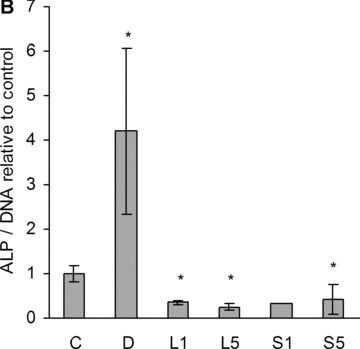
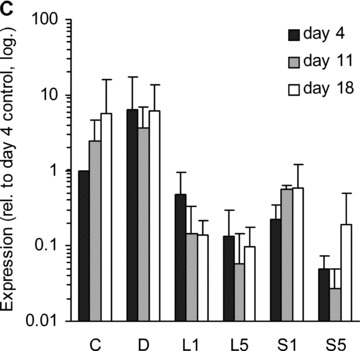
Alkaline phosphatase. (A) Dose-dependent suppression of ALP activity by statins at day 18. C, non-induced control; D, dexa; L, lovastatin; S, simvastatin. The numbers next to letters represent concentrations in μM. 1 donor, the error bars show S.D. of triplicates (experimental error). (B) ALP activity was measured with a para-nitrophenylphosphate assay at day 11. The amount of product was normalized to DNA, and compared with the activity of the non-induced control. C, non-induced control; D, dexa; L1, 1 μM lovastatin; L5, 5 μM lovastatin; S1, 1 μM simvastatin; S5, 5 μM simvastatin. The error bars represent ±1 S.D. The data are triplicates from 1 to 6 donors (n= 1 in case of S1). *P < 0.05 compared with non-induced control. (C) Relative amount of tissue independent ALP mRNA in different treatment groups at three time-points (distinguished by greyscale shading). C, non-induced control; D, dexa; L1, 1 μM lovastatin; L5, 5 μM lovastatin; S1, 1 μM simvastatin; S5, 5 μM simvastatin. Each bar represents a mean value of 2–6 experiments (n= 2–6). All values are relative to day 4 non-induced control of the respective experiment, and are plotted on a logarithmic scale. The error bars span 1 S.D.
When we further investigated 1 and 5 μM statins, we found a significant suppression in all patients at both concentrations (Fig. 3B). Dexa is known to promote osteoblastic differentiation in vitro; consequently, a marked increase in ALP activity was detected in the cells treated with dexa.
The ALP gene expression levels were also measured within the different groups (Fig. 3C). Dexa, as expected, increased ALP mRNA level compared with non-induced control samples at day 4 in case of all donors. Statins, on the other hand, clearly suppressed the ALP mRNA expression at each time-point in all donors (with 1 exception out of 40 samples).
DNA content and cell viability
Lovastatin and simvastatin-treatment lowered DNA content in a dose-dependant manner at day 18 (Fig. 4A). The initial, low cell density and 10% serum in the medium permitted MSC proliferation, as confirmed by MTT assay (Fig. 4B). When the samples were treated with 5 μM statins, the cell number only marginally increased by day 4, followed by a significant drop from day 11 to day 18. Lower statin concentration (1 μM) caused a slower increase in cell number compared with non-induced control.
Figure 4.
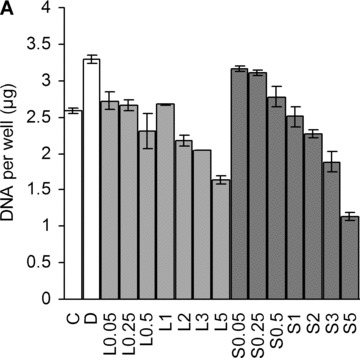
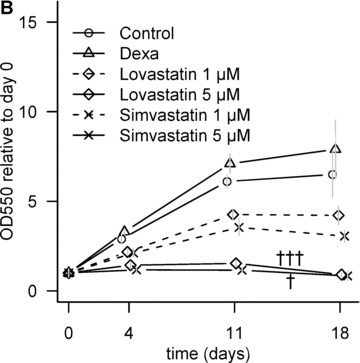
Effect of statins on cell number. (A) Dose-dependent decrease in cell number at day 18. C, non-induced control; D, dexa; L, lovastatin; S, simvastatin. The numbers next to letters represent concentrations in μM. 1 donor, the error bars show S.D. of triplicates (experimental error). (B) Relative metabolic activity determined by MTT assay at different time-points. All values are compared to day 0. The grey error bars represent standard deviation of triplicate samples from 2 donors. †P < 0.05 between day 11 and day 18 of the same treatment; †††P < 0.001 between day 11 and day 18 of the same treatment.
Von Kossa staining
Both 5 μM statins and dexamethasone caused mineral deposition, which was stained by von Kossa’s method after 25 days of culture (Fig. 5). The staining appeared very similar on the large scale, however, the microscopic morphology of these deposits was different: in the dexamethasone-treated samples mineralization was visible in the extracellular matrix and around the cells, whereas the statins caused strong staining only along the cell membranes.
Figure 5.
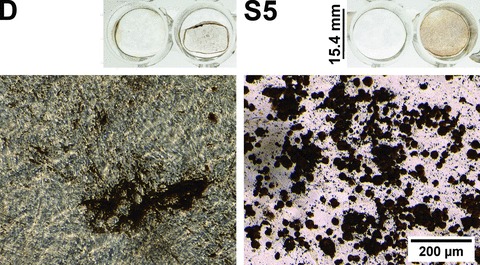
Von Kossa staining. Different calcification patterns in dexa (D) and 5 μM simvastatin (S5)-treated hMSC cultures (Von Kossa staining, phase contrast images) after 25 days. The overview images show the macroscopic appearance of the von Kossa staining in the 24-well plates. In both treatment groups, the left-hand wells were decalcified prior to the staining as a negative control. The microscope images demonstrate characteristic morphological differences in calcification. The exposure time was 36 ms at both micrographs. The contrast and gamma were modified to the same extent on both pictures in the ImageJ image analysis program for better visibility (original micrographs are available upon request).
Apoptotic staining
Statins at 5 μM clearly changed cell morphology already by day 4. The type of cell death (apoptotic or necrotic) was determined by Annexin-V-propidium-iodide combined staining. Intense Annexin-V staining was observed in 5 μM statin samples at day 18 (Fig. 6). The stained cells were large, round and the cell membranes were rough.
Figure 6.
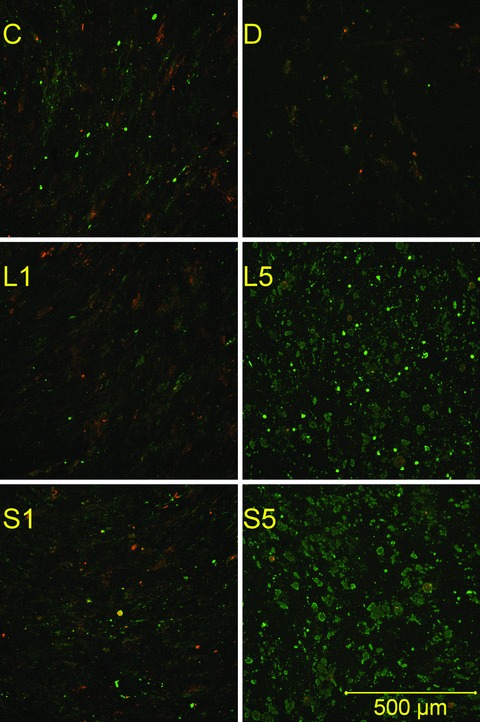
Apoptotic staining. Monolayers were stained with propidium iodide and fluorescein-labelled annexin V after 18 days of culture. Propidium (red) stains the nuclei of necrotic cells only. Green stain labels both apoptotic and necrotic cells. Therefore, apoptotic cells are single-stained (green), and necrotic cells are double-stained. Viable cells are not visible on these images. C, non-induced control; D, dexa; L1, 1 μM lovastatin; L5, 5 μM lovastatin; S1, 1 μM simvastatin; S5, 5 μM simvastatin.
Discussion
In this study, we investigated the effect of three statins on primary human MSCs. It has been suggested that statins may promote osteoblastic differentiation of MSCs in mouse and human cell line [15, 21]. These assumptions were mainly based on the increase in the mRNA expression of BMP-2. This was also observed in our experiments. However, other pronounced alterations, especially in cell morphology, suggest to us that prolonged exposure to statins might have a cytotoxic effect on most of the human MSCs.
Pravastatin did not show any effect on the measured parameters of MSC differentiation, whereas simvastatin and lovastatin showed a clear long-term detrimental effect on cell viability. A possible explanation is that lovastatin and simvastatin are hydrophobic molecules; hence, they can passively penetrate the cell membranes and affect the cell’s biochemistry in an unregulated manner. On the contrary, pravastatin is water soluble, and it has to be actively transported into cells. For example, in hepatocytes the LST-1 anion transporter protein is involved in this process [31] and its presence in human MSCs has not yet been investigated.
Simvastatin and lovastatin effectively elevated BMP-2 expression, in agreement with the results from previous reports. However, BMP-2 does not only promote osteoblast differentiation, but chondrogenic and neuronal differentiation as well [20]. ALP activity – another important marker of osteoblast differentiation – was significantly decreased. This inhibitory effect was also observed at the ALP gene expression level throughout the whole culture period. The extent of down-regulation was comparable to the decrease of activity, so statins probably regulate ALP activity at the transcription level.
These results are in contrast with the recent data of Baek et al. [19]. In their study, the ALP activity was elevated during the first 6 days. Human MSCs were isolated with the same method in both studies, and the cells were cultured with 1 μM simvastatin. However, there are differences, such as the composition of medium during MSC attachment and expansion that may explain the conflicting results. (Their expansion medium contained vitamins C and K, β-glycerophosphate and antibiotics, in addition to higher serum concentration (20%versus 10%). The source of statins (Merk versus Calbiochem) was also different.)
Furthermore, Baek et al. used osteocalcin as a differentiation marker, which appeared within 12 days. It is unlikely that osteocalcin would appear after 12 days in the negative control cultures, as it is expressed only by mature osteoblasts [32]. This suggests that their MSC isolations contained mature osteoblasts, and this would readily explain the different outcome.
Statins at 1 μM or lower concentration showed decreased 45Ca incorporation compared with control samples by day 25. This can be partially explained by the slight decrease in cell number as shown by cell viability data at day 18; at day 25 it was not measured.
Benoit et al. investigated the effect of 0.01 and 0.1 μM PEG-released fluvastatin on human MSCs [18]. They reported that the treatment had a short-term positive effect on calcium-content (4 times higher within 24 hrs). Although the total Ca content between day 7 and 14 remained higher in the treatment group, all of this increase was incorporated during the first 24 hrs. Indeed, between day 7 and day 14 the difference in total Ca incorporated diminished (1.8 times compared with 4 times at 24 hrs), indicating that the control group had a greater Ca incorporation between these time-points. This implies that low concentration of statins exerted a long-term inhibition on calcium deposition, which is in accordance with our results.
Samples treated with 5 μM statins equalled (or exceeded) the 45Ca incorporation rate of non-induced controls despite the marked decrease in cell number and the inhibition of ALP activity.
Sugawara et al. showed that enzymatic activity of the ALP protein is necessary for mineralization of osteoblastic cells in vitro[30]. Even though the calcification pattern appeared similar macroscopically, there were marked differences at the microscopic level. As the structure of the deposited calcium is different in the dexa-induced control and the statin-treated samples, the observed mineralization may not be physiological. In the statin-treated cultures the mineralization is localized around the cell membranes, suggesting release of certain ions from the cells, which can form a precipitate with the calcium and/or phosphate present in the medium. Similar, cell death-related ectopic mineralization was described by Zimmermann et al. [33].
The considerable statin-induced changes in cell morphology (rounding and enlargement) support this assumption, and indicate similar cytoskeletal changes to the ones reported by Ghosh et al. in cultured mesangial cells [2]. These changes include rounding, loss of actin stress fibres and apoptosis. Simvastatin has also been shown to have a toxic effect on pancreatic adenocarcinoma cells and mevastatin induced apoptosis in human peripheral blood monocytes [34, 35].
Based on cell viability data and apoptotic staining images, we wish to suggest that 5 μM simvastatin and lovastatin have a cytotoxic effect on most human MSCs that peaked towards the end of the culture period (18–25 days), causing ectopic mineral deposition. Cell death may be caused by the exhaustion of the pool of essential mevalonate-derived molecules (such as cholesterol) in the cells, because addition of 100 μM mevalonolactone restored the cell number and shape, and partially reversed the suppression of ALP activity in two independent experiments (data not shown). The enhanced annexin-V-binding at later time-points is also explained by this theory, because cholesterol has an important role in stabilizing cell membranes, which is lost by the inhibition of HMG-CoA reductase, and results in exposure of phosphatidylserine.
Although the negative effect of 5 μM statins on MSCs was evident, viable cells were still present even after 18 days. Because the initial adherent MSCs are a heterogeneous population, it is possible that there exists a subpopulation of cells, which is more resistant to statins than the others.
A report by Lee et al. supports our study from a different perspective: they observed neuroglial, but not osteoblastic differentiation of human MSCs treated with high concentrations of fluvastatin (50 and 2 μM) [20]. The indicative morphological changes took place in the first few days of culture, and cell death was seen after longer exposure, which is in agreement with our observations. Furthermore, Sonobe et al. stated that statins did not induce osteogenic differentiation of rat MSCs at a 0.01 μM concentration [22].
Conflicting opinions in the statin literature stem from the fact that the effects may vary depending on species, the type of statins used, and most importantly the applied concentration. We examined a range of concentrations and found that statins at 1 μM or lower concentration decreased calcification rate compared with non-induced control, together with decreased ALP activity. Below 1 μM statins did not exert any adverse effect on cell viability; the apoptotic staining was negative. This is in concert with the anti-apoptotic effect of lovastatin at low concentrations [36]. Higher statin concentration (5 μM) caused higher calcification rate, but this was coupled with – and most probably caused by – extensive cell death. Hence, these compounds should be used cautiously at high concentrations, although the toxic effect may be alleviated in vivo. Statins may still increase bone mass through inhibition of bone resorption, or increasing fully mature osteoblast’s activity via BMP-2, but they are not able to differentiate human MSCs into osteoblasts. Therefore, simvastatin and lovastatin are not suitable for bone tissue engineering applications as osteogenic factors due to their long-term toxic effect on MSCs.
References
- 1.Goldstein JL, Brown MS. Regulation of the mevalonate pathway. Nature. 1990;343:425–30. doi: 10.1038/343425a0. [DOI] [PubMed] [Google Scholar]
- 2.Ghosh PM, Mott GE, Ghosh-Choudhury N, et al. Lovastatin induces apoptosis by inhibiting mitotic and post-mitotic events in cultured mesangial cells. Biochim Biophys Acta. 1997;1359:13–24. doi: 10.1016/s0167-4889(97)00091-8. [DOI] [PubMed] [Google Scholar]
- 3.Takemoto M, Liao JK. Pleiotropic effects of 3-hydroxy-3-methylglutaryl coenzyme a reductase inhibitors. Arterioscler Thromb Vasc Biol. 2001;21:1712–9. doi: 10.1161/hq1101.098486. [DOI] [PubMed] [Google Scholar]
- 4.Quesney-Huneeus V, Wiley MH, Siperstein MD. Essential role for mevalonate synthesis in DNA replication. Proc Natl Acad Sci USA. 1979;76:5056–60. doi: 10.1073/pnas.76.10.5056. [DOI] [PMC free article] [PubMed] [Google Scholar]
- 5.Mundy G, Garrett R, Harris S, et al. Stimulation of bone formation in vitro and in rodents by statins. Science. 1999;286:1946–9. doi: 10.1126/science.286.5446.1946. [DOI] [PubMed] [Google Scholar]
- 6.Chan KA, Andrade SE, Boles M, et al. Inhibitors of hydroxymethylglutaryl-coenzyme A reductase and risk of fracture among older women. Lancet. 2000;355:2185–8. doi: 10.1016/S0140-6736(00)02400-4. [DOI] [PubMed] [Google Scholar]
- 7.Solomon DH, Finkelstein JS, Wang PS, et al. Statin lipid-lowering drugs and bone mineral density. Pharmacoepidemiol Drug Saf. 2005;14:219–26. doi: 10.1002/pds.984. [DOI] [PubMed] [Google Scholar]
- 8.Pasco JA, Kotowicz MA, Henry MJ, et al. Statin use, bone mineral density, and fracture risk: Geelong Osteoporosis Study. Arch Intern Med. 2002;162:537–40. doi: 10.1001/archinte.162.5.537. [DOI] [PubMed] [Google Scholar]
- 9.Rejnmark L, Buus NH, Vestergaard P, et al. Effects of simvastatin on bone turnover and BMD: a 1-year randomized controlled trial in postmenopausal osteopenic women. J Bone Miner Res. 2004;19:737–44. doi: 10.1359/JBMR.040209. [DOI] [PubMed] [Google Scholar]
- 10.Wada Y, Nakamura Y, Koshiyama H. Lack of positive correlation between statin use and bone mineral density in Japanese subjects with type 2 diabetes. Arch Intern Med. 2000;160:2865. doi: 10.1001/archinte.160.18.2865. [DOI] [PubMed] [Google Scholar]
- 11.Van Staa TP, Wegman S, De Vries F, et al. Use of statins and risk of fractures. JAMA. 2001;285:1850–5. doi: 10.1001/jama.285.14.1850. [DOI] [PubMed] [Google Scholar]
- 12.Staal A, Frith JC, French MH, et al. The ability of statins to inhibit bone resorption is directly related to their inhibitory effect on HMG-CoA reductase activity. J Bone Miner Res. 2003;18:88–96. doi: 10.1359/jbmr.2003.18.1.88. [DOI] [PubMed] [Google Scholar]
- 13.Hughes A, Rogers MJ, Idris AI, et al. A comparison between the effects of hydrophobic and hydrophilic statins on osteoclast function in vitro and ovariectomy-induced bone loss in vivo. Calcif Tissue Int. 2007;81:403–13. doi: 10.1007/s00223-007-9078-1. [DOI] [PubMed] [Google Scholar]
- 14.Maeda T, Matsunuma A, Kurahashi I, et al. Induction of osteoblast differentiation indices by statins in MC3T3-E1 cells. J Cell Biochem. 2004;92:458–71. doi: 10.1002/jcb.20074. [DOI] [PubMed] [Google Scholar]
- 15.Ohnaka K, Shimoda S, Nawata H, et al. Pitavastatin enhanced BMP-2 and osteocalcin expression by inhibition of Rho-associated kinase in human osteoblasts. Biochem Biophys Res Commun. 2001;287:337–42. doi: 10.1006/bbrc.2001.5597. [DOI] [PubMed] [Google Scholar]
- 16.Maeda T, Matsunuma A, Kawane T, et al. Simvastatin promotes osteoblast differentiation and mineralization in MC3T3-E1 cells. Biochem Biophys Res Commun. 2001;280:874–7. doi: 10.1006/bbrc.2000.4232. [DOI] [PubMed] [Google Scholar]
- 17.Li X, Cui Q, Kao C, et al. Lovastatin inhibits adipogenic and stimulates osteogenic differentiation by suppressing PPARgamma2 and increasing Cbfa1/Runx2 expression in bone marrow mesenchymal cell cultures. Bone. 2003;33:652–9. doi: 10.1016/s8756-3282(03)00239-4. [DOI] [PubMed] [Google Scholar]
- 18.Benoit DSW, Nuttelman CR, Collins SD, et al. Synthesis and characterization of a fluvastatin-releasing hydrogel delivery system to modulate hMSC differentiation and function for bone regeneration. Biomaterials. 2006;27:6102–10. doi: 10.1016/j.biomaterials.2006.06.031. [DOI] [PubMed] [Google Scholar]
- 19.Baek KH, Lee WY, Oh KW, et al. The effect of simvastatin on the proliferation and differentiation of human bone marrow stromal cells. J Korean Med Sci. 2005;20:438–44. doi: 10.3346/jkms.2005.20.3.438. [DOI] [PMC free article] [PubMed] [Google Scholar]
- 20.Lee OK-S, Ko YC, Kuo TK, et al. Fluvastatin and lovastatin but not pravastatin induce neuroglial differentiation in human mesenchymal stem cells. J Cell Biochem. 2004;93:917–28. doi: 10.1002/jcb.20241. [DOI] [PubMed] [Google Scholar]
- 21.Song C, Guo Z, Ma Q, et al. Simvastatin induces osteoblastic differentiation and inhibits adipocytic differentiation in mouse bone marrow stromal cells. Biochem Biophys Res Commun. 2003;308:458–62. doi: 10.1016/s0006-291x(03)01408-6. [DOI] [PubMed] [Google Scholar]
- 22.Sonobe M, Hattori K, Tomita N, et al. Stimulatory effects of statins on bone marrow-derived mesenchymal stem cells. Study of a new therapeutic agent for fracture. Biomed Mater Eng. 2005;15:261–7. [PubMed] [Google Scholar]
- 23.Martin I, Muraglia A, Campanile G, et al. Fibroblast growth factor-2 supports ex vivo expansion and maintenance of osteogenic precursors from human bone marrow. Endocrinology. 1997;138:4456–62. doi: 10.1210/endo.138.10.5425. [DOI] [PubMed] [Google Scholar]
- 24.Walsh S, Jefferiss C, Stewart K, et al. Expression of the developmental markers STRO-1 and alkaline phosphatase in cultures of human marrow stromal cells: regulation by fibroblast growth factor (FGF)-2 and relationship to the expression of FGF receptors 1–4. Bone. 2000;27:185–95. doi: 10.1016/s8756-3282(00)00319-7. [DOI] [PubMed] [Google Scholar]
- 25.Bianchi G, Banfi A, Mastrogiacomo M, et al. Ex vivo enrichment of mesenchymal cell progenitors by fibroblast growth factor 2. Exp Cell Res. 2003;287:98–105. doi: 10.1016/s0014-4827(03)00138-1. [DOI] [PubMed] [Google Scholar]
- 26.Labarca C, Paigen K. A simple, rapid, and sensitive DNA assay procedure. Anal Biochem. 1980;102:344–52. doi: 10.1016/0003-2697(80)90165-7. [DOI] [PubMed] [Google Scholar]
- 27.Alini M, Carey D, Hirata S, et al. Cellular and matrix changes before and at the time of calcification in the growth plate studied in vitro: arrest of type X collagen synthesis and net loss of collagen when calcification is initiated. J Bone Miner Res. 1994;9:1077–87. doi: 10.1002/jbmr.5650090716. [DOI] [PubMed] [Google Scholar]
- 28.Meury T, Verrier S, Alini M. Human endothelial cells inhibit BMSC differentiation into mature osteoblasts in vitro by interfering with osterix expression. J Cell Biochem. 2006;98:992–1006. doi: 10.1002/jcb.20818. [DOI] [PubMed] [Google Scholar]
- 29.R. Development Core Team. R: A language and environment for statistical computing. R Foundation for Statistical Computing; 2005. Vienna, Austria: [Google Scholar]
- 30.Sugawara Y, Suzuki K, Koshikawa M, et al. Necessity of enzymatic activity of alkaline phosphatase for mineralization of osteoblastic cells. Jpn J Pharmacol. 2002;88:262–9. doi: 10.1254/jjp.88.262. [DOI] [PubMed] [Google Scholar]
- 31.Nakai D, Nakagomi R, Furuta Y, et al. Human liver-specific organic anion transporter, LST-1, mediates uptake of pravastatin by human hepatocytes. J Pharmacol Exp Ther. 2001;297:861–7. [PubMed] [Google Scholar]
- 32.Aubin JE, Triffitt JT. Mesenchymal stem cells and osteoblast differentiation. In: Bilezikian JP, Raisz LG, Rodan GA, editors. Principles of bone biology. Academic Press; 2002. pp. 59–81. In:, editors.. San Diego, CA: . [Google Scholar]
- 33.Zimmermann B, Wachtel HC, Noppe C. Patterns of mineralization in vitro. Cell Tissue Res. 1991;263:483–93. doi: 10.1007/BF00327281. [DOI] [PubMed] [Google Scholar]
- 34.Ura H, Obara T, Nishino N, et al. Cytotoxicity of simvastatin to pancreatic adenocarcinoma cells containing mutant ras gene. Jpn J Cancer Res. 1994;85:633–8. doi: 10.1111/j.1349-7006.1994.tb02406.x. [DOI] [PMC free article] [PubMed] [Google Scholar]
- 35.Vamvakopoulos JE, Green C. HMG-CoA reductase inhibition aborts functional differentiation and triggers apoptosis in cultured primary human monocytes: a potential mechanism of statin-mediated vasculoprotection. BMC Cardiovasc Disord. 2003;3:6. doi: 10.1186/1471-2261-3-6. [DOI] [PMC free article] [PubMed] [Google Scholar]
- 36.Xu R, Chen J, Cong X, et al. Lovastatin protects mesenchymal stem cells against hypoxia- and serum deprivation-induced apoptosis by activation of PI3K/Akt and ERK1/2. J Cell Biochem. 2008;103:256–69. doi: 10.1002/jcb.21402. [DOI] [PubMed] [Google Scholar]


