

Abstract
MicroRNAs (miRNAs) are thought to modulate a variety of cellular events. Several studies have revealed the functions of miR-223 in granulopoiesis. Here we analysed miR-223 expression in various human tissues, blood and leukaemia cells, and focused on its role in K562 erythroid and megakaryocytic differentiation. MiR-223 was detected not only in granulocytes but also in erythroid cells. In K562 cells, expression of miR-223 was down-regulated during haemin-induced erythroid differentiation but up-regulated during phorbol myristate acetate (PMA)-induced megakaryocytic differentiation. The overexpression of miR-223 resulted in significant decrease of γ-globin mRNA and the fraction of benzidine-positive cells in K562 cells, suggesting a suppressive effect of miR-223 on erythroid differentiation. Peaks corresponding to 4N cells in stable transfectants overexpressing miR-223 were higher than that in control K562 cells during megakaryocytic differentiation, indicating that miR-223 increases megakaryocytic differentiation. The expression of LIM domain only 2 (LMO2) reporter was suppressed in NIH-3T3 when the expression of miR-223 was enforced by both the luciferase and fluorescence system. Furthermore, LMO2 mRNA and protein levels were significantly decreased in stable K562 transfectants overexpressing miR-223. These results indicate that LMO2 is a direct target of miR-223. Thus, our results suggest that miR-223 reversibly regulates erythroid and megakaryocytic differentiation of K562 cells via down-modulation of LMO2.
Keywords: microRNA-223, LIM domain only 2 (LMO2), K562, erythroid differentiation, megakaryocytic differentiation
Introduction
Haematopoiesis is a life-long, highly regulated, multi-stage process where self-renewing haematopoietic stem cells (HSCs) give raise to all blood cell lineages. This process is controlled, at least in part, through the combinatorial action of lineage-restricted, and also more widely expressed, transcription factors [1, 2]. There is also strong evidence that microRNAs (miRNAs) are involved in both normal haematopoiesis and haematological malignancies [3, 4].
The expression of miR-181, miR-223 and miR-142 is regulated in murine haematopoiesis and the forced expression of miR-181 in murine haematopoietic progenitor cells leads to proliferation of B cells [5]. MiR-221 and miR-222 are both down-regulated in human erythropoietic cultures of CD34+ cord blood progenitor cells and both targeted c-Kit mRNA [6]. The transcription factors MAFB and HOXA1 were confirmed to be targets of miR-130a and miR-10a respectively in megakaryocytic differentiation in vitro and in vivo[7].
There are also reports that the expression of some miRNAs is modulated in haematopoietic malignancies. The deletion and down-regulation of the miR-15a and miR-16-1 genes is common in chronic lymphocytic leukaemia [8]. Up-regulation of miR-155 and host gene B-cell integration cluster (BIC) was found in B-cell lymphomas [9]. The miR-17-92 gene cluster is overexpressed in human B-cell lymphomas and the forced expression of this cluster acts in concert with avian myelocytomatosis virus oncogene cellular homologue (c-MYC) expression to accelerate tumour development in a mouse B-cell lymphoma model [10].
MiR-223 is an intergenic miRNA and its gene is located on chromosome X (65155437–65155546). Chen et al. determined that miR-223 was primarily found in granulocytes and macrophages isolated from mouse bone marrow [5]. A more recent study revealed that miR-223 is a key member of a regulatory circuit involving CCAAT enhancer binding protein α (C-EBPα) and nuclear factor I/A (NFI-A). C-EBPα and NFI-A control granulocytic differentiation in acute promyelocytic leukaemia cell lines treated with all-trans retinoic acid [11]. These observations indicate that miR-223 is an important regulator of haematopoiesis and is also involved in malignant transformation. Although the primary influence of miR-223 was reported to be on granulopoiesis, a recent study in mice showed miR-223 to negatively regulate progenitor proliferation and granulocyte differentiation. The target of miR-223 was determined to be a transcription factor, Mef2c, that promotes myeloid progenitor proliferation [12].
In the present study, we have investigated miR-223 expression in human tissues and haematopoietic cells. Interestingly, miR-223 is also highly expressed in K562 and HEL cell lines of erythroid origin. K562 cells have been used as representative models of ery-throid and megakaryocytic differentiation. In K562 cells, mature miR-223 is down- and up-regulated during erythroid and megakaryocytic differentiation, respectively. We demonstrated that enforced expression of miR-223 could suppress erythroid differentiation but promote megakaryocytic differentiation in K562 cells and that this process involves LMO2 mRNA.
Materials and methods
Cell lines and cell culture
The following human leukaemia cell lines were used in this study: K562 (human erythroleukaemia cell line), HEL (human erythroleukaemia cell line), HL-60 (human promyelocytic leukaemia cell line), Jurkat (human acute T-cell leukaemia cell line), HUT-78 (human T-lymphoma cell line), CMK (human megakaryoblastic leukaemia cell line), 3D5 (human B cell line), Raji (human B-non-Hodgkin's lymphoma cell line) and THP-1 (human monocytic leukaemia cell line). All cells were grown in RPMI 1640 media (Gibico BRL, Grand Island, NY, USA) supplemented with 10% FBS (Gibico BRL) at 37°C in 5% CO2.
Erythroid and megakaryocytic induction of K562 cells
Erythroid differentiation of K562 cells was induced with 40 μM haemin (Sigma-Aldrich, Deisenhofen, Germany), whereas megakaryocytic differentiation was induced with 5 ng/ml phorbol myristate acetate (PMA) (Sigma-Aldrich). Erythroid differentiation of K562 cells was assessed by the benzidine cytochemical test [13] where benzidine-positive cells indicate more mature erythroid cells. In some experiments, γ-globin mRNA was detected by real-time PCR. The mRNA level are higher in more mature erythroid cells than that in undifferentiated cells. Megakaryocyte differentiation of K562 cells was assessed by ploidy analysis [14]. The ploidy classes were determined following flow cytometric analysis after propidium iodide (PI) staining.
Isolation of normal haematopoietic lineage cells
Umbilical cord blood (UCB) samples from normal full-term deliveries were obtained after informed consent. Mononuclear cells from UCB samples were separated by density gradient centrifugation using a Percoll density gradient (d = 1.077; Amersham Pharmacia Biotech, Freiburg, Germany). Magnetic Activated Cell Sorting (MACS) (Miltenyi Biotec, Bergisch-Gladbach, Germany) separation system was used for the subsequent different selection sequences: negative followed by positive selection (−/+ selection) and double-positive selection. MACS microbeads were used to isolate individual lineages: B cells (CD64-FITC−, CD19-PE+), T cells (CD64-FITC−, CD3-PE+), erythroid cells (CD64-FITC−, CD71-PE+), granulocytes (CD64-FITC−, CD13-PE+) and monocytes (CD64-FITC+, CD14-PE+). All antibodies were supplied by eBioscience (eBioscience, San Diego, CA, USA).
PAGE-Northern analysis of miRNAs
Total RNA was extracted from all cells with Trizol reagent (Invitrogen, Carlsbad, CA, USA) following the manufacturer’s instructions. RNA samples from human tissues were purchased from Shenergy Biocolor Bioscience & Technology Company, Shanghai. PAGE-Northern analysis was performed as described previously with minor modifications [5]. The extracted total RNA samples were denatured and loaded onto denaturing 15% TBE-Urea gels, transferred onto Hybond-N+ membrane (Amersham Pharmacia Biotech) after separation and then cross-linked with ultraviolet radiation. The blots were pre-hybridized using Hybridization buffer (BioDev, Beijing, China), and then hybridized with γ-32P end-labelled miRNA probes for miR-223 at 37°C for 16 hrs. After washing, the hybridized membranes were exposed to X-ray films at −70°C for 72 hrs. U6snRNA was used as a control probe for checking equal RNA loading.
Cell transfection
K562 cells were transfected with 30 pmol of oligonucleotide pre-miR-223 (miR-223 precursor) and anti-miR-223 (miR-223 inhibitor) (Ambion, Austin, TX, USA) using siPORT™NeoFx™ (Ambion). A 220 bp HindIII and BamHI fragment of pri-miR-223 was amplified from K562 genome DNA by miR-223 FW primer (5′-GCAAGCTTCATCATTCCTTTCTCTCT-3′) and miR-223 RW primer (5′-TAGGTACCGCATCCTTGTATCCAGCT-3′). The amplified DNA was inserted into eukaryotic expression vector pcDNA3.1 to obtain the recombinant plasmid pcDNA3.1-pri-miR-223. K562 cells were transfected with 1 μg of pcDNA3.1-pri-miR-223 or pcDNA3.1 using Lipofectamine 2000 (Invitrogen). The transfected K562 cells were cultured in media containing 400 μg/ml G418 (Invitrogen) to select stable transfectants. Another plasmid (pSilencer 2.1-U6-Neo-pre-miR-223) was also constructed by inserting pre-miR-223 to a small RNA expression vector pSilencer 2.1-U6-Neo followed by trasfecting into K562 cells to generate stable transfectants.
Luciferase and fluorescence reporter experiments
3′-UTR segments containing the target sites for miR-223 were amplified by PCR from LIM domain only 2 (LMO2) cDNA and inserted into pRL-TK and pEGFP-C1 downstream from the reporter gene. The LMO2 FW primer (5′-CGTCTAGACCGTCTCCATGGCATCTTCG-3′) and LMO2 RW primer (5′-ATGCGGCCGCTCTACACACGACAAATACTT-3′) were used to generate specific LMO2 fragments that were inserted into the XbaI and NotI sites of pRL-TK to obtain the recombinant plasmid LMO2-pRL-TK. The LMO2 FW primer (5′-TAGAATTCGCCGTCTCCATGGCATCT-3′) and LMO2 RW primer (5′-CGGGATCCTCTACACACGACAAATAC-3′) were used to generate specific LMO2 fragments that were inserted to the EcoRI and BamHI site of pEGFP-C1 to obtain the recombinant report plasmid LMO2-pEGFP-C1. The reporter plasmid was co-transfected with oligonucleotides pre-miR-223 and anit-miR-223 to K562 cells or stable transfectant cells using Lipofectamine 2000 (Invitrogen) according to the manufacturer’s instructions. Firefly (pGL-3, internal control) and renilla luciferase (pRL-TK) activities were measured consecutively using the dual luciferase assay system (Promega, Madison, WI, USA.) and EGFP expression was observed under microscope 24 hrs after transfection. The reverse complementary sequence of miR-223 was also inserted into pRL-TK and pEGFP-C1 to generate a reporter system (rev-miR223-pRL-TK and rev-miR-223-pEGFP-C1) to determine internal or external miR-223 expression in the transfected cells.
Real-time PCR
Total RNA was used to synthesize cDNA by reverse transcription using SuperScript II (Invitrogen). Real-time PCR was performed using an ABI PRISM 7500 real-time PCR system (Applied Biosystems, Foster City, CA, USA) and the SYBR® Premix Ex Taq™ kit (TaKaRa Biotechnology (Dalian) Co., China). The following primers were used for real-time PCR: γ-globin FW (5′-GCAGCTTGTCACAGTGCAGTTC-3′), γ-globin RW (5′-TGGCAAGAAGGTGCTGACTTC-3′); LMO2 FW (5′-CGCTACTTCCTGAAGGCCATCG-3′), LMO2 RW (5′-CACAGGATGCGCAGAGACCG-3′); GAPDH FW (5′-TCAACGACCACTTTGTCAAGCTCA-3′), GAPDH RW (5′-GCTGGTGGTCCAGGGGTCTTACT-3′). Comparative real-time PCR was performed in triplicate and the expression level of each mRNA was normalized to GAPDH mRNA. Relative expression was calculated by using the CT method.
Real-time quantification of miRNAs by stem-loop RT-PCR
Real-time PCR for miR-223 was executed as described previously [15]. Specifically, reverse transcription reaction contained a combination of RT primers including oligo dT and miR-223 stem-loop primer (5′-GTCGTATCCAGTGCAGGGTCCGAGGTATTCGCACTGGATACGACGGGGTA-3′) with total RNA from K562 cells or each of the four stable transfectant pools. Reversed miR-223 was amplified with the following primers: miR-223 FW (5′-TGTCGTGTCAGTTTGTCAAATAC-3′) and miR-223 RW (5′-GTGCAGGGTCCGAGGTATTC-3′). GAPDH mRNA was used as an internal control in the system and miR-223 expression was relatively quantified using CT method [16].
Western blotting
Total cell extracts were fractionated by electrophoresis on 12% SDS polyacrylamide gels. Proteins were transfered to polyvinylidene difluoride membranes (Amersham, Buckinghamshire, UK), and the membranes were incubated with anti-LMO2 antibody (Abnova, Taipei, Taiwan). Immunoreactivity was determined using the ECL method (Amersham).
Results
MiR-223 expression in human haematopoietic tissues and cells
MiR-223 expression was detected in human adult tissues by PAGE-Northern analysis. Intense hybridization was detected in haematopoietic tissues including lymph node and bone marrow and in a non-haematopoietic tissue liver. Barely detectable levels were observed in non-haematopoietic tissues including muscle, lung, brain, heart, prostate, testis, ovary and stomach (Fig. 1A).
Figure 1.
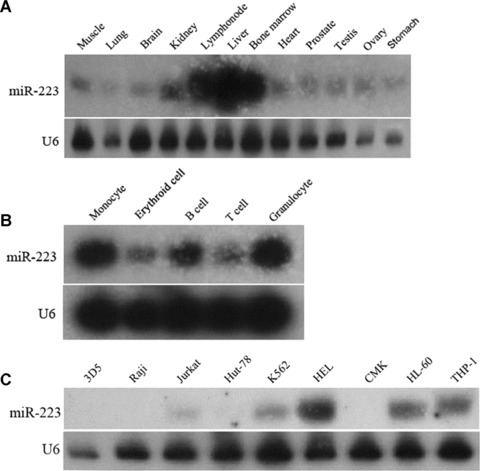
Detection of miR-223 expression in various tissues and cells by Northern blot analysis. (A) miR-223 expression in human adult tissues. Northern blot analysis was performed for miR-223 detection using total RNA from muscle, lung, brain, kidney, lymph node, liver, bone marrow, heart, prostate, testis, ovary and stomach. (B) miR-223 expression in normal human haematopoietic lineages. Northern blot analysis was performed for miR-223 detection using total RNA from highly purified monocytes, erythroid cells, B cells, T cells and granulocytes derived from umbilical cord blood (UCB) samples. (C) miR-223 expression in leukaemia cell lines. Northern blot analysis was performed for miR-223 detection using total RNA from two leukaemia cell lines with B-cell phenotype (3D5, Raji), two with T-cell phenotype (Jurkat, Hut-78), two with erythroid origin (K562, HEL), one with megakaryocytic origin (CMK), one with myeloid origin (HL-60) and one with monocytic origin (THP-1).
To obtain pure human haematopoietic lineages from human cord blood, magnetic activated cell sorting (MACS) was performed to isolate B cells (CD19+CD64−), T cells (CD3+CD64−), erythroid cells (CD71+CD64−), granulocytes (CD13+CD64−) and monocytes (CD14+CD64+). Each of five populations was shown to be highly purified (90−95%) by fluorescence activated cell sorting (FACS) assay with coordinately labelled antibodies (data not shown). Total RNA from the highly purified cells was used for Northern blot analysis to detect miR-223 expression. MiR-223 was mainly accumulated in myeloid cells, which was similar to the published data [17]. However, our results on lymphocyte populations were inconsistent with Ramkissoon’s, which may be due to the different source of blood cells. Besides, miR-223 expression was also detected in erythroid cells in our study (Fig. 1B).
MiR-223 expression was also detected in established human leukaemia cell lines (Fig. 1C). MiR-223 was highly expressed not only in HL-60 and THP-1 cell lines of myeloid origin but also in K562 and HEL cell lines of erythroid origin. There was no detectable signal in the two cell lines of B cell origin (3D5 and Raji), the two cell lines of T cell origin (Jurkat and Hut-78), or the one cell line of megakaryocytic origin (CMK).
The miR-223 expression in erythroid cells, K562 and HEL cells deserved our interests.
Effect of haemin and PMA on miR-223 expression in K562 cells
Erythroid differentiation of K562 cells was stimulated by 40 μM haemin. MiR-223 expression was assessed by miRNA real-time PCR. MiR-223 expression was slightly down-regulated after haemin treatment. Similarly, megakaryocytic differentiation of K562 cells was induced by 5 ng/ml PMA. Up-regulation of miR-223 expression was observed after PMA treatment (Fig. 2). These results suggested that miR-223 might be associated with regulation of erythroid and megakaryocytic differentiation in K562 cells.
Figure 2.
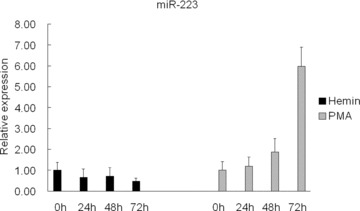
Change of miR-223 expression in K562 cells after haemin induction or PMA induction. Total RNA was extracted from K562 cells that were un-treated, or treated with 40 μM haemin or 5 ng/ml PMA for 24 hrs, 48 hrs and 72 hrs. Comparative miRNA real-time PCR was performed in triplicated. MiR-223 expression levels were normalized to GAPDH mRNA levels. Error bars represent one standard deviation.
The enforced expression of miR-223 suppressed erythroid differentiation of K562 cells
To investigate the role of miR-223 in the erythroid differentiation of K562 cells, we transfected K562 cells with the oligonucleotides pre-miR-223 (miR-223 precursor) and anti-miR-223 (miR-223 inhibitor) and determined the number of benzidine positive cells. No significant change in the percentage of benzidine positive cells was detected in K562 cells transfected with pre-miR-223 and anti-miR-223 before haemin stimulation (Fig. 3). After treatment with haemin for 24, 48 and 72 hrs a significantly lower percentage of benzidine-positive cells was observed in K562 cells transfected with pre-miR-223 compared with the percentage in control K562 cells. Concurrently, a significantly higher percentage of benzidine-positive cells were observed in K562 cells transfected with anti-miR-223 compared with the percentage in control K562 cells. These results indicate that the overexpression of miR-223 inhibited the erythroid differentiation of K562 cells, whereas suppression of miR-223 expression increases erythroid differentiation.
Figure 3.
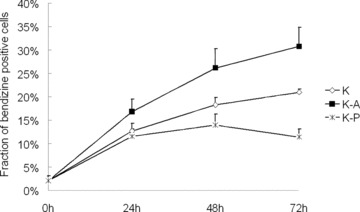
Effect of pre-miR-223 (miR-223 precursor) and anti-miR-223 (miR-223 inhibitor) on erythroid differentiation of K562 cells. K562 cells were transfected with pcDNA3.1 (K), pre-miR-223 (K-P) or anti-miR-223 (K-A) following haemin treatment and the fraction of benzidine positive cells was determined by benzidine cytochemical test. Error bars represent the standard deviation and were obtained from three independent experiments.
To further examine the role of miR-223 in erythroid differentiation of K562 cells, we constructed a recombinant expression plasmid (pcDNA3.1-pri-miR-223) in which the transcription of pri-miR-223 was driven by the CMV promoter. K562 cells were transfected with pcDNA3.1-pri-miR-223 and the empty vector (pcDNA3.1) respectively and six stable transfectant pools were collected. The pools collected were pcDNA3.1/K562-1 (K-1), pcDNA3.1/K562-2 (K-2), pcDNA3.1-pri-miR-223/K562-1 (K-223-1), pcDNA3.1-pri-miR-223/K562-2 (K-223-2), pcDNA3.1-pri-miR-223/K562-3 (K-223-3) and pcDNA3.1-pri-miR-223/K562-4 (K-223-4). MiR-223 expression in the stable transfectant pools was determined using modified miRNA real-time PCR. MiR-223 levels were more twice as high in all four stable transfectants pcDNA3.1-pri-miR-223/K562 (K-223-1, K-223-2, K-223-3 and K-223-4) than in the stable transfectant pcDNA3.1/K562 (K, a combination of K-1 and K-2) (Fig. 4A).
Figure 4.
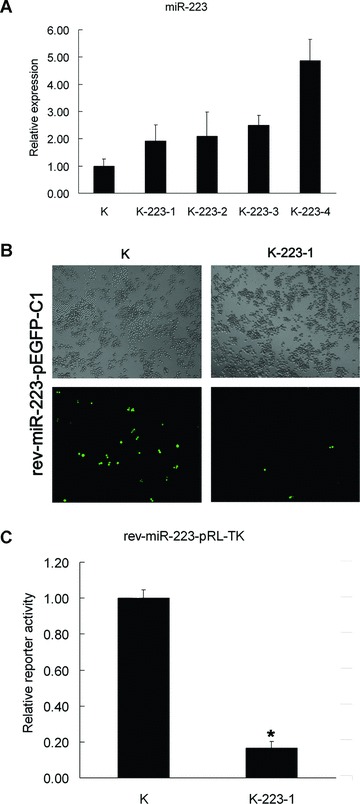
Overexpression of miR-223 in stable transfectants. (A) miR-223 expression in stable transfectants analysed by miRNA real-time PCR. Comparative miRNA real-time PCR was performed in triplicate and expression level was normalized to GAPDH mRNA. K represents the stable transfectant pcDNA3.1/K562 (a combination of two stable transfectant pools pcDNA3.1/K562-1 and -2). K-223-1, 2, 3, 4 represent stable transfectant pools pcDNA3.1-pri-miR-223/K562-1, 2, 3, 4, respectively. Error bars represent one standard deviation and were obtained from three independent experiments. (B) Fluorescence expression of the miR-223 reporter (rev-miR-223-pEGFP-C1) in pcDNA3.1/K562 cells (K) and pcDNA3.1-pri-miR-223/K562-1 (K223-1) cells transfected transiently with rev-miR-223-pEGFP-C1. The images presented here are phase contrast images and fluorescence images of the same fields (magnification 100×). (C) The relative luciferase activity of the miR-223 reporter (rev-miR-223-pRL-TK) in pcDNA3.1/K562 cells (K) and pcDNA3.1-pri-miR-223/K562-1 (K223-1) cells transfected transiently with rev-miR-223-pRL-TK. Comparative renilla luciferase (pRL-TK) activity assay was performed in triplicate and normalized to firefly (pGL-3). Error bars represent one standard deviation. *, P < 0.01.
MiR-223 overexpression was also demonstrated with the miR-223 reporters rev-miR-223-pEGFP-C1 and rev-miR223-pRL-TK. Both fluorescence expression and relative luciferase activity exhibited significant decreases in pcDNA3.1-pri-miR-223/K562-1 (K-223-1) cells transiently transfected with rev-miR-223-pEGFP-C1 and rev-miR-223-pRL-TK, respectively. These results confirmed the overexpression of miR-223 in the stable transfectants pcDNA3.1-pri-miR-223/K562 (Fig. 4B and C).
To assess the influence of enforced expression of miR-223 on erythroid differentiation, the number of benzidine-positive cells was determined after 0, 24, 48, 72 and 96 hrs of haemin treatment of pcDNA3.1/K562 and pcDNA3.1-pri-miR-223/K562 cells. A gradual and significant increase in the percentage of benzidine-positive cells was observed in pcDNA3.1/K562 cells with haemin treatment. In contrast, only slight, insignificant increases in the four pcDNA3.1-pri-miR-223/K562 were observed (Fig. 5A). Less than 15% of cells were benzidine-positive after 96 hrs of haemin treatment.
Figure 5.
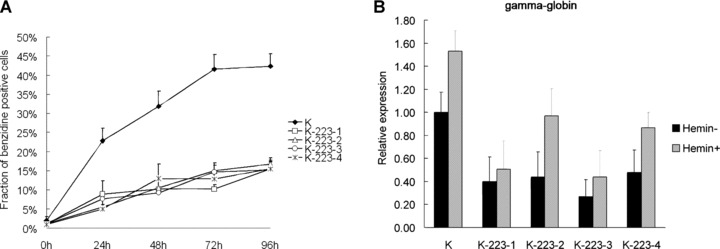
The suppressed erythroid differentiation of K562 with enforced expression of miR-223. (A) Fraction of benzidine positive cells of stable transfectants following haemin treatment. Error bars represent one standard deviation and were obtained from three independent experiments. (B) The expression of γ-globin mRNA of stable transfectants before and after haemin induction as determined by real-time PCR. Comparative real-time PCR was performed in triplicate and expression levels of miR-223 were normalized to GAPDH mRNA. K represents stable transfectant pcDNA3.1/K562. K-223-1, 2, 3, 4 represent stable transfectants pcDNA3.1-pri-miR-223/K562-1, 2, 3, 4, respectively. Haemin− and Haemin+ represent K562 cells untreated and induced with haemin for 48 hrs, respectively. Error bars represent one standard deviation.
Erythroid differentiation potentiality of the pcDNA3.1-pri-miR-223/K562 cells was also examined by real-time PCR analysis of γ-globin mRNA. The γ-globin mRNA levels were much lower in pcDNA3.1-pri-miR-223/K562 compared with those in pcDNA3.1/K562 both before and after haemin induction for 48 hrs (Fig. 5B). Similar results were also observed in pSilencer-2.1-U6-Neo-pre-miR-223/K562 (data not shown).
These results demonstrated that the enforced expression of miR-223 resulted in suppression of erythroid differentiation of K562 cells.
The enforced expression of miR-223 promoted megakaryocytic differentiation of K562 cells
In order to examine the effect of enforced expression of miR-223 on megakaryocytic differentiation of K562 cells, the pcDNA3.1/K562 and pcDNA3.1-pri-miR-223/K562 cells were cultured in medium containing 5 ng/ml PMA for 0, 36 hrs and 60 hrs, and then stained with PI. Ploidy analysis by flow cytometry showed that the peak corresponding to 4N cells increased in both pcDNA3.1/K562 and pcDNA3.1-pri-miR-223/K562 cells with PMA induction. The peaks corresponding to 4N cells and the percentage of the 4N cells for pcDNA3.1-pri-miR-223/K562 cells at both 36 hrs and 60 hrs of treatment were higher than for pcDNA3.1/K562 cells generally (Fig. 6). Similar results were also observed for pSilencer-2.1-U6-Neo-pri-miR-223/K562 cells (data not shown). These results indicated that the enforced expression of miR-223 resulted in increased megakaryocytic differentiation of K562 cells.
Figure 6.
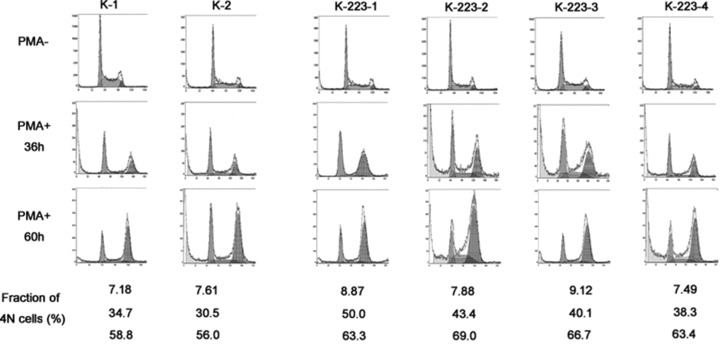
Enhanced megakaryocytic differentiation of K562 with enforced expression of miR-223. Ploidy analysis of the stable transfectants was performed before and after phorbol myristate acetate (PMA) treatment. The DNA content was measured by PI staining and flow cytometric analysis. The left peak arises from 2N cells and the right peak for 4N cells. The percentage of 4N cells is listed at the bottom. K-1, 2 represent stable transfectants pcDNA3.1/K562-1, 2, respectively. K-223-1, 2, 3, 4 represent pcDNA3.1-pri-miR-223/K562-1, 2, 3, 4, respectively. PMA− and PMA+ represent uninduced and PMA-induced K562 cells, respectively.
MiR-223 targets and regulates LMO2 expression
By using two target prediction algorithms [TARGETSCAN (http://www.targetscan.org), and MIRANDA (http://www.microrna.org)], we identified several possible target genes of miR-223. One of the identified targets is the gene encoding LMO2. LMO2 is a transcription factor that has been reported to act as a bridging molecule assembling an erythroid DNA-binding complex including TAL1, E47, GATA-1 and Ldb1/NLI proteins [18]. The putative miR-223 binding sites are conserved in several species (Fig. 7C).
Figure 7.
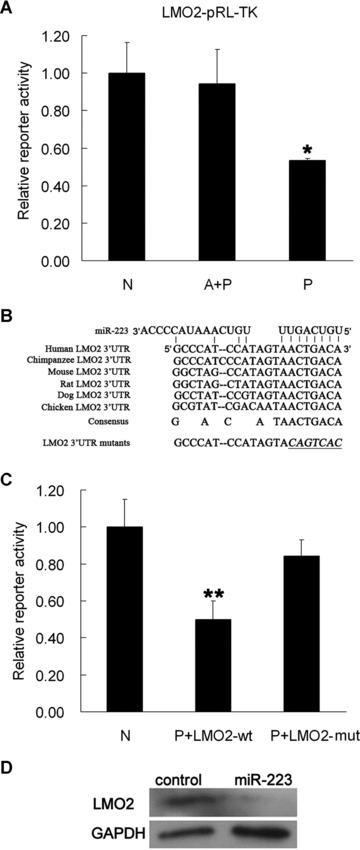
miR-223 targets LMO2 mRNA. (A) Relative luciferase activity of the LMO2 reporter (LMO2-pRL-TK) in NIH-3T3 cells treated with pre-miR-223 (miR-223 precursor) and anti-miR-223 (miR-223 inhibitor). Comparative renilla luciferase (pRL-TK) activity assay was performed in triplicated and normalized to firefly luciferase (pGL-3). Error bars represent a standard deviation and were obtained from three independent experiments. *, P < 0.05. (B) Sequence alignment between miR-223 and its putative binding site in the 3′UTR of LMO2 mRNA from different species. The sequences shown indicate the putative miR-223 target site and the mutated derivative (LMO2 3′UTR mutants). (C) Relative luciferase activity of reporter in NIH-3T3 cells treated with pre-miR-223 and LMO2 wt-pRL-TK, pre-miR-223 and LMO2 mut-pRL-TK. Error bars represent one standard deviation and were obtained from three independent experiments. **, P < 0.05. LMO2 wt represents the wild-type 3′UTR of LMO2. LMO2 mut represents the mutated derivative. (D) LMO2 protein expression in NIH-3T3 cells transfected transiently with pcDNA3.1-pri-miR-223 and pcDNA3.1. Anti-LMO2 antibody and anti-GAPDH antibody were used for Western blot analysis. Control represents NIH-3T3 cells transfected with pcDNA3.1 and miR-223 represents NIH-3T3 cells transfected with pcDNA3.1-pri-miR-223.
To demonstrate a direct interaction between the 3′-UTR of LMO2 mRNA with miR-223, we inserted the 3′-UTR region predicted to interact with this miRNA into a luciferase vector pRL-TK. A 50% reduction in relative luciferase activity was observed when NIH-3T3 cells were co-transfected with the miR-223 precursor (pre-miR-223) and the reporter plasmid containing the 3′-UTR sequence of LMO2 mRNA (LMO2-pRL-TK). However, the luciferase activity was recovered when the miR-223 inhibitor (anti-miR-223) was co-transfected into NIH-3T3 cells with the miR-223 precursor and LMO2-pRL-TK (Fig. 7A).
Additionally, we used a fluorescence vector (pEGFP-C1) to generate another reporter plasmid containing the 3′-UTR sequence of LMO2 (LMO2-pEGFP-C1). As expected, the expression of EGFP is decreased in NIH-3T3 cells cotransfected with pre-miR-223 and LMO2-pEGFP-C1. EGFP expression is the same as control levels when co-transfected with anti-miR-223 in addition to pre-miR-223 and LMO2-pEGFP-C1 (data not shown). We also tested whether the interaction between miR-223 and LMO2 mRNA was direct by mutating the miR-223 binding site. As expected, miR-223 had no effects on LMO2 mut-pRL-TK that carried the mutant miR-223 binding sites (Fig. 7B and C). Furthermore, a remarkable repression of LMO2 protein was seen in NIH-3T3 cells transiently transfected with pcDNA3.1-pri-miR-223 compared to cells transfected with pcDNA3.1 (Fig. 7D). These results indicated that miR-223 targets the 3′-UTR sequence of LMO2 mRNA in vitro.
Additionally, we examined the activity of LMO2 reporter in the stable transfectants with or without miR-223 overexpression. The LMO2-pRL-TK was transfected to two stable transfectant pools and an obvious reduced luciferase activity was detected in pcDNA3.1-pri-miR-223/K562-1 compared with that in pcDNA3.1/K562 (Fig. 8A). To confirm that the overexpression of miR-223 suppressed LMO2 expression in erythroid cells, we measured LMO2 mRNA and protein in pcDNA3.1-pri-miR-223/K562 cells by real-time PCR and Western blot analysis. LMO2 mRNA levels in pcDNA3.1-pri-miR-223/K562 cells were much lower than that in pcDNA3.1/K562 cells both before and after haemin induction (Fig. 8B), which suggests that miR-223 may increase LMO2 mRNA degradation. A reduction in LMO2 protein levels was also detected in pcDNA3.1-pri-miR-223/K562 cells compared with pcDNA3.1/K562 cells (Fig. 8C). This reduction may result from the decreased LMO2 mRNA levels.
Figure 8.
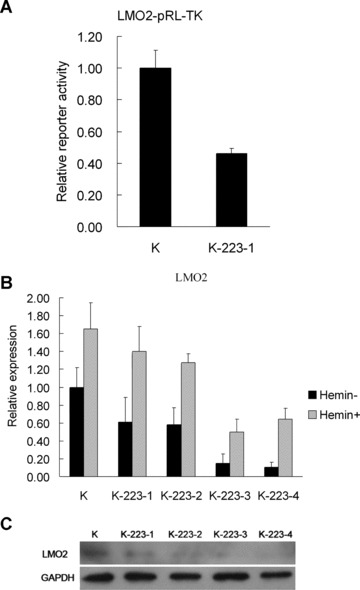
Expression of LMO2 mRNA and protein in K562 cells with enforced expression of miR-223. (A) Relative luciferase activity in stable transfectants pcDNA3.1-pri-miR-223/K562-1 (K-223-1) and pcDNA3.1/K562-1 (K) transiently transfected with LMO2 reporter (LMO2-pRL-TK). Comparative renilla luciferase (pRL-TK) activity assay was performed in triplicate and normalized to firefly luciferase (pGL-3). Error bars represent one standard deviation and were obtained from three independent experiments. *, P < 0.01. (B) The expression of LMO2 mRNA in stable transfectants with or without enforced expression of miR-223 before and after haemin induction. Comparative real-time PCR was performed in triplicate and normalized to GAPDH. K represents stable transfectant pcDNA3.1/K562. K-223-1, 2, 3, 4 represent four stable transfectants pcDNA3.1-pri-miR-223/K562-1, 2, 3, 4, respectively. Error bars represent one standard deviation. (C) LMO2 protein expression in K562 stable transfectants with or without forced expression of miR-223. Total protein was analysed by Western blot and anti-LMO2 antibody was used. Anti-GAPDH antibody was used as a control for an indication of equal protein loading.
Discussion
Recent studies have implicated miRNAs in the differentiation of mammalian blood cell lineages. One study proposed that the genes that regulate haematopoietic differentiation are transcribed in undifferentiated haematopoietic stem-progenitor cells, but are held in check by miRNAs-mediated repression of protein translation in human haematopoiesis [19]. Although there is evidence to support the role of miR-223 in human granulocytic differentiation [11], there is nothing to exclude the possibility that miR-223 may also modulate erythroid and megakaryocytic differentiation or other haematopoietic processes by targeting several genes.
In our study, we examined the distribution of miR-223 in human tissues and haematopoietic cells. We also evaluated miR-223 expression in erythroid and megakaryocytic differentiation of K562 cells. The expression distribution of mature miR-223 in human tissues and haematopoietic cells was similar to previous studies in mice [5]. In addition, miR-223 was obviously expressed in cell lines with erythroid origin (K562 and HEL). In K562 cells, we observed that miR-223 was down-regulated in erythroid differentiation and up-regulated in megakaryocytic differentiation, indicating that miR-223 may be involved in both erythroid and megakaryocytic differentiation. Functional studies indicate that the enforced expression of miR-223 can suppress erythroid differentiation and promote megakaryocytic differentiation of K562 cells. Specifically, modification of K562 cells with pre-miR-223 via oligonucleotide transfection or stable transfection caused impaired erythroid differentiation with a decreased fraction of bendizine positive cells and γ-globin mRNA levels. In contrast, modification of K562 cells with pre-miR-223 resulted in enhanced megakaryocytic differentiation with increased numbers of 4N cells.
Bioinformatic analysis indicated that miR-223 could interact with LMO2 mRNA. The enforced expression of miR-223 in both K562 and NIH-3T3 cells caused repression of LMO2 expression with reduced LMO2 mRNA and protein levels. In K562 cells, the relative expression of the LMO2 reporter system of luciferase and fluorescence also confirmed this decrease.
Generally, miRNAs modulate haematopoietic differentiation by targeting mRNA [11]. MiRNAs can direct the RNA-induced silencing complex (RISC) to down-regulate gene expression by one of the two post-transcriptional mechanisms: mRNA cleavage or translational repression [20, 21]. The significant reduction of LMO2 mRNA levels in K562 cells overexpressing miR-223 suggested that the mRNA cleavage mechanism is involved. This decrease of LMO2 mRNA levels resulted in reduction of LMO2 protein. Our results do not rule out the possibility that miR-223 inhibit erythroid differentiation and promotes megakaryocytic differentiation by targeting other mRNAs. Neither can we exclude the possibility that other miRNAs cooperate with miR-223 to block LMO2 expression.
Our results suggested that decreased miR-223 level may result in increased LMO2 expression, thereby promoting erythroid differentiation, whereas increased miR-223 levels may block LMO2 expression, thereby promoting megakaryocytic differentiation in K562 cells with a bilineage (erythroid-MK) differentiation potential. This is consistent with results from a study of in vitro megakaryocytic culture from UCB where miR-223 was continuously up-regulated [7]. Although early erythroid and megakaryocytic cells arise from a common erythroid and megakaryocytic progenitor (MEP) lineages, the late maturation of erythroid and megakaryocytic cells may be through different pathways at least from the fact that miR-223 plays opposite role in erythroid and megakaryocytic differentiation of K562 cells [22].
In conclusion, our findings indicate that miR-223 plays different roles in erythroid and megakaryocytic differentiation by targeting lineage transcription factors, suggesting that miR-223 and other miRNAs may play multiple roles in haematopoietic differentiation.
Acknowledgments
This work was supported by the National Nature Science Foundation of China (No. 30570389 and No. 30721063) and National Basic Research Program of China (No. 2007CB946902).
References
- 1.Bellantuono I. Haemopoietic stem cells. Int J Biochem Cell Biol. 2004;36:607–20. doi: 10.1016/j.biocel.2003.10.008. [DOI] [PubMed] [Google Scholar]
- 2.Georgopoulos K. Haematopoietic cell-fate decisions, chromatin regulation and ikaros. Nat Rev Immunol. 2002;2:162–74. doi: 10.1038/nri747. [DOI] [PubMed] [Google Scholar]
- 3.Fabbri M, Garzon R, Andreeff M, et al. MicroRNAs and noncoding RNAs in hematological malignancies: molecular, clinical and therapeutic implications. Leukemia. 2008;22:1095–105. doi: 10.1038/leu.2008.30. [DOI] [PubMed] [Google Scholar]
- 4.Wang XS, Zhang JW. The microRNAs involved in human myeloid differentiation and myelogenous/myeloblastic leukemia. J Cell Mol Med. 2008;12:1445–55. doi: 10.1111/j.1582-4934.2008.00386.x. [DOI] [PMC free article] [PubMed] [Google Scholar]
- 5.Chen CZ, Li L, Lodish HF, et al. MicroRNAs modulate hematopoietic lineage differentiation. Science. 2004;303:83–6. doi: 10.1126/science.1091903. [DOI] [PubMed] [Google Scholar]
- 6.Felli N, Fontana L, Pelosi E, et al. MicroRNAs 221 and 222 inhibit normal erythropoiesis and erythroleukemic cell growth via kit receptor down-modulation. Proc Natl Acad Sci USA. 2005;102:18081–6. doi: 10.1073/pnas.0506216102. [DOI] [PMC free article] [PubMed] [Google Scholar]
- 7.Garzon R, Pichiorri F, Palumbo T, et al. MicroRNA fingerprints during human megakaryocytopoiesis. Proc Natl Acad Sci USA. 2006;103:5078–83. doi: 10.1073/pnas.0600587103. [DOI] [PMC free article] [PubMed] [Google Scholar]
- 8.Calin GA, Dumitru CD, Shimizu M, et al. Frequent deletions and down-regulation of micro-RNA genes miR15 and miR16 at 13q14 in chronic lymphocytic leukemia. Proc Natl Acad Sci USA. 2002;99:15524–9. doi: 10.1073/pnas.242606799. [DOI] [PMC free article] [PubMed] [Google Scholar]
- 9.Metzler M, Wilda M, Busch K, et al. High expression of precursor microRNA-155/BIC RNA in children with Burkitt lymphoma. Genes Chromosomes Cancer. 2004;39:167–9. doi: 10.1002/gcc.10316. [DOI] [PubMed] [Google Scholar]
- 10.He L, Thomson JM, Hemann MT, et al. A microRNA polycistron as a potential human oncogene. Nature. 2005;435:828–33. doi: 10.1038/nature03552. [DOI] [PMC free article] [PubMed] [Google Scholar]
- 11.Fazi F, Rosa A, Fatica A, et al. A minicircuitry comprised of microRNA-223 and transcription factors NFI-A and C/EBPα regulates human granulopoiesis. Cell. 2005;123:819–31. doi: 10.1016/j.cell.2005.09.023. [DOI] [PubMed] [Google Scholar]
- 12.Johnnidis JB, Harris MH, Wheeler RT, et al. Regulation of progenitor cell proliferation and granulocyte function by microRNA-223. Nature. 2008;451:1125–9. doi: 10.1038/nature06607. [DOI] [PubMed] [Google Scholar]
- 13.Delgado MD, Quincoces AF, Gómez-Casares MT, et al. Differential expression of ras protooncogenes during in vitro differentiation of human erythroleukemia cells. Cancer Res. 1992;52:5979–84. [PubMed] [Google Scholar]
- 14.Rubin CI, French DL, Atweh GF. Stathmin expression and megakaryocyte differentiation: a potential role in polyploidy. Exp Hematol. 2003;31:389–97. doi: 10.1016/s0301-472x(03)00043-2. [DOI] [PubMed] [Google Scholar]
- 15.Chen C, Ridzon DA, Broomer AJ, et al. Real-time quantification of microRNAs by stem-loop RT-PCR. Nucleic Acids Res. 2005;33:e179. doi: 10.1093/nar/gni178. [DOI] [PMC free article] [PubMed] [Google Scholar]
- 16.Winer J, Jung CK, Shackel I, et al. Development and validation of real-time quantitative reverse transcriptase-polymerase chain reaction for monitoring gene expression in cardiac myocytes in vitro. Anal Biochem. 1999;270:41–9. doi: 10.1006/abio.1999.4085. [DOI] [PubMed] [Google Scholar]
- 17.Ramkissoon SH, Mainwaring LA, Ogasawara Y, et al. Hematopoietic-specific microRNA expression in human cells. Leuk Res. 2006;30:643–7. doi: 10.1016/j.leukres.2005.09.001. [DOI] [PubMed] [Google Scholar]
- 18.Wadman IA, Osada H, Grutz GG, et al. The LIM-only protein Lmo2 is a bridging molecule assembling an erythroid, DNA-binding complex which includes the TAL1, E47, GATA-1 and Ldb1/NLI proteins. EMBO J. 1997;16:3145–57. doi: 10.1093/emboj/16.11.3145. [DOI] [PMC free article] [PubMed] [Google Scholar]
- 19.Georgantas RW, Hildreth R, Morisot S, et al. CD34+ hematopoietic stem-progenitor cell microRNA expression and function: a circuit diagram of differentiation control. Proc Natl Acad Sci USA. 2007;104:2750–5. doi: 10.1073/pnas.0610983104. [DOI] [PMC free article] [PubMed] [Google Scholar]
- 20.Hutvagner G, Zamore PD. A microRNA in a multiple-turnover RNAi enzyme complex. Science. 2002;297:2056–60. doi: 10.1126/science.1073827. [DOI] [PubMed] [Google Scholar]
- 21.Petersen CP, Bordeleau ME, Pelletier J, et al. Short RNAs repress translation after initiation in mammalian cells. Mol Cell. 2006;21:533–42. doi: 10.1016/j.molcel.2006.01.031. [DOI] [PubMed] [Google Scholar]
- 22.Cantor AB, Orkin SH. Transcriptional regulation of erythropoiesis: an affair involving multiple partners. Oncogene. 2002;21:3368–76. doi: 10.1038/sj.onc.1205326. [DOI] [PubMed] [Google Scholar]