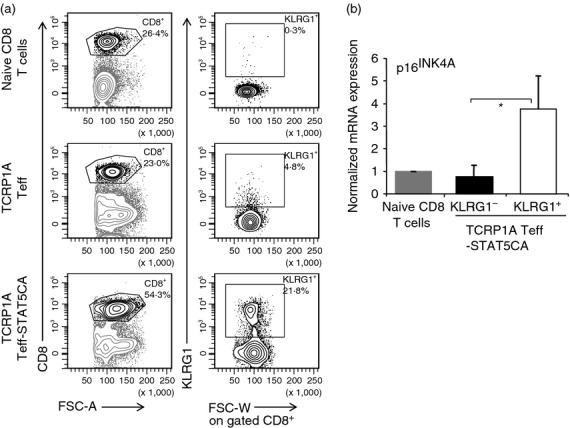
Figure 3.

TCRP1A STAT5-expressing effector T cells (Teff-STAT5CA) contain a population of KLRG1-high (KLRG1hi) cells with senescent features. (a, b) TCRP1A Teff cells or Teff-STAT5CA were injected in Rag-1−/− B10.D2 mice and analysed at day 25. Naive CD8 T cells are included as control. (a) The representation of the transferred CD8 T cells in the spleen is shown in dot plots of CD8 expression versus FSC-A (left dot plots). KLRG1 expression versus FSC-W among gated CD8+ T cells is shown (right dot plots) and the % of KLRG1+ cells is reported. (b) TCRP1A Teff-STAT5CA were sorted on the basis of surface expression in KLRG1low and KLRG1hi subsets. Naive TCRP1A T cells were included as control. For all cell types, p16INK4A transcripts were measured by quantitative RT-PCR. Ratios of 2−ΔCt values normalized to that of CD8 naive T cells are shown. The mean ± SD of three independent experiments done in duplicates is reported.
