

Abstract
Objective
Migraine is one of the most common and debilitating neurological conditions. Familial hemiplegic migraine type 1 (FHM1), a monogenic migraine subtype, is caused by gain-of-function of voltage-gated CaV2.1 calcium channels. FHM1 mice carry human pathogenic mutations in the α1A subunit of CaV2.1 channels and are highly susceptible to cortical spreading depression (CSD), the electrophysiologic event underlying migraine aura. To date, however, the mechanism underlying increased CSD/migraine susceptibility remains unclear.
Methods
We employed in vivo multiphoton microscopy of the genetically encoded Ca2+-indicator yellow cameleon to investigate synaptic morphology and [Ca2+]i in FHM1 mice. In order to study CSD-induced cerebral oligemia, we used in vivo laser speckle flowmetry and multimodal imaging. With electrophysiologic recordings we investigated the effect of the CaV2.1 gating modifier tert-butyl dihydroquinone on CSD in vivo.
Results
FHM1 mutations elevate neuronal [Ca2+]i and alter synaptic morphology as a mechanism for enhanced CSD susceptibility that we were able to normalize with a CaV2.1 gating modifier, in hyperexcitable FHM1 mice. At the synaptic level, axonal boutons were larger, and dendritic spines were predominantly mushroom type, which both provide a structural correlate for enhanced neuronal excitability. Resting neuronal [Ca2+]i was elevated in FHM1, with loss of compartmentalization between synapses and neuronal shafts. The percentage of calcium-overloaded neurons was increased. Neuronal [Ca2+]i surge during CSD was faster and larger, and post-CSD oligemia and hemoglobin desaturation were more severe in FHM1 brains.
Interpretation
Our findings provide a mechanism for enhanced CSD susceptibility in hemiplegic migraine. Abnormal synaptic Ca2+ homeostasis and morphology may contribute to chronic neurodegenerative changes as well as enhanced vulnerability to ischemia in migraineurs.
Introduction
Migraine is the most common neurological condition with a prevalence of ∼15%1. Migraine is the largest contributor to global burden of neurological disabilities2. Neuronal network hyperexcitability and enhanced glutamate release have been implicated in the pathogenesis of common forms of migraine, as well as in familial hemiplegic migraine (FHM) 3,4. FHM is considered a useful model for common migraine because it shares clinical features and trigger factors 5,6.
One reflection of cortical hyperexcitability in transgenic FHM mouse models that carry patient mutations is increased susceptibility to cortical spreading depression (CSD) 7-11. CSD is an intense wave of neuronal and glial depolarization slowly propagating in cortical and subcortical gray matter, and the electrophysiologic substrate for migraine aura as well as a presumed trigger for headache 12,13. FHM1 mutant mice display mutation-specific features in response to CSD, such as transient hemiplegic symptoms. Specific for the S218L mutation is a particularly severe clinical syndrome with cerebellar ataxia, seizures, prolonged coma, and edema after mild head trauma 7,8,14; some of the features are well captured in mutant mice 6,15.
FHM type 1 (FHM1) is caused by specific missense mutations in the CACNA1A gene, which encodes the pore-forming α1A subunit of voltage-gated CaV2.1 (P/Q-type) Ca2+ channels 14. CaV2.1 channels are key regulators of excitatory neurotransmitter release in the cerebral cortex 16,17. Expression of FHM1 mutant CaV2.1 channels in heterologous systems, and ex vivo examination of transgenic brain tissue preparations, have revealed a gain-of-function phenotype 8,9,18-20. Mutant CaV2.1 channels open upon smaller membrane depolarizations and stay open longer with enhanced single channel open probability and increased CaV2.1 current density over a wide range of membrane potentials 6,7,18,19. The resulting increase in presynaptic Ca2+ influx is believed to be the mechanism for increased probability of glutamate release as observed in cortical slices from FHM1 mice 11. In vitro studies do not faithfully reproduce the native environment in which the channels are expressed, which is due to variations in isoforms occurring from alternative splicing and/or β subunit expression, that can profoundly alter the biophysical properties of CaV2.1 and the channel phenotype 21-23. The impact of FHM1 gain-of-function mutations on neuronal Ca2+ homeostasis, synaptic morphology, cerebral blood flow and metabolism, therefore, has to be examined in vivo.
We tested the hypothesis that FHM1 mutations elevate resting and activated neuronal Ca2+ and alter synaptic morphology. We employed in vivo multiphoton microscopy following neuronal infection with the genetically encoded ratiometric Ca2+-indicator yellow cameleon YC3.6 24. We directly measured axonal and dendritic intracellular Ca2+ concentrations ([Ca2+]i) in the somatosensory cortex of FHM1 mutant mice expressing the human pathogenic S218L mutation. Because [Ca2+]i regulates neuronal morphology 25, we also studied axonal and dendritic morphology in the same brain. Our data show a marked elevation in neuronal [Ca2+]i both at rest and during CSD, and synaptic structural changes that may explain the cortical hyperexcitability, enhanced CSD susceptibility and neurodegeneration phenotypes in FHM1 26-29
Materials and Methods
Experimental animals
All experimental procedures were carried out in accordance with the Guide for Care and Use of Laboratory Animals (NIH Publication No. 85-23, 1996), and were approved by the institutional review board (MGH Subcommittee on Research Animal Care, SRAC). A total of 64 mice were used (38 for multiphoton imaging, 13 for multimodal optical imaging, and 13 for electrophysiological recordings). Transgenic knock-in Cacna1a mice heterozygous (HET) for S218L or homozygous (HOM) for R192Q FHM1 mutations were generated by a gene targeting approach on an equal mixed background of 129/Ola and C57Bl/6J 8,9. S218L mutants were compared with age-matched wild type (WT) littermates. R192Q mutants were compared with C57Bl/6J mice, on which the mutants were backcrossed for more than 10 generations, except for control experiments with gating modifier tert-butyl dihydroquinone (BHQ) 10 C57BL/6J mice were used that were purchased from Charles River. Because CSD susceptibility is higher in young adult female mice7, only females were studied between 2-6 months of age. All experiments were performed in the S218L mutant, except for electrophysiological recordings, where we used R192Q HOM; CSD susceptibility of this mutant genotype is similar to that of female S218L HET 7. Experiments were carried out with the investigators blinded, and confirmatory genotyping was done.
Viral vector construction and production
The YC3.6 cDNA was cloned within an AAV2 backbone, under a hybrid cytomegalovirus (CMV) immediate-early enhancer/chicken β-actin promoter/exon1/intron and before the woodchuck hepatitis virus posttranscriptional regulatory element (WPRE). High titers of AAV serotype 2 and 8 were produced using the triple transfection protocol by both the Harvard and University of Pennsylvania Vector Cores. Virus was titered using quantitative PCR and final concentrations of these AAV2 stocks reached 4.1×10¹² viral genomes/mL.
Expression of the [Ca2+]i indicator and cranial window surgery
We unilaterally injected 4 μL of the virus construct pAAV-CBA-YC3.6-WPRE (4.2×10¹² viral genomes/mL, serotype2, CBA promoter) using a Hamilton syringe (0.2 μL/min) targeting layer V neurons in the somatosensory cortex (1 mm lateral, 1 mm posterior to bregma, 1.2 mm deep), as previously described 24,30 (Figure 1). These cells send dendrites and apical tufts into layers 2/3 that were imaged. After injection, we sutured the skin, and allowed the mouse to recover. One month after intracortical injection, mice were anesthetized with isoflurane (1-1.5%). A circular midline cranial window (6 mm diameter) was implanted by removing a piece of skull and replacing it with a glass coverslip (8 mm diameter). The coverslip, soaked in saline, was applied to the surface of the brain and the cranial window was sealed with dental cement mixed with Krazy glue as previously described 31. For imaging, a warm paraffin wax ring was built along the border of the window to create a well of water for the dipping objective. A burr hole was drilled on each hemisphere at the lateral aspect of the occipital bone for CSD induction. Normal systemic physiological parameters were confirmed under simulated multiphoton imaging conditions in a separate group of mice (not shown).
Figure 1. Experimental protocols and timeline.
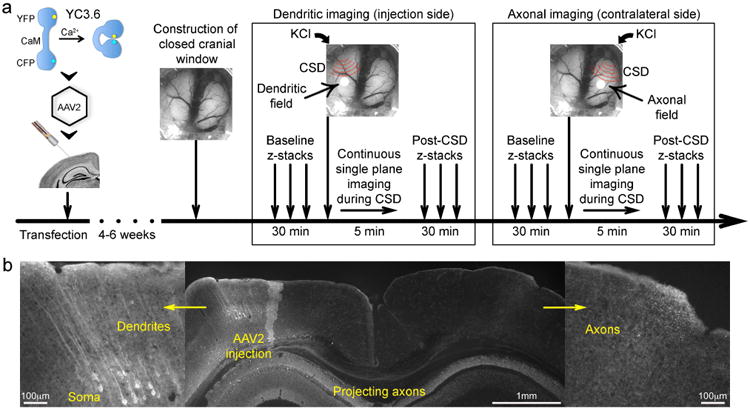
a) After introducing the Ca2+ indicator yellow cameleon (YC3.6) into the neurotropic vector adeno-associated virus 2 (AAV2), we stereotaxically injected this reporter into cortical layer 5 of the somatosensory cortex. Following a 4-6-week incubation period, a closed cranial window was constructed, together with lateral occipital burr holes for CSD induction on each hemisphere. To assess neuronal morphology and [Ca2+]i at resting state, baseline z-stacks were performed. KCl was then briefly applied on the occipital burr hole, and continuous single plane imaging was performed at a fixed depth of 30-40 μm to image changes during CSD. CSD never traversed to the contralateral hemisphere, and we induced the first CSD ipsilateral or contralateral to the injection side, in random order. To assess post-CSD recovery, z-stacks were repeated sampling the same cortical volume as baseline z-stacks. Then imaging was moved to the contralateral hemisphere and the protocol repeated. In a small subset of mice, technical problems prevented imaging of post-CSD z-stacks or continuous single plane CSD time course in both hemispheres.
b) Expression of the genetically encoded Ca2+ indicator YC3.6 was histologically confirmed in soma and dendrites ipsilateral to the injection, as well as the transcallosal axonal projection to the contralateral hemisphere after 4-6 weeks of incubation. Scale bars indicate relative size.
Multiphoton imaging
YC3.6 is a fluorescence (or Forster) resonance energy transfer (FRET)-based Ca2+-indicator with a dynamic range that covers the “normal” physiological range of neuronal [Ca2+]i30. A ratio of the YFP to CFP fluorescence indicates the degree of FRET and therefore the concentration of intracellular Ca2+, independent of YC3.6 concentration. A ratiometric dye is particularly useful for homeostatic Ca2+measurements, because a normalized ratio value is equivalent to Ca2+concentration and is comparable across neurons and animals. YC3.6 was injected into cortical layer 5 and allowed the imaging of Ca2+-levels in the processes of these neurons. YC3.6 fills the different cellular compartments including the soma, neuronal processes and synaptic elements (Movie 1), enabling us to measure absolute [Ca2+]i in dendritic and axonal compartments and to assess neuronal morphology with fast, robust and reproducible response kinetics 24.
YC3.6 is expressed in neurons and their processes (Movie 1), enabling us to measure absolute [Ca2+]i in dendritic and axonal compartments and to assess neuronal morphology with fast, robust and reproducible response kinetics 24. Images of YC3.6-filled neuronal processes were obtained using Olympus Fluoview 1000MPE with pre-chirp optics and a fast AOM mounted on an Olympus BX61WI upright microscope. A wax ring was placed on the edges of the coverslip of the cortical window and filled with distilled water to create a well for an Olympus 20× dipping objective (numerical aperture, 0.95). A mode-locked titanium/sapphire laser (MaiTai; Spectra-Physics, Fremont, CA) generated multiphoton fluorescence with 860 nm excitation, and detectors containing three photomultiplier tubes (Hamamatsu, Ichinocho, Japan) collected emitted light in the range of 380–480, 500–540, and 560–650 nm 32. The average power measured at the back aperture ranged from 20–60 mW. We carefully monitored for phototoxicity and did not observe any gradual and lasting upward drift in [Ca2+]i during CSD time course and repetitive z-stack imaging.
Experimental timeline
A typical experimental timeline is shown in Figure 1a. We imaged the infected hemisphere to assess the dendrites, and contralateral hemisphere to assess projecting axons of the same neuronal population, in random order. On each hemisphere, we first performed a low-magnification z-stack (600×600μm field of view) for initial orientation and screening for labeled processes. We then obtained higher magnification z-stacks (ranging from 150×150 to 90×90μm) at resting state, starting from the pial surface to a depth of 70 to 200μm (1 μm step size). Importantly, resting state [Ca2+]i values obtained from baseline z-stack remained stable upon repeated z-stacks (not shown). After baseline imaging, we induced a CSD by briefly applying a 1mm diameter cotton ball soaked in 300mM KCl to the occipital burr hole followed by careful saline wash. We continuously imaged the passage of the CSD wave for 5 minutes in single 1 μm-thick slice at a depth of 30-40 μm, with a field of view ranging from 600×600 to 90×90 μm (1.1 frames per second). The frame rate of 1.1Hz was translated into time as 0.91 sec/frame and plotted and expressed as such in all figures and tables. CSD was triggered ipsilateral or contralateral to the site of injection, in random order. We measured the time to peak, the slope of initial rise and the duration at half-maximal amplitude of the increase in [Ca2+]i during SD. We also calculated the propagation speed of the wave based on the distance the wave front propagated on each frame during dendritic time course imaging. We measured the duration of dendritic beading (i.e., loss of dendritic shaft continuity), and the density and size of beads at maximum beading. We repeated the z-stacks of the same cortical volume on the dendritic side to investigate long-lasting post-CSD changes at 6±1 min, 13±4 min and 24±10 min after the CSD in a subset of mice. CSDs never traversed to the contralateral hemisphere as monitored by laser speckle imaging.
[Ca2+]i analysis
Three-dimensional image stacks and two-dimensional time course movies were processed using ImageJ software. For both CFP and YFP channels (emitted light collected at 420–460, 495–540nm, respectively), the background, determined from the mode at the last slice of each volume or the mode of the single slice imaged in the time courses, was subtracted. A median filter with radius 2 was applied to every image before dividing the emitted fluorescence intensity of YFP by CFP, thus creating a ratio-image. We sampled neuritic area (axonal shafts, boutons, dendritic shafts, spines) using visual identification and structure tracing. Regions of interest (ROI) were selected within the YFP images either manually using the ‘free-hand’ tool or by adjusting the threshold tool of the software and using the wand tool for selection on structures that were present in all frames during the time course, despite the CSD-induced swelling and motion. The researchers selecting the ROIs were blinded to the genotype and the time point of imaging with respect to onset of CSD. The majority of neuronal structures were selected in a given field regardless of their YFP intensities. CFP and YFP intensities were measured at the chosen ROIs in all frames. For the frames in which a shift occurred the ROIs were manually moved to fit the actual outlined structures. Selected regions of interest were then placed on the ratio images to extract the YFP/CFP measurements. Ratios were converted to [Ca2+]i using the in situ Kd (278 nM) and Hill coefficient (n, 1.1) with standard ratiometric equation 33:
For min and max [Ca2+]i values, we used the average of lowest and highest 0.5% of all structures (Rmin=0.23, Rmax=2.19). Pseudocolored images were created in Matlab based on the indicator ratio, which was then converted to calcium concentration using the empirical Rmin and Rmax and assigned to the jet colormap. We used the ratio values to supply the Hue and Saturation (color) and the YFP image to supply the Value (intensity). Resting state [Ca2+]i overload was defined as [Ca2+]i above 95th percentile of respective structure in WT, analogous to what has been reported previously 24. Animals were excluded if high-frequency oscillatory motion artifacts due to improper head fixation were observed that did not allow visualizing clear borders of neuronal structures (n= 3 mice).
Structural analysis
For structural analysis, axons and varicosities were manually traced on maximum intensity z-stack projections to assess the diameter and density of varicosities (number of boutons per fiber length). For dendritic spines, we used a computational approach with Neuronstudio as an integrated system for semi-automated digitization and morphometry at high resolution 34,35. The software quantifies dendritic spine density and morphology using 3D images, and obviates the need for subjective manual tracing. The algorithms have previously been validated by trained human operators on same data sets, and extensively used to study spine morphology in vivo 34,36,37. Two independent investigators carried out the morphological analyses of dendritic spines here using Neuronstudio and obtained virtually identical results. In addition, we examined structural changes during CSD, focusing on dendritic beading identified as the appearance of rounded regions extending beyond the diameter of the parent dendrite separated by “interbead” segments. Dendritic recovery was defined as the disappearance of round “beaded” regions. We compared the duration of beading, as well as the average diameter and density of dendritic beads at the time of maximum beading.
Multimodal optical imaging
Mice were anesthetized, intubated and mechanically ventilated (SAR830, CWE). Arterial blood pressure was monitored continuously, and arterial blood gas and pH every 15 minutes, via femoral artery. Mice were placed on a stereotaxic frame, scalp reflected after a midline incision, and intact skull overlying the right hemisphere was covered with a thin layer of mineral oil to prevent drying and enhance transparency. A 1 mm burr hole was drilled under saline cooling for CSD induction over the frontal cortex (2 mm anterior, 1 mm lateral from bregma). After surgical preparation, multimodal optical imaging was performed for 30 minutes using simultaneous laser speckle flowmetry (LSF) and multispectral reflectance imaging (MSRI) through intact skull, as previously described38. The final imaging field was positioned over the right hemisphere (7×6 mm). Raw speckle frames were continuously acquired at 2.5 Hz, and MSRI frames at the filter wheel rotation frequency of 1.6 Hz. The data were subsequently interpolated to the common time base using the recorded filter wheel angular positions and exposure times of both cameras. Absolute values of oxyhemoglobin (oxyHb) and deoxyhemoglobin (deoxyHb) were obtained 39. Relative cerebral blood flow (CBF), and absolute oxyHb and deoxyHb concentrations were then used to calculate hemoglobin O2 saturation, and changes in cerebral blood volume (CBV) and cerebral metabolic rate of O2 (CMRO2) 38. Absence of a mechanical CSD induced by drilling was confirmed by optical imaging. After baseline imaging for two minutes, a CSD was induced by topical application of 300 mM KCl onto the frontal burr hole. The time courses of CBF, CBV, oxyHb, deoxyHb, SatHb and CMRO2 were quantified using regions of interest (squares, 0.2 mm2) placed within the middle cerebral artery territory. In order to faithfully represent the multiphasic changes during and after a CSD, we measured the magnitudes and latencies of multiple deflection points, as described previously 38. These were then plotted over time to reconstruct the average response to a CSD.
Electrophysiological recordings
The femoral artery was catheterized for blood sampling and measurement of mean arterial pressure, and the trachea was intubated for mechanical ventilation under isoflurane anesthesia (2.5% induction, 1% maintenance, in 70% N2O/30% O2). Arterial blood gases and pH were measured every 20 min and maintained within normal limits by adjusting ventilation. Mice were placed in a stereotaxic frame and burr holes were drilled at the coordinates described previously 7. Two glass capillary microelectrodes were placed to record extracellular steady (DC) potential and electrocorticogram at a depth of 300 μm. After surgical preparation, the occipital cortex was allowed to recover for 20 minutes under saline irrigation. We tested the effect of topical treatment with the CaV2.1 gating modifier tert-butyl dihydroquinone (10μM BHQ for 30 min; Tocris) on CSD susceptibility in FHM1 and WT mice. The frequency of CSDs evoked by epidural KCl (300mM for 30 minutes) application was determined, as previously described 7. Treatment was performed on one hemisphere only, and compared to vehicle on the contralateral side, in random order.
Statistical analysis
Data were analyzed using SPSS (v11.0) and GraphPad Prism (v6.0), and presented as whisker-box plots (box, 25-75% range; whiskers min-max range; line, median; +, mean), mean ± standard error, or as individual data points. We used the general linear model (univariate analysis of variance) to assess differences in [Ca2+]i and morphology of spines, axonal boutons, and dendritic beads between genotypes and time points. To compare mean values over time according to genotypes (time course imaging of [Ca2+]i during CSD), we used the general linear model for repeated measures. For analysis of multimodal imaging, a two-way repeated measures ANOVA was used to compare the time course of each measured parameter between genotypes. Non-normally distributed data were analyzed using non-parametric tests. Statistical approach for each dataset is indicated in figure legends. “N” indicates the number of mice, while “n” displays the number of analyzed structures. P values are two-tailed, and P<0.05 was considered statistically significant.
Results
Differentiating axons versus dendrites in vivo poses substantial challenges using standard multiphoton structural imaging approaches. We developed an approach to specifically image axonal segments by injecting the vector encoding the calcium indicator YC3.6 (YC3.6-AAV) into one cortical hemisphere; after 4-6 weeks, we could reliably image dendrites ipsilateral to the injection side (Movie 1), and only axons in the contralateral hemisphere, due to strong transcallosal axonal projections. Histological analysis confirmed the presence of dendritic fluorescence ipsilateral to the injection site, whereas fluorescence in the contralateral cortex solely came from transcallosal axonal projections (Figure 1b). Therefore, we were able to differentiate dendrites and axons of the same set of labeled neurons at resting state (z-stacks), during CSD (single plane time-course), and after CSD (z-stacks).
Axonal and dendritic [Ca2+]I
At baseline, [Ca2+]i was markedly higher in FHM1 mutant mice (N=10) compared with WT (N=7) in axonal boutons and shafts (60% and 140% higher, respectively), and to a lesser extent in dendritic spines and shafts (S218L; N=10; WT: N=8; Figure 2). Mutants had a significantly larger percentage of axons (12- and 7-times higher for shafts (S218L: n=159; WT: n=90) and boutons (S218L: n=677; WT: n=249) and dendrites (10- and 4-times higher for shafts [S218L: n=298; WT: n=243] and spines [S218L: n=1030; WT: n=933]) with [Ca2+]i overload. In WT mice, average [Ca2+]i was higher in axonal boutons and dendritic spines compared with shafts, consistent with normal [Ca2+]i compartmentalization. In contrast, [Ca2+]i compartmentalization was lost in axonal boutons in FHM1 mutants. Epidural application of KCl onto the occipital cortex triggered a wave of elevated [Ca2+]i that propagated across the imaging field (Figure 3; Movies 2-7). Peak [Ca2+]i increase during CSD was markedly higher in the FHM1 mutant compared with WT in axons (N=5 each) and to a lesser extent in dendrites (S218L: N=8; WT: N=6). The rate of [Ca2+]i rise at CSD onset (i.e. slope) was also 50% higher and time to peak shorter in FHM1 mutants in both axons (by 52%) and dendrites (by 48%), consistent with faster propagation speeds (Table 1). In contrast, the duration of CSD-associated [Ca2+]i wave did not differ between the genotypes. Approximately 6±1 min after CSD onset, repeat z-stacks showed that [Ca2+]i has recovered back to pre-CSD baseline in all structures in both strains, except for WT dendritic spines, in which [Ca2+]i remained elevated by 10% (S218L: N=9; WT: N=5; Figure 4).
Figure 2. Elevated resting neuronal [Ca2+]i in FHM1 mutants.
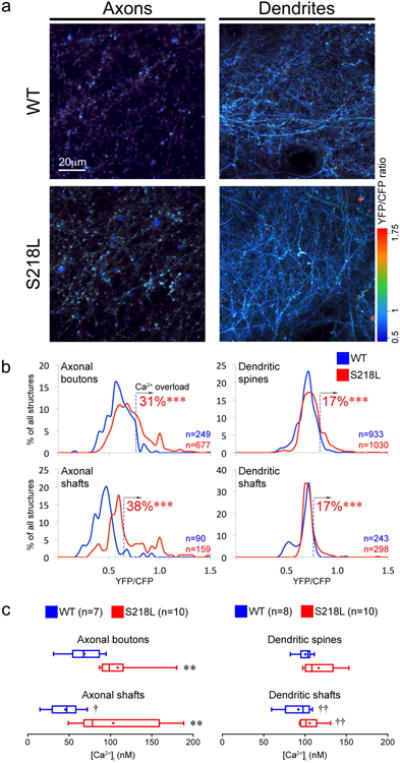
a) Representative z-projections show YFP/CFP ratio as a surrogate for [Ca2+]i in axons and dendrites of S218L and WT mice. Axons were dimmer in microscopy when labeled, because they are sparse, and smaller by a factor of 2-3 (∼300 nm) than dendritic branches. Scale bar indicates relative size.
b) Line histograms show the distribution of YFP/CFP ratios from individual structures as % of total number of structures (Axonal boutons: S218L: n=677 & WT: n=249, Axonal shafts: S218L: n=159 & WT: n=90, Dendritic spines: S218L: n=1030 & WT: n=933 and Dendritic shafts: S218L: n=298 & WT: n=243). [Ca2+]i overload was defined as YFP/CFP ratios above 95th percentile of respective neuronal structures in WT (dashed vertical lines). S218L mice exhibit a higher percentage of [Ca2+]i overloaded structures. ***p<0.001 vs. WT (χ2 test).
c) Whisker-box plots show axonal and dendritic [Ca2+]i in S218L mutant mice (N=10 each) and WT (N=7 and 8, respectively). [Ca]i was higher in S218L axons compared to WT. **p<0.01 vs. WT (Mann-Whitney test). Compartmentalization of [Ca]i in axonal boutons was lost in S218L. †p<0.05 and ††p<0.01 vs. boutons or spines (Wilcoxon matched pairs signed rank test).
Figure 3. Larger increase in neuronal [Ca2+]i during CSD in FHM1 mutants.
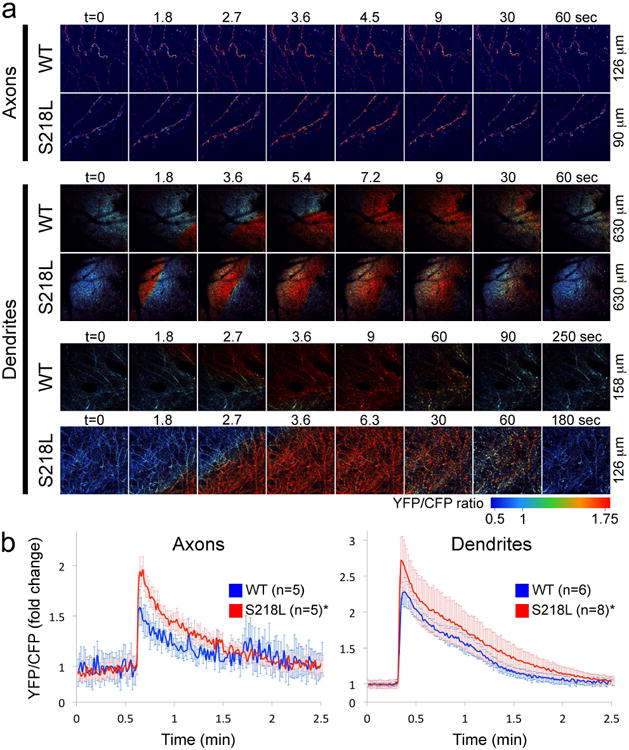
a) Epidural application of KCl onto the occipital cortex (see Figure 1a) triggered a CSD that was associated with a rapid surge in [Ca2+]i in both axons and dendrites that propagated across the imaging field as shown in these time lapse images (see Movies 2-7). Time (t) is indicated on top (t=0 is the frame before CSD emerges in the imaging field). Field dimensions are shown on the right.
b) Time course of axonal and dendritic [Ca2+]i expressed as fold-change from baseline during CSD in 218L mutant (N=5 and N=8 for axons and dendrites, respectively) and WT mice (N=5 and N=6 for axons and dendrites, respectively). [Ca]i increase during SD was faster, and peak levels were higher in S218L mice compared with WT. See Table 1 for onset slope, duration and propagation speed. *p<0.05 vs. WT (two-way ANOVA for repeated measures).
Table 1.
[Ca2+]i kinetics and structural changes during CSD in WT and FHM1 mutant mice.
| WT | S218L | ||
|---|---|---|---|
| Time to peak [Ca2+]i (sec) | Axon | 2.7±0.1 | 2.1±0.1* |
| Dendrite | 3.3±0.4 | 2.6±0.2 | |
| Maximum [Ca2+]i rise slope [(YFP/CFP)/sec) | Axon | 0.74±0.16 | 1.57±0.16* |
| Dendrite | 0.66±0.08 | 1.26±0.10* | |
| Duration of [Ca2+]i increase at half-amplitude (sec) | Axon | 18.8±1.6 | 16.4±1.4 |
| Dendrite | 41.7±7.3 | 48.7±12.9 | |
| CSD propagation speed (mm/min) | Dendrite | 3.2±0.2 | 5.7±0.3* |
| Dendritic beading | Density (/μm) | 0.20±0.02 | 0.19±0.01 |
| Size (μm) | 1.54±0.11 | 1.61±0.05 | |
| Duration (sec) | 142±17 | 135±19 |
Data are mean +/- SEM,
p<0.05.
Figure 4. Neuronal [Ca2+]i after CSD recovery.

Pre- and post-CSD [Ca2+]i values in axonal and dendritic structures of S218L (N=8-9) and WT (N=5) are shown as whisker-box plots. Only the subsets of mice with both pre- and post-CSD z-stacks are shown. [Ca]i in WT dendritic spines remained elevated after CSD compared to the resting state. *p<0.05 vs. baseline (Wilcoxon matched pairs signed rank test).
Normalization of the CaV2.1 gain-of-function with the gating modifier tert-butyl dihydroquinone (BHQ) 40 significantly reduced CSD susceptibility in FHM1 mice homozygous for the R192Q mutation. Upon topical KCl, BHQ pre-treatment reduced CSD frequency from 17±1 (vehicle, N=6) to 12±1 (N=8) per hour (p>0.001), but did not completely normalize the phenotype to WT levels. In C57BL/6J control mice, BHQ did not significantly alter the CSD frequency (9±1 vs. 10±1, BHQ and vehicle, respectively; N=5 each, p=0.34).
Axonal and dendritic morphology
Axonal and dendritic morphology differed between genotypes at resting state (Figure 5). FHM1 mutants had 25% larger axonal boutons (S218L: N=12; WT: N=8, p=0.006) and 13% more mushroom type spines (S218L: N=12; WT: N=8, p=0.016) compared with WT, suggesting stronger synapses. Bouton and spine density, and spine head diameter did not significantly differ between the genotypes. During CSD, dendrites developed rapid beading as described previously 41, whereas axons did not show discernible structural changes (Figure 6). The density and size of dendritic beads, and the duration of beading did not differ between genotypes (Table 1). When reimaged 6±1 min after CSD, axonal bouton density increased by 20% and bouton size decreased by 25-40% compared with the resting state in both strains (Axons: S218L: N=12; WT: N=6 and Dendrites: S218L: N=9; WT: N=8; Figure 7). In contrast, dendritic spine density and head diameter did not differ from pre-CSD levels in either strain. Interestingly, in WT mice only, dendritic morphology shifted from predominantly stubby spines before the CSD to thin or mushroom spines after a CSD. These changes in spine morphology persisted throughout the 30 minutes post-CSD assessment period (Figure 8).
Figure 5. Abnormal synaptic morphology in FHM1 mutants at resting state.
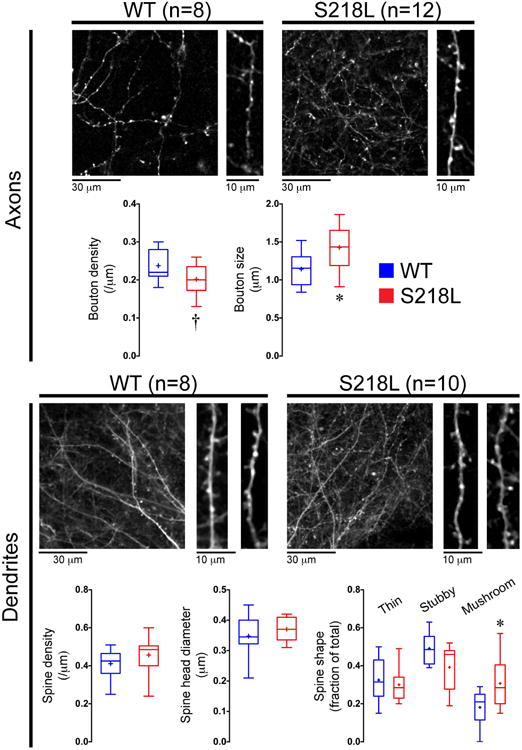
Representative z-stacks and whisker-box plots show pre-CSD axonal and dendritic morphology in S218L mutant (N=12 for axons and N=10 for dendrites) and WT mice (N=8 for axons and dendrites). Axonal bouton size and the proportion of excitable mushroom type spines were higher on S218L mutants compared to WT. *p<0.05 and †p=0.069 vs. WT (t-test). Scale bars indicate relative size.
Figure 6. Dendritic beading during CSD.

Representative frames show axonal and dendritic morphology at baseline resting state, during CSD, and 5 minutes later. During passage of the CSD-associated [Ca2+]i wave, axons did not show structural changes (upper panel), but dendrites developed beading (lower panel). Some spines are transiently engulfed (arrows), while others are not internalized into the beads of the parent shaft but appear as an individual circular structure (arrowheads). Scale bars indicate relative size.
Figure 7. Axonal and dendritic morphology after CSD.

Representative z-stacks show pre- and post-CSD axonal and dendritic morphology in two WT (upper left and right panels) and two S218L mutant mice (lower left and right panels). Graphs show pre- and post-CSD synaptic measures in individual animals (Axons: S218L: N=12 & WT: N=6; Dendrites: S218L: N=9 & WT: N=8). After CSD, axonal bouton density increased and bouton size decreased in both genotypes. Arrowheads show new axonal boutons that appeared in post-CSD z-stacks. In WT mice only, the proportion of thin and mushroom type spines increased and stubby spines decreased in post-CSD z-stacks compared with baseline. Dendritic spines did not change in S218L mutants. *p<0.05, **p<0.01, ***p<0.001 and †p=0.089 vs. pre-CSD (paired t-test). Scale bars indicate relative size.
Figure 8. Structural changes after a CSD at later time points.

Changes in spine density, head diameter and spine type measured within the same volume shown as a function of time after CSD in S218L HET (N=6) and WT (N=5) mice. Baseline: before CSD, post 1: 6±1 min, post 2: 13±4 min and post 3: 24±10 min after CSD. *Overall p value for the repeated-measures one-way ANOVA; #p value of post-test for linear trend.
Hemodynamic and metabolic response to CSD
Because neuronal activity is tightly coupled to metabolic and blood flow responses in the cortex, we monitored these using simultaneous laser speckle flowmetry (LSF) and multispectral reflectance imaging (MSRI) during CSD. Epidural application of KCl triggered a CSD that propagated in a centrifugal fashion throughout the ipsilateral cortex. In all mice studied (S218L: N=7; WT: N=6), CSD evoked multiphasic changes in CBF, oxygenation and oxygen metabolism (Figure 9). A second CSD triggered 15 minutes later evoked a monophasic response superimposed on the post-CSD oligemia in the wake of the first CSD, as previously described 38,42. Both CBF and oxygenation response during the CSD were similar between the groups. However, FHM1 mutant mice developed more severe oligemia and cortical deoxygenation in the wake of CSD compared with WT mice.
Figure 9. Cortical blood flow, oxygenation and oxygen metabolism during CSD.

Graphs show changes in six hemodynamic and metabolic parameters simultaneously measured using combined laser speckle and multispectral reflectance imaging during two consecutive CSDs induced 15 minutes apart. Vertical and horizontal error bars reflect the standard error of the magnitude and latency of the measured parameter at 5 deflection points and at 3, 5, 7, 9 and 11 minutes after CSD onset (t=0). Post-CSD oligemia was more severe in S218L mutants (N=7) compared to WT (N=6). *p<0.05, **p<0.01 and ***p<0.001 S218L vs. WT (two-way ANOVA for repeated measures).
Discussion
This is the first direct in vivo demonstration of abnormal neuronal Ca2+ homeostasis, synaptic morphology and cerebral blood flow response to CSD in a transgenic mutant mouse model of migraine. Transgenic mice heterozygous for CaV2.1 S218L mutation show markedly elevated axonal [Ca2+]i and loss of [Ca2+]i compartmentalization at resting state. Dendritic [Ca2+]i is more subtly elevated, reflecting a milder postsynaptic gain-of-function phenotype or presence of compensatory mechanisms. During CSD, both axons and dendrites of FHM1 mutants display higher [Ca2+]i surge. Abnormal [Ca2+]i homeostasis is accompanied by morphological changes, including larger axonal boutons and a higher proportion of highly excitable mushroom type dendritic spines in the mutants, a novel phenotype that may contribute to and/or reflect the hyperexcitability in FHM1.
Elevated resting [Ca2+]i translates into stronger synaptic connections, and may be an important mechanism for enhanced CSD susceptibility and hyperexcitability in FHM1. Presynaptic [Ca2+]i exhibits a power law relationship with the neurotransmitter release and synaptic transmission during depolarization 43,44. A recent in-vitro study showed that elevated neuronal [Ca2+]i at resting state in the S218L mutant increases spontaneous transmitter release and synaptic transmission strength in brainstem slices 45. We found larger axonal boutons in FHM1 mutants at resting state that can also be explained by higher baseline [Ca2+]i at presynaptic terminals of cortical and possibly other neurons 46. Larger boutons mark stronger synapses, because they clear [Ca2+]i slower, contain higher number of vesicles, and associate more often with mushroom type dendritic spines 47-49. In dendrites, increased [Ca2+]i enhances excitability by initiating delivery of glutamate receptors into spines 50 and enlarging spine heads 51. Therefore, higher resting [Ca2+]i in FHM1 mutants may explain the higher percentage of mushroom spines, which are functionally stronger owing to larger postsynaptic densities anchoring more glutamate receptors 52-54. Our experiments suggest altered synaptic morphology with stronger synaptic connections in addition to elevated [Ca2+]i to explain cerebral hyperexcitability. Altered synaptic morphology may be developmental and/or a result of repetitive spontaneous CSDs in S218L. Consistent with its effect on excitability, resting [Ca2+]i also modulates CSD susceptibility. Increasing resting [Ca2+]i augments CSD propagation 55, and conversely, 20% reduction in resting [Ca2+]i in tottering and leaner mice, which also carry Cacna1a mutations but with a loss of CaV2.1 function, is associated with diminished CSD susceptibility 56,57. We here show that inhibition of the CaV2.1 gain-of-function by the gating modifier BHQ in fact almost normalizes CSD susceptibility in FHM1 mutants. It has been recently reported that BHQ in vitro inhibits CaV2.1 voltage-dependent activation, thereby ameliorating gating defects and synaptic transmission due to S218L mutation 40.
Both axonal and dendritic [Ca2+]i increased dramatically during CSD. Peak axonal [Ca2+]i attained during CSD in FHM1 mutants (YFP/CFP ratio 4.24±0.29) approached that observed after cardiac arrest (YFP/CFP ratio ∼4.50; data not shown). Despite higher resting and CSD-associated [Ca2+]i levels in FHM1 mutants, dendritic beading and loss of spines during CSD did not differ from WT, suggesting that the mechanisms mediating the structural changes during CSD are already maximally stimulated in WT, or that they are not dependent upon or modulated by [Ca2+]i. Unlike the dendrites, axons did not show significant swelling during CSD, supporting a critical role for postsynaptic Na+ and water influx via glutamate receptors, as previously suggested 58,59.
Axonal boutons and dendritic spines are highly dynamic structures that can rapidly and reversibly appear or disappear, or change shape 60-62. After the recovery of CSD, we found consistently higher axonal bouton density and lower average bouton size, suggesting smaller newly formed boutons, as previously described 63. In addition, the percentage of excitable mushroom spines and plastic thin spines increased while stubby spines decreased after CSD in WT mice only, resembling changes that occur after long-term potentiation or transient global ischemia 64. The shift in spine morphology can be explained by elevated [K+]e and glutamate levels 25,65. Absence of a change in spine shape after CSD in S218L mutant mice may be because mutants already have a higher proportion of mushroom spines, possibly due to chronically elevated [Ca2+]i or spontaneous CSDs occurring in awake state in this highly susceptible strain.
It is difficult to directly extrapolate higher axonal and dendritic [Ca2+]i in FHM1 mutant mice to patients with the disease, even more so to other rare monogenic or more common polygenic forms of migraine. There is accumulating evidence that implicates Ca2+ dysregulation as a possible shared causal mechanism in migraine pathophysiology. For example, single nucleotide polymorphisms in the transient receptor potential channels TRPV1 and TRPV3, and gene variants in TRESK channel related genes (STX1A), have been linked to migraine 66,67. The link between migraine and [Ca2+]idysregulation does not appear to be limited to neurons. In a transgenic mouse model of familial migraine and advanced sleep phase syndrome, casein kinase Iδ mutations were associated with increased spontaneous and evoked Ca2+signaling in astrocytes, and an increased susceptibility to CSD 68. Because YC3.6 was exclusively expressed in neurons, we did not assess astrocytic Ca2+ homeostasis in this study. Although CaV2.1 currents are not detected in astrocytes 69, indirect effects on astrocytic function cannot be excluded.
Elevated resting [Ca2+]i and loss of axonal [Ca2+]i compartmentalization suggest that pumps and exchangers maintaining resting state Ca2+ homeostasis (e.g., plasma-membrane and sarco(endo)plasmic Ca2+-ATPase) do not fully compensate for the increased net Ca2+ influx through mutant CaV2.1 channels. In contrast, pumps responsible for recovery of high [Ca2+]i after a CSD (e.g., Na+/Ca2+exchanger and the mitochondrial uniporter) seem to be at least as functional as in WT. Our data may have implications for increased risk of white matter lesions in migraineurs29,70, and rare neurodegeneration seen in FHM patients 26,27,28. Mild elevation of resting [Ca2+]i, [Ca2+]i overload or loss of [Ca2+]i compartmentalization, particularly if chronic, can all be neurotoxic. Moreover, elevated resting [Ca2+]i and a larger rise during CSD may also have implications for stroke where CSD-like peri-infarct depolarizations occur spontaneously. FHM1 mutant brains are more vulnerable to ischemic injury, due to a higher CBF threshold for tissue viability and more frequent peri-infarct depolarizations, leading to worse stroke outcomes 71. Conversely, Rolling Nagoya and Leaner mice that also carry a Cacna1a mutation with a loss of CaV2.1 function effect, and Leaner mice exhibit smaller infarcts after ischemic stroke, and smaller [Ca2+]i increases upon O2 and glucose deprivation 72.
Although we have previously shown that FHM1 mutations do not affect absolute resting CBF 71, vascular and metabolic response to CSD can still impact the [Ca2+]i kinetics and cell viability. We, therefore, investigated cerebral perfusion and oxygenation changes during CSD, and found a small but significant difference in the magnitude of post-CSD oligemia with an associated reduction in oxyHb and CMRO2. The precise mediators and modulators, and how they are impacted by FHM1 mutations remain unclear. CaV2.1 channel expression has been reported in systemic and cerebral vascular smooth muscle cells, but whether they are functional is unknown 73-75. Nevertheless, because post-CSD oligemia can last up to an hour or more 42, more severe oligemia may be responsible for more severe auras in FHM, and exacerbate the neurodegenerative phenotype cumulatively upon repeated migraine attacks over decades.
Direct in vivo examination of neuronal [Ca2+]i using neuronal infection with the genetically encoded ratiometric Ca2+ indicator yellow cameleon YC3.6 is a novel and validated method 24,76. Although the relatively low Kd of YC3.6 (278nM) may affect the measured [Ca2+]i values as the dye saturates at the μM range, resting [Ca2+]i levels were well within the dynamic range, and we found significantly higher peak [Ca2+]i levels in the mutants during CSD suggesting that peak values were still within the dynamic range of this indicator. However, we may have underestimated the strain differences due to saturation. Both resting [Ca2+]i and the overall magnitude and duration of [Ca2+]i rise during CSD were within previously reported ranges using the low-affinity ratiometric indicator Fura-4F, in vitro 77-80. Similar to a recent in vitro study using fura-2, resting state neuronal [Ca2+]i levels were around 100 nM, and higher in S218L compared to WT 45. However, single fluorophores can only provide relative changes rather than the actual calcium concentrations, and cannot be used to compare resting [Ca2+]i between neurons, neuronal compartments and genotypes. Lastly, our technique provided sufficient spatial resolution to resolve not only the [Ca2+]i in axonal boutons and dendritic spines but also their morphology. Axonal bouton and dendritic spine density and size in WT mice were similar to previous reports 35,81-84. It should be noted that although examination of both axons and dendrites in the same animal is a powerful approach, it also constrains the study to a specific cortical neuronal population; therefore, whether other brain regions and neuronal populations also show similar changes requires further study.
In summary, using in vivo multiphoton microscopy, we showed increased [Ca2+]i both at resting state and during CSD in FHM1 mutant mice. Together with larger boutons and higher percentage of highly excitable mushroom spines, the phenotype may form the underpinnings of a persistently hyperexcitable state in FHM1. Whether these synaptic changes we described in layer V neurons are also present in other cortical and subcortical regions remains to be studied. Nevertheless, these data support the concept that synaptic disorders predispose to migraine by enhancing susceptibility to the migraine trigger CSD.
Supplementary Material
Movie 1. Expression of the [Ca2+]i indicator YC3.6 The genetically encoded Ca2+indicator YC3.6 was expressed in soma and dendrites ipsilateral to the injection side as shown in this representative z-projected cortical volume of 410×410×447μm in a WT mouse. Blue square indicates cortical surface. Shadows of pial vessels in the imaging field are also seen. Red, yellow and green indicate low, medium and high [Ca2+]i, respectively.
Movies 2-7. CSD-induced [Ca2+]i changes in cortical neuropil Please see Figure 3 legend for imaging field dimensions, where time-lapse frames from these movies are shown. Movies 2 and 3 show axonal field from WT and S218L mutant, respectively (rows 1-2 in Figure 3a). Movies 4 and 5 are low magnification (rows 3-4 in Figure 3a), and 6 and 7 are high magnification (rows 5-6 in Figure 3a) dendritic views from WT and S218L mutant, respectively.
Acknowledgments
This work was supported by the American Heart Association (10SDG2610275, KEH), National Institutes of Health (NS061505, NS055104, CA; NIH EB000768, BB), Harvard Catalyst—The Harvard Clinical and Translational Science Center (NIH Award #UL1 RR 025758 and financial contributions from Harvard University and its affiliated academic health care centers), the Center for Medical Systems Biology (CMSB) established in the Netherlands Genomics Initiative/Netherlands Organization for Scientific Research (NGI/NWO), project nr. 050-060-409 (AvdM), Neuroendovascular Research Fund from the Andrew David Heitman Foundation, and The Ellison Foundation. We thank Prof. Andrew C. Charles for helpful discussions during manuscript preparation, and Diana Thyssen for performing intracortical injections.
Footnotes
Author contributions: KEH: Study design, surgery, multiphoton imaging, image and data analysis, data interpretation, manuscript preparation; MAO: Instructed and supervised image and data analysis; NY: Electrophysiological recordings after BHQ administration, structural analysis of axons; ESY: Image and data analysis; KVK: Study design, 2P-imaging, image and data analysis (Ca2+ analysis); IY: Laser speckle and multimodal imaging; EH: Instructed and supervised morphological spine analysis; CRL: Intracortical injection of YC and image analysis (Ca2+ analysis); MC: Image and data analysis (morphological spine analysis); FK: Image and data analysis (Ca2+ analysis); AB: Intracortical injection of YC and image analysis (Ca2+ analysis); BS: Image and data analysis (Ca2+ analysis); AN: Image and data analysis (structural analysis of axons); IR: Image and data analysis (Ca2+ analysis); AA: Image and data analysis (Ca2+ analysis); MDF: Study design, data interpretation, manuscript preparation; AMJMvdM: Study design, data interpretation, manuscript preparation, funding; BJB: Study design, instructed and supervised image and data analysis, data interpretation, manuscript preparation; CA: Study design, data analysis, data interpretation, manuscript preparation, funding.
Potential conflicts of interest: None.
References
- 1.Jensen R, Stovner LJ. Epidemiology and comorbidity of headache. Lancet Neurol. 2008;7:354–361. doi: 10.1016/S1474-4422(08)70062-0. [DOI] [PubMed] [Google Scholar]
- 2.Linde M, Gustavsson A, Stovner LJ, et al. The cost of headache disorders in Europe: the Eurolight project. Eur J Neurol. 2012;19:703–711. doi: 10.1111/j.1468-1331.2011.03612.x. [DOI] [PubMed] [Google Scholar]
- 3.Chen WT, Lin YY, Fuh JL, et al. Sustained visual cortex hyperexcitability in migraine with persistent visual aura. Brain. 2011;134:2387–2395. doi: 10.1093/brain/awr157. [DOI] [PubMed] [Google Scholar]
- 4.Moskowitz MA, Bolay H, Dalkara T. Deciphering migraine mechanisms: clues from familial hemiplegic migraine genotypes. Ann Neurol. 2004;55:276–280. doi: 10.1002/ana.20035. [DOI] [PubMed] [Google Scholar]
- 5.Ferrari MD, Klever RR, Terwindt GM, et al. Migraine pathophysiology: lessons from mouse models and human genetics. Lancet Neurol. 2015;14:65–80. doi: 10.1016/S1474-4422(14)70220-0. [DOI] [PubMed] [Google Scholar]
- 6.Pietrobon D, Moskowitz MA. Chaos and commotion in the wake of cortical spreading depression and spreading depolarizations. Nat Rev Neurosci. 2014;15:379–393. doi: 10.1038/nrn3770. [DOI] [PubMed] [Google Scholar]
- 7.Eikermann-Haerter K, Dilekoz E, Kudo C, et al. Genetic and hormonal factors modulate spreading depression and transient hemiparesis in mouse models of familial hemiplegic migraine type 1. J Clin Invest. 2009;119:99–109. doi: 10.1172/JCI36059. [DOI] [PMC free article] [PubMed] [Google Scholar]
- 8.van den Maagdenberg AM, Pizzorusso T, Kaja S, et al. High cortical spreading depression susceptibility and migraine-associated symptoms in Ca(v)2.1 S218L mice. Ann Neurol. 2010;67:85–98. doi: 10.1002/ana.21815. [DOI] [PubMed] [Google Scholar]
- 9.van den Maagdenberg AM, Pietrobon D, Pizzorusso T, et al. A Cacna1a knockin migraine mouse model with increased susceptibility to cortical spreading depression. Neuron. 2004;41:701–710. doi: 10.1016/s0896-6273(04)00085-6. [DOI] [PubMed] [Google Scholar]
- 10.Leo L, Gherardini L, Barone V, et al. Increased susceptibility to cortical spreading depression in the mouse model of familial hemiplegic migraine type 2. PLoS Genet. 2011;7:e1002129. doi: 10.1371/journal.pgen.1002129. [DOI] [PMC free article] [PubMed] [Google Scholar]
- 11.Tottene A, Conti R, Fabbro A, et al. Enhanced excitatory transmission at cortical synapses as the basis for facilitated spreading depression in Ca(v)2.1 knockin migraine mice. Neuron. 2009;61:762–773. doi: 10.1016/j.neuron.2009.01.027. [DOI] [PubMed] [Google Scholar]
- 12.Ayata C. Cortical spreading depression triggers migraine attack: pro. Headache. 2010;50:725–730. doi: 10.1111/j.1526-4610.2010.01647.x. [DOI] [PubMed] [Google Scholar]
- 13.Bolay H, Reuter U, Dunn AK, et al. Intrinsic brain activity triggers trigeminal meningeal afferents in a migraine model. Nat Med. 2002;8:136–142. doi: 10.1038/nm0202-136. [DOI] [PubMed] [Google Scholar]
- 14.Ophoff RA, Terwindt GM, Vergouwe MN, et al. Familial hemiplegic migraine and episodic ataxia type-2 are caused by mutations in the Ca2+ channel gene CACNL1A4. Cell. 1996;87:5435–5452. doi: 10.1016/s0092-8674(00)81373-2. [DOI] [PubMed] [Google Scholar]
- 15.Gao Z, Todorov B, Barrett CF, et al. Cerebellar ataxia by enhanced Ca(V)2.1 currents is alleviated by Ca2+-dependent K+-channel activators in Cacna1a(S218L) mutant mice. J Neurosci. 2012;32:15533–15546. doi: 10.1523/JNEUROSCI.2454-12.2012. [DOI] [PMC free article] [PubMed] [Google Scholar]
- 16.Maejima T, Wollenweber P, Teusner LU, et al. Postnatal loss of P/Q-type channels confined to rhombic-lip-derived neurons alters synaptic transmission at the parallel fiber to purkinje cell synapse and replicates genomic Cacna1a mutation phenotype of ataxia and seizures in mice. J Neurosci. 2013;33:5162–5174. doi: 10.1523/JNEUROSCI.5442-12.2013. [DOI] [PMC free article] [PubMed] [Google Scholar]
- 17.Pietrobon D. Insights into migraine mechanisms and CaV2.1 calcium channel function from mouse models of familial hemiplegic migraine. J Physiol. 2010;588:1871–1878. doi: 10.1113/jphysiol.2010.188003. [DOI] [PMC free article] [PubMed] [Google Scholar]
- 18.Tottene A, Fellin T, Pagnutti S, et al. Familial hemiplegic migraine mutations increase Ca(2+) influx through single human CaV2.1 channels and decrease maximal CaV2.1 current density in neurons. Proc Natl Acad Sci U S A. 2002;99:13284–13289. doi: 10.1073/pnas.192242399. [DOI] [PMC free article] [PubMed] [Google Scholar]
- 19.Tottene A, Pivotto F, Fellin T, et al. Specific kinetic alterations of human CaV2.1 calcium channels produced by mutation S218L causing familial hemiplegic migraine and delayed cerebral edema and coma after minor head trauma. J BiolChem. 2005;280:17678–17686. doi: 10.1074/jbc.M501110200. [DOI] [PubMed] [Google Scholar]
- 20.Inchauspe CG, Urbano FJ, Di Guilmi MN, et al. Gain of function in FHM-1 Ca(V)2.1 knock-in mice is related to the shape of the action potential. J Neurophysiol. 2010;104:291–299. doi: 10.1152/jn.00034.2010. [DOI] [PMC free article] [PubMed] [Google Scholar]
- 21.Adams PJ, Garcia E, David LS, et al. Ca(V)2.1 P/Q-type calcium channel alternative splicing affects the functional impact of familial hemiplegic migraine mutations: implications for calcium channelopathies. Channels. 2009;3:110–121. doi: 10.4161/chan.3.2.7932. [DOI] [PubMed] [Google Scholar]
- 22.Cao YQ, Tsien RW. Effects of familial hemiplegic migraine type 1 mutations on neuronal P/Q-type Ca2+ channel activity and inhibitory synaptic transmission. Proc Natl Acad Sci U S A. 2005;102:2590–2595. doi: 10.1073/pnas.0409896102. [DOI] [PMC free article] [PubMed] [Google Scholar]
- 23.Mullner C, Broos LA, van den Maagdenberg AM, Striessnig J. Familial hemiplegic migraine type 1 mutations K1336E, W1684R, and V1696I alter CaV2.1 Ca2+ channel gating: evidence for beta-subunit isoform-specific effects. J BiolChem. 2004;279:51844–51850. doi: 10.1074/jbc.M408756200. [DOI] [PubMed] [Google Scholar]
- 24.Kuchibhotla KV, Goldman ST, Lattarulo CR, et al. Abeta plaques lead to aberrant regulation of calcium homeostasis in vivo resulting in structural and functional disruption of neuronal networks. Neuron. 2008;59:214–225. doi: 10.1016/j.neuron.2008.06.008. [DOI] [PMC free article] [PubMed] [Google Scholar]
- 25.Brunig I, Kaech S, Brinkhaus H, et al. Influx of extracellular calcium regulates actin-dependent morphological plasticity in dendritic spines. Neuropharmacology. 2004;47:669–676. doi: 10.1016/j.neuropharm.2004.07.038. [DOI] [PubMed] [Google Scholar]
- 26.Romaniello R, Zucca C, Tonelli A, et al. A wide spectrum of clinical, neurophysiological and neuroradiological abnormalities in a family with a novel CACNA1A mutation. J Neurol Neurosurg Psychiatry. 2010;81:840–843. doi: 10.1136/jnnp.2008.163402. [DOI] [PubMed] [Google Scholar]
- 27.Carreno O, Garcia-Silva MT, Garcia-Campos O, et al. Acute striatal necrosis in hemiplegic migraine with de novo CACNA1A mutation. Headache. 2011;51:1542–1546. doi: 10.1111/j.1526-4610.2011.02014.x. [DOI] [PubMed] [Google Scholar]
- 28.Elliott MA, Peroutka SJ, Welch S, May EF. Familial hemiplegic migraine, nystagmus, and cerebellar atrophy. Ann Neurol. 1996;39:100–106. doi: 10.1002/ana.410390115. [DOI] [PubMed] [Google Scholar]
- 29.Porter A, Gladstone JP, Dodick DW. Migraine and white matter hyperintensities. Curr Pain Headache Rep. 2005;9:289–293. doi: 10.1007/s11916-005-0039-y. [DOI] [PubMed] [Google Scholar]
- 30.Nagai T, Yamada S, Tominaga T, et al. Expanded dynamic range of fluorescent indicators for Ca(2+) by circularly permuted yellow fluorescent proteins. Proc Natl Acad Sci U S A. 2004;101:10554–10559. doi: 10.1073/pnas.0400417101. [DOI] [PMC free article] [PubMed] [Google Scholar]
- 31.Skoch J, Hickey GA, Kajdasz ST, et al. In vivo imaging of amyloid-beta deposits in mouse brain with multiphoton microscopy. Meth Mol Biol. 2005;299:349–363. doi: 10.1385/1-59259-874-9:349. [DOI] [PubMed] [Google Scholar]
- 32.Bacskai BJ, Klunk WE, Mathis CA, Hyman BT. Imaging amyloid-beta deposits in vivo. J Cereb Blood Flow Metab. 2002;22:1035–1041. doi: 10.1097/00004647-200209000-00001. [DOI] [PubMed] [Google Scholar]
- 33.Grynkiewicz G, Poenie M, Tsien RY. A new generation of Ca2+ indicators with greatly improved fluorescence properties. J Biol Chem. 1985;260:3440–3450. [PubMed] [Google Scholar]
- 34.Dumitriu D, Rodriguez A, Morrison JH. High-throughput, detailed, cell-specific neuroanatomy of dendritic spines using microinjection and confocal microscopy. Nat Protocols. 2011;6:1391–1411. doi: 10.1038/nprot.2011.389. [DOI] [PMC free article] [PubMed] [Google Scholar]
- 35.Rodriguez A, Ehlenberger DB, Dickstein DL, et al. Automated three-dimensional detection and shape classification of dendritic spines from fluorescence microscopy images. PLoS ONE. 2008;3:e1997. doi: 10.1371/journal.pone.0001997. [DOI] [PMC free article] [PubMed] [Google Scholar]
- 36.Spires-Jones TL, Meyer-Luehmann M, Osetek JD, et al. Impaired spine stability underlies plaque-related spine loss in an Alzheimer's disease mouse model. American J Pathol. 2007;171:1304–1311. doi: 10.2353/ajpath.2007.070055. [DOI] [PMC free article] [PubMed] [Google Scholar]
- 37.Hudry E, Wu HY, Arbel-Ornath M, et al. Inhibition of the NFAT pathway alleviates amyloid beta neurotoxicity in a mouse model of Alzheimer's disease. J Neurosci. 2012;32:3176–3192. doi: 10.1523/JNEUROSCI.6439-11.2012. [DOI] [PMC free article] [PubMed] [Google Scholar]
- 38.Yuzawa I, Sakadzic S, Srinivasan VJ, et al. Cortical spreading depression impairs oxygen delivery and metabolism in mice. J Cereb Blood Flow Metab. 2012;32:376–386. doi: 10.1038/jcbfm.2011.148. [DOI] [PMC free article] [PubMed] [Google Scholar]
- 39.Jones PB, Shin HK, Boas DA, et al. Simultaneous multispectral reflectance imaging and laser speckle flowmetry of cerebral blood flow and oxygen metabolism in focal cerebral ischemia. J Biomed Opt. 2008;13:044007. doi: 10.1117/1.2950312. [DOI] [PMC free article] [PubMed] [Google Scholar]
- 40.Inagaki A, Frank CA, Usachev YM, Benveniste M, Lee A. Pharmacological Correction of Gating Defects in the Voltage-Gated Cav2.1 Ca(2+) Channel due to a Familial Hemiplegic Migraine Mutation. Neuron. 2014;81:91–102. doi: 10.1016/j.neuron.2013.10.056. [DOI] [PMC free article] [PubMed] [Google Scholar]
- 41.Takano T, Tian GF, Peng W, et al. Cortical spreading depression causes and coincides with tissue hypoxia. Nat Neurosci. 2007;10:754–762. doi: 10.1038/nn1902. [DOI] [PubMed] [Google Scholar]
- 42.Ayata C, Shin HK, Salomone S, et al. Pronounced hypoperfusion during spreading depression in mouse cortex. J Cereb Blood Flow Metab. 2004;24:1172–1182. doi: 10.1097/01.WCB.0000137057.92786.F3. [DOI] [PubMed] [Google Scholar]
- 43.Awatramani GB, Price GD, Trussell LO. Modulation of transmitter release by presynaptic resting potential and background calcium levels. Neuron. 2005;48:109–121. doi: 10.1016/j.neuron.2005.08.038. [DOI] [PubMed] [Google Scholar]
- 44.Yu Y, Maureira C, Liu X, McCormick D. P/Q and N channels control baseline and spike-triggered calcium levels in neocortical axons and synaptic boutons. J Neurosci. 2010;30:11858–11869. doi: 10.1523/JNEUROSCI.2651-10.2010. [DOI] [PMC free article] [PubMed] [Google Scholar]
- 45.Di Guilmi MN, Wang T, Inchauspe CG, et al. Synaptic gain-of-function effects of mutant Cav21 channels in a mouse model of familial hemiplegic migraine are due to increased basal [Ca2+]i. J Neurosci. 2014;34:7047–7058. doi: 10.1523/JNEUROSCI.2526-13.2014. [DOI] [PMC free article] [PubMed] [Google Scholar]
- 46.Lin H, Vicini S, Hsu FC, et al. Axonal alpha7 nicotinic ACh receptors modulate presynaptic NMDA receptor expression and structural plasticity of glutamatergic presynaptic boutons. Proc Natl Acad Sci U S A. 2010;107:16661–16666. doi: 10.1073/pnas.1007397107. [DOI] [PMC free article] [PubMed] [Google Scholar]
- 47.Dobie FA, Craig AM. Inhibitory synapse dynamics: coordinated presynaptic and postsynaptic mobility and the major contribution of recycled vesicles to new synapse formation. J Neurosci. 2011;31:10481–10493. doi: 10.1523/JNEUROSCI.6023-10.2011. [DOI] [PMC free article] [PubMed] [Google Scholar]
- 48.Harris KM, Jensen FE, Tsao B. Three-dimensional structure of dendritic spines and synapses in rat hippocampus (CA1) at postnatal day 15 and adult ages: implications for the maturation of synaptic physiology and long-term potentiation. J Neurosci. 1992;12:2685–2705. doi: 10.1523/JNEUROSCI.12-07-02685.1992. [DOI] [PMC free article] [PubMed] [Google Scholar]
- 49.Zhang W, Linden DJ. Calcium influx measured at single presynaptic boutons of cerebellar granule cell ascending axons and parallel fibers. Cerebellum. 2012;11:121–131. doi: 10.1007/s12311-009-0151-3. [DOI] [PMC free article] [PubMed] [Google Scholar]
- 50.Vlachos A, Korkotian E, Schonfeld E, Copanaki E, Deller T, Segal M. Synaptopodin regulates plasticity of dendritic spines in hippocampal neurons. J Neurosci. 2009;29:1017–1033. doi: 10.1523/JNEUROSCI.5528-08.2009. [DOI] [PMC free article] [PubMed] [Google Scholar]
- 51.Noguchi J, Matsuzaki M, Ellis-Davies GC, Kasai H. Spine-neck geometry determines NMDA receptor-dependent Ca2+ signaling in dendrites. Neuron. 2005;46:609–622. doi: 10.1016/j.neuron.2005.03.015. [DOI] [PMC free article] [PubMed] [Google Scholar]
- 52.Matsuzaki M, Ellis-Davies GC, Nemoto T, Miyashita Y, Iino M, Kasai H. Dendritic spine geometry is critical for AMPA receptor expression in hippocampal CA1 pyramidal neurons. Nat Neurosci. 2001;4:1086–1092. doi: 10.1038/nn736. [DOI] [PMC free article] [PubMed] [Google Scholar]
- 53.Nimchinsky EA, Yasuda R, Oertner TG, Svoboda K. The number of glutamate receptors opened by synaptic stimulation in single hippocampal spines. J Neurosci. 2004;24:2054–2064. doi: 10.1523/JNEUROSCI.5066-03.2004. [DOI] [PMC free article] [PubMed] [Google Scholar]
- 54.Segal I, Korkotian I, Murphy DD. Dendritic spine formation and pruning: common cellular mechanisms? Trends Neurosci. 2000;23:53–57. doi: 10.1016/s0166-2236(99)01499-x. [DOI] [PubMed] [Google Scholar]
- 55.Torrente D, Mendes-da-Silva RF, Lopes AA, et al. Increased calcium influx triggers and accelerates cortical spreading depression in vivo in male adult rats. Neurosci Lett. 2013;558:87–90. doi: 10.1016/j.neulet.2013.11.004. [DOI] [PubMed] [Google Scholar]
- 56.Bawa B, Abbott LC. Analysis of calcium ion homeostasis and mitochondrial function in cerebellar granule cells of adult CaV2.1 calcium ion channel mutant mice. Neurotox Res. 2008;13:1–18. doi: 10.1007/BF03033363. [DOI] [PubMed] [Google Scholar]
- 57.Ayata C, Shimizu-Sasamata M, Lo EH, et al. Impaired neurotransmitter release and elevated threshold for cortical spreading depression in mice with mutations in the alpha1A subunit of P/Q type calcium channels. Neuroscience. 2000;95:639–645. doi: 10.1016/s0306-4522(99)00446-7. [DOI] [PubMed] [Google Scholar]
- 58.Hasbani MJ, Hyrc KL, Faddis BT, et al. Distinct roles for sodium, chloride, and calcium in excitotoxic dendritic injury and recovery. Exp Neurol. 1998;154:241–258. doi: 10.1006/exnr.1998.6929. [DOI] [PubMed] [Google Scholar]
- 59.Hasbani MJ, Schlief ML, Fisher DA, Goldberg MP. Dendritic spines lost during glutamate receptor activation reemerge at original sites of synaptic contact. J Neurosci. 2001;21:2393–2403. doi: 10.1523/JNEUROSCI.21-07-02393.2001. [DOI] [PMC free article] [PubMed] [Google Scholar]
- 60.De Paola V, Holtmaat A, Knott G, et al. Cell type-specific structural plasticity of axonal branches and boutons in the adult neocortex. Neuron. 2006;49:861–875. doi: 10.1016/j.neuron.2006.02.017. [DOI] [PubMed] [Google Scholar]
- 61.Fischer M, Kaech S, Knutti D, Matus A. Rapid actin-based plasticity in dendritic spines. Neuron. 1998;20:847–854. doi: 10.1016/s0896-6273(00)80467-5. [DOI] [PubMed] [Google Scholar]
- 62.Stettler DD, Yamahachi H, Li W, et al. Axons and synaptic boutons are highly dynamic in adult visual cortex. Neuron. 2006;49:877–887. doi: 10.1016/j.neuron.2006.02.018. [DOI] [PubMed] [Google Scholar]
- 63.Becker N, Wierenga CJ, Fonseca R, et al. LTD induction causes morphological changes of presynaptic boutons and reduces their contacts with spines. Neuron. 2008;60:590–597. doi: 10.1016/j.neuron.2008.09.018. [DOI] [PubMed] [Google Scholar]
- 64.Ruan YW, Lei Z, Fan Y, Zou B, Xu ZC. Diversity and fluctuation of spine morphology in CA1 pyramidal neurons after transient global ischemia. J Neurosci Res. 2009;87:61–6. doi: 10.1002/jnr.21816. [DOI] [PubMed] [Google Scholar]
- 65.Fischer M, Kaech S, Wagner U, et al. Glutamate receptors regulate actin-based plasticity in dendritic spines. Nat Neurosci. 2000;3:887–894. doi: 10.1038/78791. [DOI] [PubMed] [Google Scholar]
- 66.Carreno O, Corominas R, Fernandez-Morales J, et al. SNP variants within the vanilloid TRPV1 and TRPV3 receptor genes are associated with migraine in the Spanish population. Am J Med Genet B Neuropsychiatr Genet. 2012;159B:94–103. doi: 10.1002/ajmg.b.32007. [DOI] [PubMed] [Google Scholar]
- 67.Tropeano M, Wober-Bingol C, Karwautz A, et al. Association analysis of STX1A gene variants in common forms of migraine. Cephalalgia. 2012;32:203–212. doi: 10.1177/0333102411433300. [DOI] [PubMed] [Google Scholar]
- 68.Brennan KC, Bates EA, Shapiro RE, et al. Casein kinase idelta mutations in familial migraine and advanced sleep phase. Sci Translat Med. 2013;5:1–11. doi: 10.1126/scitranslmed.3005784. [DOI] [PMC free article] [PubMed] [Google Scholar]
- 69.D'Ascenzo M, Vairano M, Andreassi C, et al. Electrophysiological and molecular evidence of L-(CaV1), N- (CaV2.2), and R- (CaV2.3) type Ca2+ channels in rat cortical astrocytes. Glia. 2004;45:354–363. doi: 10.1002/glia.10336. [DOI] [PubMed] [Google Scholar]
- 70.Lakhan SE, Avramut M, Tepper SJ. Structural and Functional Neuroimaging in Migraine: Insights From 3 Decades of Research. Headache. 2012;53:46–66. doi: 10.1111/j.1526-4610.2012.02274.x. [DOI] [PubMed] [Google Scholar]
- 71.Eikermann-Haerter K, Lee JH, Yuzawa I, et al. Migraine mutations increase stroke vulnerability by facilitating ischemic depolarizations. Circulation. 2012;125:335–345. doi: 10.1161/CIRCULATIONAHA.111.045096. [DOI] [PMC free article] [PubMed] [Google Scholar]
- 72.Tian X, Zhou Y, Gao L, et al. Analysis of ischemic neuronal injury in Cav2.1 channel alpha1 subunit mutant mice. Biochem Biophys Res Commun. 2013;434:60–64. doi: 10.1016/j.bbrc.2013.03.066. [DOI] [PubMed] [Google Scholar]
- 73.Kuo IY, Ellis A, Seymour VA, et al. Dihydropyridine-insensitive calcium currents contribute to function of small cerebral arteries. J Cereb Blood Flow Metab. 2010;30:1226–1239. doi: 10.1038/jcbfm.2010.11. [DOI] [PMC free article] [PubMed] [Google Scholar]
- 74.Andreasen D, Friis UG, Uhrenholt TR, et al. Coexpression of voltage-dependent calcium channels Cav1.2, 2.1a, and 2.1b in vascular myocytes. Hypertension. 2006;47:735–741. doi: 10.1161/01.HYP.0000203160.80972.47. [DOI] [PubMed] [Google Scholar]
- 75.Hansen PB, Jensen BL, Andreasen D, et al. Vascular smooth muscle cells express the alpha(1A) subunit of a P-/Q-type voltage-dependent Ca(2+)Channel, and It is functionally important in renal afferent arterioles. Circulation Res. 2000;87:896–902. doi: 10.1161/01.res.87.10.896. [DOI] [PubMed] [Google Scholar]
- 76.Bentley D, Guthrie PB, Kater SB. Calcium ion distribution in nascent pioneer axons and coupled preaxonogenesis neurons in situ. J Neurosci. 1991;11:1300–1308. doi: 10.1523/JNEUROSCI.11-05-01300.1991. [DOI] [PMC free article] [PubMed] [Google Scholar]
- 77.Chuquet J, Hollender L, Nimchinsky EA. High-resolution in vivo imaging of the neurovascular unit during spreading depression. J Neurosci. 2007;27:4036–4044. doi: 10.1523/JNEUROSCI.0721-07.2007. [DOI] [PMC free article] [PubMed] [Google Scholar]
- 78.Kunkler PE, Kraig RP. P/Q Ca2+ channel blockade stops spreading depression and related pyramidal neuronal Ca2+ rise in hippocampal organ culture. Hippocampus. 2004;14:356–367. doi: 10.1002/hipo.10181. [DOI] [PMC free article] [PubMed] [Google Scholar]
- 79.Gniel HM, Martin RL. Changes in membrane potential and the intracellular calcium concentration during CSD and OGD in layer V and layer II/III mouse cortical neurons. J Neurophysiol. 2010;104:3203–3212. doi: 10.1152/jn.00922.2009. [DOI] [PubMed] [Google Scholar]
- 80.Dietz RM, Weiss JH, Shuttleworth CW. Zn2+ influx is critical for some forms of spreading depression in brain slices. J Neurosci. 2008;28:8014–8024. doi: 10.1523/JNEUROSCI.0765-08.2008. [DOI] [PMC free article] [PubMed] [Google Scholar]
- 81.Karube F, Kubota Y, Kawaguchi Y. Axon branching and synaptic bouton phenotypes in GABAergic nonpyramidal cell subtypes. J Neurosci. 2004;24:2853–2865. doi: 10.1523/JNEUROSCI.4814-03.2004. [DOI] [PMC free article] [PubMed] [Google Scholar]
- 82.Cox CL, Denk W, Tank DW, Svoboda K. Action potentials reliably invade axonal arbors of rat neocortical neurons. Proc Natl Acad Sci U S A. 2000;97:9724–9728. doi: 10.1073/pnas.170278697. [DOI] [PMC free article] [PubMed] [Google Scholar]
- 83.Zhang ZW, Kang JI, Vaucher E. Axonal varicosity density as an index of local neuronal interactions. PLoS ONE. 2011;6:e22543. doi: 10.1371/journal.pone.0022543. [DOI] [PMC free article] [PubMed] [Google Scholar]
- 84.Peters A, Kaiserman-Abramof IR. The small pyramidal neuron of the rat cerebral cortex. The perikaryon, dendrites and spines. Am J Anat. 1970;127:321–355. doi: 10.1002/aja.1001270402. [DOI] [PubMed] [Google Scholar]
Associated Data
This section collects any data citations, data availability statements, or supplementary materials included in this article.
Supplementary Materials
Movie 1. Expression of the [Ca2+]i indicator YC3.6 The genetically encoded Ca2+indicator YC3.6 was expressed in soma and dendrites ipsilateral to the injection side as shown in this representative z-projected cortical volume of 410×410×447μm in a WT mouse. Blue square indicates cortical surface. Shadows of pial vessels in the imaging field are also seen. Red, yellow and green indicate low, medium and high [Ca2+]i, respectively.
Movies 2-7. CSD-induced [Ca2+]i changes in cortical neuropil Please see Figure 3 legend for imaging field dimensions, where time-lapse frames from these movies are shown. Movies 2 and 3 show axonal field from WT and S218L mutant, respectively (rows 1-2 in Figure 3a). Movies 4 and 5 are low magnification (rows 3-4 in Figure 3a), and 6 and 7 are high magnification (rows 5-6 in Figure 3a) dendritic views from WT and S218L mutant, respectively.