

Abstract
Background
Hepatitis C virus (HCV) testing and counseling have the potential for impacting individual behaviour and transmission dynamics at the population level. Evidence of the impact of HCV-positive status notification on injection risk reduction is limited. The objective of our study was to (1) assess drug and alcohol use and injection risk behaviors following notification; (2) to compare behaviour change in people who inject drugs (PWID) who received a positive test result and those who remained negative; and (3) to assess the effect of age on risk behavior.
Methods
Data from the InC3 Study were analyzed. Participants initially HCV seronegative were followed prospectively with periodic HCV blood testing and post-test disclosure and interview-administered questionnaires assessing drug use and injection behaviours. Multivariable generalized estimating equations were used to assess behavioral changes over time.
Results
Notification of a HCV positive test was independently associated with a small increase in alcohol use relative to notification of a negative test. No significant differences in post-notification injection drug use, receptive sharing of ancillary injecting equipment and syringe borrowing post-notification were observed between diagnosis groups. Younger PWID receiving a positive HCV test notification demonstrated a significant increase in subsequent alcohol use compared with younger HCV negative.
Conclusion
PWID receiving a HCV positive notification increased frequency of alcohol use post-notification, whilst no reduction in injection drug use behaviors was observed between notification groups. These findings underscore the need to develop novel communication strategies during post-test notification to improve their impact on subsequent alcohol use and risk behaviors.
Keywords: Hepatitis C, testing and counseling, HCV infection status notification, injecting drug use, people who inject drugs (PWID)
INTRODUCTION
Hepatitis C virus (HCV) infection is a serious and common infection among people who inject drugs (PWID) worldwide, for which there are no current vaccines and limitations around the delivery of clinical treatments and prevention modalities. Of an estimated 15.9 million PWID globally, HCV prevalence is estimated between 50% and 90%, and PWID are the population at highest risk of incident infection in high, and in some cases middle- and low-income, countries. 1–3
Harm reduction strategies, such as needle/syringe programs (NSP) and opiate substitution therapy (OST), have helped curtail HIV infection among PWID. Recent studies have observed an association between NSP and OSP with a reduction in HCV incidence. 4–11 Unfortunately OST and NSP coverage still falls short of universal coverage for the majority of PWID populations; as reflected in HCV incidence rates between 11–42 per 100 person-years in PWID populations in North America, Australia, and Europe. 12–14 HCV testing and counseling may provide a valuable addition to the HCV prevention toolkit for PWID where notification can be used as an opportunity to influence individual behaviour and transmission dynamics through identification of new infections.
To date, evidence has been mixed on whether a HCV-positive notification impacts subsequent risk behaviour among PWID. Cross-sectional studies have shown no association between HCV status notification and injecting behaviour change, 16,17 whilst both cross-sectional and prospective studies have observed that knowledge of HCV seroconversion was associated with lower alcohol use. 18,19 Prospective studies of HCV seronegative active PWID followed over time make it possible to examine the influence of HCV test notification on subsequent behaviour change. A recent prospective longitudinal study of young PWID recruited from illicit street drug markets in Melbourne, Australia observed a small decrease in injection frequency following notification of a positive infection status. 20 A comparable study among older PWID in Montréal, Canada observed a decrease in syringe sharing following notification of both virus positive and negative status in addition to a decrease in cocaine and heroin injection use among HCV seroconvertors following positive status notification. 21 These findings were limited by small sample sizes and single PWID cohort samples.
The International Collaboration of Incident HIV and HCV Infection in Injecting Cohorts (InC3 Study) is a multi-cohort study of pooled biological and epidemiological data from prospective studies of PWID in Canada, United States, The Netherlands, and Australia 22 and provides robust data to study risk, incidence, and natural history of HIV and HCV infection across a diverse range of PWID. These multi-country data from initially HCV seronegative PWID followed prospectively offer a unique opportunity to examine the influence of HCV test notification on subsequent injecting behaviour change. The objectives of this study were three-fold: (1) to longitudinally assess substance use and injection behaviours following HCV status notification; (2) to compare injection risk behaviour changes over time between PWID who received a HCV-positive notification (seropositive) and those who received a HCV-negative notification (seronegative); and (3) to assess the effect of age on injection and alcohol risk behavior changes over time following HCV status notification by HCV serostatus notification group.
MATERIALS & METHODS
Study Population and Design
InC3 Study participants were recruited and followed periodically between 1985 and 2011. Overall InC3 Study data includes participants enrolled as HCV negative and who were followed prospectively with systematic testing for HCV infection, or who were enrolled with documented new HCV infection in the two years prior to enrollment. 22 The current study uses data from participants identified as (1) anti-HCV negative at time of study enrollment; (2) having lifetime history of injection drug use, and (3) having a minimum of 3 behavioural data time-points and a minimum of two serological data time points (Figure 1). All cohorts conduct anti-HCV and HCV RNA testing at study enrolment and at regular intervals. All participants provided written informed consent and local ethics committees approved all cohort protocols. Complete study procedures for the larger InC3 Study have been reported elsewhere, 22 with detailed individual study recruitment and follow-up procedures available from the InC3 website (https://inc3.epi-ucsf.org) and summarized in Table 1.
Figure 1.
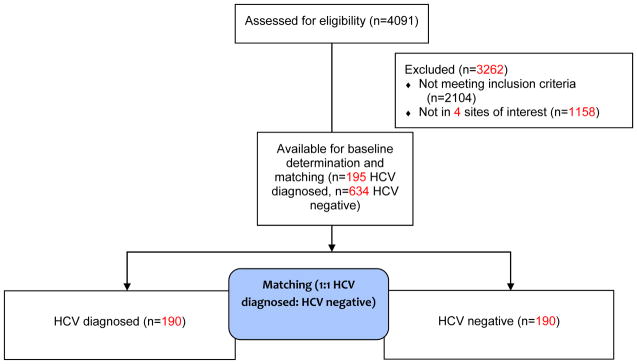
Summary of patient inclusions
Table 1.
Eligibility: drug injection in the past month (reported at “baseline”)
| HEP (Montreal) | HITC (Sydney) | NET (Melbourne) | UFO (San Francisco) | |
|---|---|---|---|---|
| Follow-up schedule | 3/6 month intervals | 6 months | 3-month interviews, HCV testing | 3 month behavioral interview/testing |
| HCV testing procedure | HIV and HCV antibody and HCV-RNA testing at each interview visit. | HIV and HCV testing | HCV testing | HCV testing including antibodies to HCV with EIA (enzyme immunoassays) and HCV RNA virus using TMA and confirmed with HCV RNA testing. |
| Test disclosure procedure | Individualized counseling at each visit. New infection given individualized counseling and support, direct referral for medical assessment | Individual counseling by staff and referral to medical attention | Individual counseling by staff and referral to medical attention | Individual counseling by staff (included discussion to reduce alcohol, reduction of high-risk injection behavior, and referral to medical attention) |
The exposure of interest was a binary measure based on HCV seroconversion notification. Specifically, persons receiving a HCV-positive test (anti-HCV positive or HCV RNA positive after at least one previous negative anti-HCV) were defined as having a change in status notification. Participants were defined “HCV negative”, reflecting no change in their HCV-status, if they received a negative HCV test result. For easier reading, we use the following terms hereafter: “HCV positive diagnosis” for participants receiving a notification of HCV-positive and “HCV negative” for those who tested anti-HCV negative at follow-up.
We employed a within-cohort matching approach to help mitigate the potential influence of site-specific counseling methods and repeated HCV-post test counseling overtime that matched newly diagnosed HCV positive PWID to a PWID who remained HCV-negative based on similarity of visit distribution. 23 “Baseline visit” refers to the data collection time point immediately preceding a new HCV positive diagnosis visit, which was matched to a correspondingly timed visit for the HCV negative counterparts. This process ensured that baseline dates were not significantly different between the HCV positive and HCV negative groups relative to the time of observation in their respective cohort. Of the total 195 HCV positive diagnosed persons eligible for matching, 190 (97.4%) were directly matched to 190 HCV negative participants (Figure 1).
Outcomes
The primary outcomes of interest included four binary (yes/no) self-reported behavioral measures: (1) recent injection drug use, (2) recent receptive syringe sharing; (3) recent receptive injection equipment sharing and (4) recent alcohol use. Each of the four cohorts studied in this analysis employed their own data collection instruments which specified slightly different recall periods for collecting data on the four outcome variables at each interview point across the observation period. Study participants were asked at each interview to report injection drug use, receptive syringe sharing, receptive ancillary equipment sharing and alcohol use within either the previous 1 or 3 months, depending upon the cohort and thus the collection instrument used. Therefore “recent” behavior explicitly refers to behavior reported in either the 1 month or 3 months prior to the interview date, depending upon the cohort. Cohort was included as an adjusting covariate in the outcome models to correct for these differences in recall periods at interview across cohorts as further described in the statistical analyses section. Injection drug use, receptive syringe sharing, and receptive injection equipment sharing were selected because they are behaviours with established associations with HCV transmission and acquisition. 14,24,25 We included recent alcohol use as a secondary outcome measure behaviour given its clinical relevance to liver disease. 26–29
Statistical analyses
Socio-demographic characteristics of the sample were summarized using medians and interquartile ranges (IQR) for continuous measures, and frequency and percentages for categorical measures. HCV positive diagnosed PWID were compared to HCV negative participants on key baseline characteristics using chi-squared tests, Wilcoxon rank-sum, or Kruskal-Wallis test as appropriate with a Bonferroni adjustment for multiple comparisons.
Analyses focused on changes over time in the frequency of the corresponding binary outcome across all visits following the pre-conversion visit. A separate Generalized Estimating Equation (GEE) models was fitted for each behavioral outcome, clustered by the matched pair. All GEE models compared HCV positive diagnosed PWID to matched HCV negative controlling for time since baseline, age, gender, site and baseline-levels of the corresponding outcome. Younger age and male gender were identified a priori as potential correlates of increased risk and included in the models as probable confounders of the association between status notification and subsequent risk behavior. As the models were concerned with, explicitly, behavior change from baseline, baseline risk behavior was further included in the model as an adjusting explanatory variable. Cohort/site was also included as a model covariate to adjust for systematic differences between cohorts including differences in the recall period at each interview as described in the outcomes section. The influence of increasing time away from the notification event was adjusted for by also including time since baseline as a model covariate. Each model in the primary analysis was limited to this specific suite of predictors to avoid over-fitting the observed data. All GEE models were specified using a binomial family function, a logit link and an exchangeable within-group correlation structure. 30 Time was categorized into three-month intervals from the pre-seroconversion visit. The effect sizes are expressed as odds ratios (ORs) or adjusted ORs per three-month increment with 95% confidence interval (95% CI) and statistical significance was assessed with a model-based Wald test (2-tailed, alpha=0.05). Next, we assessed if trends for each outcome behaviour were significantly different between HCV positive diagnosed and HCV negative PWID by extending the GEE models to include a two-way interaction term between time and the serostatus group, where a significant interaction term indicated a significant difference in post-baseline behavior by notification group. To further assess whether age at baseline influenced post-notification risk behavior we conducted additional GEE modelling stratifying the models as described above for each outcome by age, where age was dichotomized as less than 25 years and 25 years or more. The choice of 25 years of age as the cut-point for this subgroup analysis was based on both analysis of the distribution of ages across the matched sample (median age of 25 across the full matched sample) coupled with consideration of age distributions in relevant, precedent studies. This age division further ensured adequate power across all outcomes within both age groups.
All behavioural outcome measures satisfied the assumption of linearity when assessed using a Cochran-Armitage linear trend test. 31 For outcome measures trending toward non-linearity (0.05<p <0.15), GEE models were further expanded to include an interaction between a quadratic function of time-since-baseline and seropositive/seronegative group status. These quadratic models were then compared to their linear equivalent using a Quasi-Likelihood Information Criterion (QIC) appropriate for GEE based models, where a smaller QIC metric corresponds to a better fit. 32 For all outcomes the linear models provided a better fit of the observed data compared to the quadratic models and thus the linear models were preferred. To further corroborate our presumption of a linear trend as presented in the primary analysis, we disaggregated the observation period into a series of smaller time periods and applied piecewise regression splines to assess the presence of sub-trends within post-baseline outcome behaviour. 33 These models performed significantly poorer than either the linear or quadratic GEE modeling, and thus the linear models were preferred. To further test our primary models for the influence of omitted socio-economic factors we extended the base models to include housing arrangements, employment and education as adjusting covariates in a sensitivity analysis. These alternate models were compared against the primary models using the QIC. The a priori stopping rule adopted in this study for determining the number and type of concurrent explanatory variables to be included in any one adjusted model was derivation of the best fitting model that did not over-fit the observed data, as determined by QIC. For all analyses p<0.05 was considered significant. All analyses were undertaken in Stata version 12 (StataCorp, College Station, Texas) and R (R Foundation for Statistical Computing, Vienna, Austria).
RESULTS
Participant characteristics
Of the 829 PWID who satisfied the inclusion criteria, 195 (23.5%) received a HCV positive diagnosis during follow-up whilst 634 (76%) remained HCV negative throughout the study period. The matched sample was primarily male (72%), white (89%), with a median age at study enrolment of 25 (IQR: 22–31), and just over half (56%) completed high school. Across the full sample (n=380) that median time between enrolment into one of the InC3 cohorts and subsequent assignment of baseline was 1.3 years (IQR: 0.6, 2.5). Groups did not significantly differ in either their time from enrolment to baseline (p=0.382) or their number of pre-baseline visits (p=0.509). Post-baseline follow-up time was significantly higher (p=0.001) in HCV positive diagnosed PWID (median 2.1 years, IQR 1.1, 3.8) compared with HCV negative PWID (median 1.3 years, IQR 0.5, 2.9).
Socio-demographics and baseline characteristics
Table 2 compares baseline characteristics of the 380 participants according to their HCV-serostatus. The HCV positive diagnosed group was significantly younger (25 vs. 26, p=0.046), had injected drugs for a shorter period (median: 5 vs 6 years, p=0.013), with a greater proportion unstably housed and without full-time employment at baseline, compared to HCV negative PWID. Overall, the most common drug injected was heroin, with a significantly larger proportion of HCV positive diagnosed PWID reporting heroin as the primary drug injected. At baseline, a greater proportion of HCV positive diagnosed PWID reported recent injection drug use, recent receptive syringe sharing and recent sharing of other ancillary injecting equipment compared to HCV-seronegative participants. There was no difference in recent alcohol use at baseline (56% vs. 61%, p=0.317) (Table 2).
Table 2.
Baseline characteristics by HCV-status notification group
| Total n=380 n (%) | HCV diagnosed n=190 n (%) | HCV negative n=190 n (%) | p-value | |
|---|---|---|---|---|
| Median age (IQR) | 25 (22, 31) | 25 (21, 29) | 26 (22, 33) | 0.046 |
| Male | 275 (72) | 133 (70) | 142 (75) | 0.302 |
| Non-white | 43 (11) | 24 (13) | 19 (10) | 0.439 |
| Median number of years injected drugs (IQR) | 5 (2,10) | 5 (2,10) | 6 (3,11) | 0.013 |
| Primary Injection Drug | ||||
| Heroin | 148 (39) | 86 (45) | 62 (33) | |
| Methamphetamine | 64 (17) | 29 (15) | 35 (18) | |
| Cocaine | 56 (14) | 31 (16) | 25 (13) | 0.0015 |
| Heroin+Cocaine | 18 (5) | 10 (5) | 8 (4) | |
| Other | 38 (10) | 26 (14) | 12 (6) | |
| Unstable housing | 167 (44) | 100 (53) | 67 (35) | <0.001 |
| Full-time employment | 29 (8) | 5 (3) | 24 (13) | <0.001 |
| Completed high school or greater | 211 (56) | 99 (52) | 112 (59) | 0.235 |
| Primary behavioral outcomes | ||||
| Recent* injection drug use | 350 (92) | 187 (98) | 163 (86) | <0.001 |
| Recent* receptive syringe sharing | 113 (30) | 76 (40) | 37 (19) | <0.001 |
| Recent* receptive injection equipment sharing | 151 (40) | 92 (48) | 59 (31) | 0.001 |
| Recent* alcohol use | 222 (58) | 106 (56) | 116 (61) | 0.317 |
| Site | ||||
| Montreal, Canada | 142 | 71 (37) | 71 (37) | |
| Sydney, Australia | 20 | 10 (5) | 10 (5) | |
| Melbourne, Australia | 42 | 21 (11) | 21 (11) | |
| San Francisco, USA | 176 | 88 (46) | 88 (46) | |
recent= past month or past 3-months depending on cohort
Changes in risk behaviors over time
HCV positive diagnosed PWID demonstrated a 5% per 3-month reduction post-notification in the odds of recent injection drug use (adjusted Odds Ratio: aOR 0.95, 95% CI 0.93–0.96) compared with a 3% reduction in HCV negatives (aOR 0.97, 95% CI 0.94–1.00) (Table 3), however no interaction was observed over time by group (p=0.160). Post notification reductions were also observed in receptive syringe sharing in both groups: HCV positive diagnosed PWID (aOR 0.97, 95% CI 0.94–1.00) and the HCV negative group (aOR 0.92, 95% CI 0.87–0.97) with the interaction term (p=0.187) again demonstrating a non-significant difference by group. No significant change in receptive sharing of ancillary injecting equipment was observed (interaction p=0.232). Alcohol use post-disclosure increased significantly among HCV positive diagnosed PWID (three-month aOR 1.02, 95% CI 1.01–1.04) compared with HCV negative (aOR 0.99, 95% CI 0.98–1.02) (interaction p-value=0.023). Median (IQR) age at which increased alcohol consumption was reported across the sample was 26.6 years (24.1, 32.2). The HCV positive diagnosed group were significantly(p=0.002) younger when reporting post-baseline increase in alcohol consumption with a median (IQR) age of 24.3 years (21.2, 28.5) compared with 26.4 years (24.0, 30.6) in the HCV negative group.
Table 3.
GEE modelling of outcome trends over time
| Outcome | HCV negative aORb (95% CI) p-value |
HCV diagnosed aORb (95% CI) p-value |
Interaction (time*HCV-disclosure group) p-value |
|---|---|---|---|
| Recenta injection drug use | 0.97 (0.94, 1.00) 0.051 | 0.95 (0.92, 0.98) 0.001 | 0.160 |
| Recent syringe borrowing | 0.92 (0.87, 0.97) 0.003 | 0.97 (0.94, 1.01) 0.096 | 0.187 |
| Recent receptive sharing - other equipment | 1.00 (0.97, 1.05) 0.807 | 0.97 (0.93, 1.01) 0.160 | 0.232 |
| Recent alcohol use | 0.99 (0.98, 1.02) 0.622 | 1.02 (1.01, 1.04) 0.012 | 0.023 |
Recent=past month or past 3-months depending on cohort
aOR = adjusted odds ratio for every 3-month increment post-baseline, adjusted for site, age, sex and baseline outcome value
Stratifying each of the outcome models by age, no difference was observed across younger ( <25 years of age at baseline) HCV positive and HCV negative PWID (interaction p=0.093) in the three-month odds of recent injection drug use post-notification, with both notification groups demonstrating a 2% reduction per three-month post-notification period; among older (≥25 years of age at baseline) PWID, HCV positive PWID demonstrated a marginally greater reduction in post-notification recent injection drug use compared to the HCV negative group (7% per 3-months compared vs 6%; interaction p=0.087) (Table 4). Among younger PWID, a marginally significant reduction in recent syringe borrowing was observed in HCV negative group compared to HCV positive diagnosed cases (6% reduction in the 3-month odds compared with 1%, interaction p=0.087); and no significant difference across the older HCV positive diagnosed cases compared to the HCV negative group (5% reduction in 3-month odds in both groups; interaction p=0.769). Regarding recent receptive injection equipment sharing), among younger PWID, the HCV negative PWID increased receptive sharing post-notification (4% increase in the 3-month odds) whilst HCV positive PWID experienced no change in risk (0% increase). This did not represent a significant difference by notification group (interaction p=0.301). Among older PWID, no significant difference in recent receptive syringe sharing (interaction p=0.606) or alcohol use (interaction p=0.528) was observed between the HCV positive and HCV negative groups. However among younger PWID, those receiving a positive HCV-test notification demonstrated a significant increase in the odds of alcohol use compared to younger HCV negative PWID (3% increase in 3-month odds vs 1% reduction, interaction p=0.009).
Table 4.
GEE modelling of outcome trends over time – by age group
| Age at baseline < 25 years:
| |||
|---|---|---|---|
| Outcome | HCV negative aORb (95% CI) p-value |
HCV diagnosed aORb (95% CI) p-value |
Interaction (time*HCV-disclosure group) p-value |
| Recenta injection drug use | 0.98 (0.95, 1.02) 0.261 | 0.98 (0.96, 1.00) 0.079 | 0.093 |
| Recent syringe borrowing | 0.94 (0.86, 0.99) 0.047 | 0.99 (0.94, 1.04) 0.612 | 0.087 |
| Recent receptive sharing - other equipment | 1.04 (0.98, 1.11) 0.169 | 1.00 (0.92, 1.09) 0.911 | 0.301 |
| Recent alcohol use | 0.99 (0.97, 1.01) 0.128 | 1.03 (1.01, 1.04) 0.015 | 0.009 |
| Age at baseline >= 25 years:
| |||
|---|---|---|---|
| Outcome | HCV negative aORb (95% CI) p-value |
HCV diagnosed aORb (95% CI) p-value |
Interaction (time*HCV-disclosure group) p-value |
| Recenta injection drug use | 0.94 (0.91, 0.96) <0.001 | 0.93 (0.90, 0.97) <0.001 | 0.087 |
| Recent syringe borrowing | 0.95 (0.88, 1.01) 0.072 | 0.95 (0.89, 0.99) 0.036 | 0.769 |
| Recent receptive sharing - other equipment | 0.97 (0.91, 1.05) 0.401 | 0.96 (0.92, 1.02) 0.109 | 0.606 |
| Recent alcohol use | 0.97 (0.91, 1.02) 0.142 | 1.00 (0.99, 1.02) 0.434 | 0.528 |
Recent=past month or past 3-months depending on cohort
aOR = adjusted odds ratio for every 3-month increment post-baseline, adjusted for site, age, sex and baseline outcome value
To assess whether the significantly greater post baseline follow-up and number of visits in the HCV positive diagnosed group conferred a potential ascertainment bias relative to the HCV negative group, we re-ran the modelling using simultaneous censoring of the matched pair as a sensitivity analysis (Supplementary Table 1). This involved censoring the follow-up of both HCV positive diagnosed and HCV negative members of the matched pair at the point of earliest censoring of either member of the matched pair. Although these changes resulted in a marginal decrease in the magnitude of the hazard reductions or increases, there was no change in the pattern and direction of significant hazards or interaction terms when compared to the primary analysis. The inclusion of employment, education and housing arrangements as adjusting covariates in an additional sensitivity analysis (Supplementary Table 2) resulted in no significant change to either the magnitude or pattern of significance of our primary HCV notification group predictor for any of the four outcome risk behaviors studied whilst returning a poorer overall fit of the observed data, relative to the primary analysis.
DISCUSSION
This is the first study to examine the impact of HCV seroconversion notification on subsequent risk behaviors across multiple study sites and continents. Given the mixed evidence base around the impact of HCV status notification on subsequent injection drug and alcohol risk behavior, and the overall limited quantity of study data currently informing Centres for Disease Control and Prevention guidelines on testing and counseling, 34,35 this study provides a comparatively higher-powered, cross-setting corroboration of previous observations from single site studies that syringe sharing decreases following status notification regardless of HCV status and extends this observation to injection drug use in general. Conversely, our results contradict previous suggestions that alcohol use decreases following notification of a HCV positive diagnosis, with observation of a significant increase in alcohol use post-notification of a HCV positive diagnosis. No difference was observed in receptive sharing of ancillary injection equipment in either HCV positive or negative groups.
Whilst our study did not collect data on the quantity of alcohol used, our observation of a modest, albeit significant, increase in the proportion of participants using any alcohol following notification of a HCV positive test points to a need for ongoing risk reduction initiatives in this area. An increase in alcohol consumption has been observed during periods of injection cessation, potentially as a compensation mechanism. 36 Alcohol-related liver disease in HCV infected subjects is associated with higher standardized mortality ratios 37,38 and consumption exceeding 50 grams daily is associated with progression to cirrhosis in the chronically infected. 39 Lastly, alcohol use can interfere with the immune system’s ability to naturally clear HCV infection. 40 Our results suggest a greater role for post-test counselling that stresses the importance of managing post-disclosure alcohol consumption patterns to delay or prevent disease progression and support recent WHO guidelines to this same effect.41 Our exploratory analysis of age-related effects observed interesting differences in recent high-risk behaviors post HCV-test notification by age group. Across the sample, HCV infected PWID were younger when reporting increased alcohol consumption relative to HCV negative PWID (24.3 years vs 26.4 years, p=0.002). Among younger PWID, those receiving a positive HCV test notification significantly increased their consumption of alcohol compared to the HCV-negative group. This finding highlights the unique vulnerability young PWID experience and could inform tailoring post-HCV test counseling protocols to include alcohol related resources.
More recent data from Australia and Canada have suggested more sustained protective behavioral changes associated with the notification process.20,21 Consistent with our observation of a trend towards a reduction in injection use, a recent prospective, longitudinal study of the Melbourne-based subset of the InC3 cohort studied here, using a similar GEE-based modelling approach, observed that PWID who received a diagnosis of HCV during the study period were associated with, on average, a decrease of 0.35 injections per month post HCV-disclosure (p=0.046). 20 Whilst our study observed a significant decrease in recent injection drug use specifically among HCV positive diagnosed, this was not significantly different to the equivalent trend in the HCV negative group which in part may be secondary to characterizing recent use as a binary variable rather than the potentially more powerful frequency of injection outcome. Bruneau et al further applied a comparable modeling strategy as employed by our study to show a linear reduction in injection of both heroin and cocaine post-disclosure of HCV status, contrasting with the absence of a comparable trend in PWID remaining seronegative following screening. 21 The demographics of this cohort, including a majority of chronic cocaine and opioid users with a mean age of 36 years old might partially explain differences in outcomes.
In the setting of the behavioral changes observed by our study, it is clear that timely notification of a HCV result presents an important opportunity to discuss behavior change and injection partnership notification as a risk-mitigation strategy and a potential circuit-breaker for subsequent infection or re-infection. This underscores the importance and potential value of timely notification, injection partnership notification and expanded post-notification counselling. 42,43 A recent systematic review of 28 qualitative studies examining PWID experiences with HCV testing identified several major themes including missed opportunities at the time of notification for sharing information and advice, particularly when a positive test result was unexpected. 44 Training for healthcare providers and health organizations in the practice of non-judgmental care may expand the reach of current HCV testing and counseling programs behavior. 45
Our study has several limitations. First, given the longitudinal nature of our study, data may have been influenced by attrition bias. A sensitivity analysis applying simultaneous censoring to each member of the matched pair resulted in model estimates that were consistent with the non-censored models. Whilst censoring in the setting of a non-randomized, observational study of drug and alcohol behavior is unlikely to occur at random, these results suggests differentials in follow-up and ascertainment opportunity were not large enough to adversely impact significantly upon the model results. Second, our analyses rely on self-reported data. Although there is some published evidence to suggest that drug users provide reliable and valid responses, the risk of self-report bias remains a possibility, whether associated with recall problems of social pressures discouraging full disclosure of risk behavior. 46 Lastly, differences across individual study instruments limited our ability to include potentially important covariates that may have influenced behavior change such as drug treatment uptake, mental health status, HCV-treatment uptake, medical care access and social network characteristics in addition to outcome variables such as injection frequency and number of injecting partners.
Notification of a change in HCV-serostatus marks an important opportunity for risk reduction counseling. Our findings extend upon those from Australia and Canada to show the opportunity to better utilize the test notification event as a target for education and harm reduction counseling. Our study used a multi-cohort sample to observe a small, significant increase in alcohol use following notification of HCV seropositive test. Based on the observations in our and comparable studies, the importance of strengthening our current HCV testing program is warranted. In a time when both financial resources and time are limited, streamlining prevention programs are of great importance. Expanding current testing and counseling programs to evaluate their protocols to improve test result notification numbers, targeted testing for younger PWID, and multimedia modes to share HCV risk reduction information will add considerable value to current prevention efforts. The potential benefits of such interventions are, broadly speaking, two-fold: 1) a reduction in the incidence and prevalence of virus transmission with a consequent reduction in people being infected with HCV and 2) a reduction in the morbidity and mortality associated with infection due to the decreased number of new infections and the earlier identification of those already infected. Thus the gain associated with strategic targeting of empirically-guided interventions based on real world data such as that described in this study is by definition felt in two spheres – the individual PWID and broader public spheres. The expense to public health-care systems of treating and managing the decompensated cirrhosis associated with chronic HCV infection has been estimated to range from US$24000–39000 in lifetime disease costs. 47–48 Reducing transmission and limiting disease exacerbation through alcohol exposure can in part offset these considerable treatment and hospitalization costs to community. A strategy of targeting both screening and interventions at riskier PWID can further avoid the costs and false-positives associated with mass screening.
Although not examined here, a comparison of the effects of rapid HCV testing and on HCV RNA disclosure on injection risk behavior change should be explored. Similarly, consideration of the characteristics of the social network in which PWID interact via formal networks analysis may provide valuable insights into network-based moderators of risk behavior. Finally, research into the impact of counseling on HCV incidence would formally corroborate a role for post-HCV test notification in modification of risk behavior which may subsequently impact on HCV transmission, comparable to what has been undertaken within HIV research. 49,50
Supplementary Material
a. Recent=past month or past 3-months depending on cohort
b. aOR = adjusted odds ratio for every 3-month increment post-baseline, adjusted for age, sex, site and baseline outcome value
a. Recent=past month or past 3-months depending on cohort
b. aOR = adjusted odds ratio for every 3-month increment post-baseline, adjusted for age, sex, site baseline outcome value, living arrangements, employment and education
Acknowledgments
FUNDING
InC3 includes public funding from the National Institute of Health (NIH) National Institute on Drug Abuse (NIDA) grant number R01-DA32056-01A1. MM is funded in part by NIH/NIDA grant number R01 DA016017 and K01 DA037802. Other research support includes MOP-103138, MOP-210232 (CIHR, JB). LM is supported by a National Health and Medical Research Council (NHMRC) Senior Research Fellowship (Elizabeth Blackburn Fellowship – Public Health). JG is supported by an NHMRC Career Development Fellowship. GD and AL are supported by NHMRC Practitioner Research Fellowships. The Kirby Institute is affiliated with the Faculty of Medicine, UNSW and received funding from the Australian Government Department of Health. HITS-c was initially funded by the University of New South Wales (The UNSW Hepatitis C Vaccine Initiative) and subsequently by the National Health and Medical Research Council (Grant #630483, Hepatitis C Vaccine Preparedness Study).
The InC3 study group steering committee includes: Kimberly Page (Chair, UFO STUDY); Julie Bruneau (HEPCO); Andrea L. Cox (BBAASH); Gregory J. Dore (ATAHC); Jason Grebely (ATAHC); Margaret Hellard (N2); Georg Lauer (BAHSTION); Arthur Y. Kim (BAHSTION); Andrew R. Lloyd (HITS-p); Lisa Maher (HITS-c); Barbara H. McGovern (BAHSTION); Maria Prins (ACS); and Naglaa H. Shoukry (HEPCO). The coordinating center includes: Meghan Morris (study coordinator); Judy Hahn (coinvestigator); Stephen Shiboski (co-investigator), Ali Mirzazadeh and Thomas M. Rice (data manager). The site data managers include: Maryam Alavi (ATAHC); Rachel Bouchard (HEPCO); Jennifer Evans (UFO Study); Bart Grady (ACS); Jasneet Aneja (BAHSTION); Rachel Sacks-Davis (Networks 2); Suzy Teutsch (HITS-p); Bethany White (HITS-c); Brittany Wells (BBAASH); and Geng Zang (HEPCO). InC3 researcher acknowledgments include: ATAHC: Tanya Applegate, Gail Matthews, and Barbara Yeung; ACS: Bart Grady and Janke Schinkel; BAHSTION: Jasneet Aneja and Leslie Erin Prince; HEPCO: Elise Roy and Geng Zang; HITS-c: Anna Bates, Jarliene Enriquez, Sammy Chow, and Bethany White; HITS-p: Luke McCredie and Suzy Teutsch; N2: Campbell Aitken, Joseph Doyle, and Tim Spelman; and UFO: Jennifer Evans.
References
- 1.Nelson PK, Mathers BM, Cowie B, et al. Global epidemiology of hepatitis B and hepatitis C in people who inject drugs: results of systematic reviews. The Lancet. 2011;378(9791):571–583. doi: 10.1016/S0140-6736(11)61097-0. [DOI] [PMC free article] [PubMed] [Google Scholar]
- 2.Negro F, Alberti A. The global health burden of hepatitis C virus infection. Liver International. 2011;31(s2):1–3. doi: 10.1111/j.1478-3231.2011.02537.x. [DOI] [PubMed] [Google Scholar]
- 3.Degenhardt L, Whitefor HA, Ferrari AJ, et al. Global burden of disease attributable to illicit drug use and dependence: findings from the Global Burden of Disease Study 2010. The Lancet. 2013;382(9904):1564–1574. doi: 10.1016/S0140-6736(13)61530-5. [DOI] [PubMed] [Google Scholar]
- 4.Wright NM, Tompkins CN. A review of the evidence for the effectiveness of primary prevention interventions for hepatitis C among injecting drug users. Harm Reduct J. 2006;3(27):1–9. doi: 10.1186/1477-7517-3-27. [DOI] [PMC free article] [PubMed] [Google Scholar]
- 5.Craine N, Hickman M, Parry JV, et al. Incidence of hepatitis C in drug injectors: the role of homelessness, opiate substitution treatment, equipment sharing, and community size. Epidemiology and Infection. 2009;137(09):1255–1265. doi: 10.1017/S095026880900212X. [DOI] [PubMed] [Google Scholar]
- 6.Turner KM, Hutchinson S, Vickerman P, et al. The impact of needle and syringe provision and opiate substitution therapy on the incidence of hepatitis C virus in injecting drug users: pooling of UK evidence. Addiction. 2011;106(11):1978–1988. doi: 10.1111/j.1360-0443.2011.03515.x. [DOI] [PubMed] [Google Scholar]
- 7.Hagan H, Pouget ER, Des Jarlais DC. A systematic review and meta-analysis of interventions to prevent hepatitis C virus infection in people who inject drugs. Journal of Infectious Diseases. 2011;204(1):74–83. doi: 10.1093/infdis/jir196. [DOI] [PMC free article] [PubMed] [Google Scholar]
- 8.Vickerman P, Martin N, Turner K, et al. Can needle and syringe programmes and opiate substitution therapy achieve substantial reductions in hepatitis C virus prevalence? Model projections for different epidemic settings. Addiction. 2012;107(11):1984–1995. doi: 10.1111/j.1360-0443.2012.03932.x. [DOI] [PubMed] [Google Scholar]
- 9.Tsui J, Evans J, Lum PJ, et al. Association of opioid agonist therapy with lower incidence of hepatitis C virus infection in young adult injection drug users. JAMA-Intern Med. doi: 10.1001/jamainternmed.2014.5416. e-pub October 27, 2014. [DOI] [PMC free article] [PubMed] [Google Scholar]
- 10.White B, Dore GJ, Lloyd AR, et al. Opioid substitution therapy protects against hepatitis C virus acquisition in people who inject drugs: the HITS-c study. Med J Aust. 2014 Sep 15;201(6):326–9. doi: 10.5694/mja13.00153. [DOI] [PubMed] [Google Scholar]
- 11.Nolan S, Dias Lima V, Fairbairn N, et al. The impact of methadone maintenance therapy on hepatitis C incidence among illicit drug users. Addiction. 2014 Jul 15; doi: 10.1111/add.12682. Epub ahead of print. [DOI] [PMC free article] [PubMed] [Google Scholar]
- 12.Roy E, Nonn E, Haley N, et al. Hepatitis C meanings and preventive strategies among street- involved young injection drug users in Montreal. J Drug Policy. 2007;18(5):397–405. doi: 10.1016/j.drugpo.2007.02.005. [DOI] [PubMed] [Google Scholar]
- 13.Maher L, Jalaludin B, Chant KG, et al. Incidence and risk factors for hepatitis C seroconversion in injecting drug users in Australia. Addiction. 2006;101(10):1499–1508. doi: 10.1111/j.1360-0443.2006.01543.x. [DOI] [PubMed] [Google Scholar]
- 14.Hahn JA, Page-Shafer K, Lum PJ, et al. Hepatitis C virus seroconversion among young injection drug users: relationships and risks. J Infect Dis. 2002;186(11):1558–1564. doi: 10.1086/345554. [DOI] [PubMed] [Google Scholar]
- 15.Sacks-Davis R, Daraganova G, Aitken C, et al. Hepatitis C virus phylogenetic clustering is associated with the social-injecting network in a cohort of people who inject drugs. PLoS One. 2012;7(10):e47335. doi: 10.1371/journal.pone.0047335. [DOI] [PMC free article] [PubMed] [Google Scholar]
- 16.Norden L, Saxon L, Kåberg M, et al. Knowledge of status and assessment of personal health consequences with hepatitis C are not enough to change risk behaviour among injecting drug users in Stockholm County, Sweden. Scandinavian journal of infectious diseases. 2009;41(10):727–734. doi: 10.1080/00365540903159279. [DOI] [PubMed] [Google Scholar]
- 17.Cox J, Morissette C, De P, et al. Access to sterile injecting equipment is more important than awareness of HCV status for injection risk behaviours among drug users. Substance use & misuse. 2009;44(4):548–568. doi: 10.1080/10826080802544349. [DOI] [PMC free article] [PubMed] [Google Scholar]
- 18.McCusker M. Influence of hepatitis C status on alcohol consumption in opiate users in treatment. Addiction. 2001;96(7):1007–1014. doi: 10.1046/j.1360-0443.2001.967100710.x. [DOI] [PubMed] [Google Scholar]
- 19.Tsui JI, Vittinghoff E, Hahn JA, et al. Risk behaviours after hepatitis C virus seroconversion in young injection drug users in San Francisco. Drug and alcohol dependence. 2009;105(1):160–163. doi: 10.1016/j.drugalcdep.2009.05.022. [DOI] [PMC free article] [PubMed] [Google Scholar]
- 20.Aspinall EJ, Weir A, Sacks-Davis R, et al. Does informing people who inject drugs of their hepatitis C status influence their injecting behaviour? Analysis of the networks II study. International Journal of Drug Policy. 2013;25(1):179–182. doi: 10.1016/j.drugpo.2013.08.005. [DOI] [PubMed] [Google Scholar]
- 21.Bruneau J, Zang G, Abrahamowicz M, et al. Sustained drug use changes following hepatitis C screening and counseling among recently infected persons who inject drugs: a longitudinal study. Clinical infectious diseases. 2013;58(6):755–761. doi: 10.1093/cid/cit938. [DOI] [PubMed] [Google Scholar]
- 22.Grebley J, Morris M, Rice T, et al. Cohort Profile: The International Collaboration of Incident HIV and Hepatitis C in Injecting Cohorts (InC3) Study. International Journal of Epidemiology. 2012:dys167. doi: 10.1093/ije/dys167. [DOI] [PMC free article] [PubMed] [Google Scholar]
- 23.Bruneau J, Daniel M, Abrahamowicz M, et al. Trends in human immunodeficiency virus incidence and risk behaviour among injection drug users in Montreal, Canada: A 16-year longitudinal study. American Journal of Epidemiology. 2011;173(9):1049–1058. doi: 10.1093/aje/kwq479. [DOI] [PMC free article] [PubMed] [Google Scholar]
- 24.Aust J. Sharing of drug preparation equipment as a risk factor for hepatitis C. Commun Dis Public Health. 2000;3:121–126. [Google Scholar]
- 25.De P, Roy E, Boivin JF, et al. Risk of hepatitis C virus transmission through drug preparation equipment: a systematic and methodological review. Journal of viral hepatitis. 2008;15(4):279–292. doi: 10.1111/j.1365-2893.2007.00942.x. [DOI] [PMC free article] [PubMed] [Google Scholar]
- 26.Loguercio C, di Pierro M, di Marino MP, et al. Drinking habits of subjects with hepatitis C virus-related chronic liver disease: prevalence and effect on clinical, virological and pathological aspects. Alcohol and Alcoholism. 2000;35(3):296–301. doi: 10.1093/alcalc/35.3.296. [DOI] [PubMed] [Google Scholar]
- 27.Ostapowicz G, Watso KJ, Locarnini SA, et al. Role of alcohol in the progression of liver disease caused by hepatitis C virus infection. Hepatology. 1998;27(6):1730–1735. doi: 10.1002/hep.510270637. [DOI] [PubMed] [Google Scholar]
- 28.Wile TE, McCarthy M, Breidi L, et al. Impact of alcohol on the histological and clinical progression of hepatitis C infection. Hepatology. 1998;28(3):805–809. doi: 10.1002/hep.510280330. [DOI] [PubMed] [Google Scholar]
- 29.Corrao G, Aricò S. Independent and combined action of hepatitis C virus infection and alcohol consumption on the risk of symptomatic liver cirrhosis. Hepatology. 1998;27(4):914–919. doi: 10.1002/hep.510270404. [DOI] [PubMed] [Google Scholar]
- 30.Hin LY, Carey VJ, Wang YG. Criteria for Working–Correlation–Structure Selection in GEE. The American Statistician. 2007;61(4) [Google Scholar]
- 31.Armitage P. Tests for linear trends in proportions and frequencies. Biometrics. 1955;11(3):375–386. [Google Scholar]
- 32.Pan W. Akaike’s information criterion in generalized estimating equations. Biometrics. 2001;57(1):120–125. doi: 10.1111/j.0006-341x.2001.00120.x. [DOI] [PubMed] [Google Scholar]
- 33.Friedman JH. Multivariate adaptive regression splines. The Annals of Statistics. 1991:1–67. [Google Scholar]
- 34.American Association for the Study of Liver Diseases, & Infectious Diseases Society of America. Recommendations for testing, managing, and treating hepatitis C. Alexandria, VA: AASLD and IDSA; 2014. [Accessed July, 10]. Available from http://www.hcvguidelines.org/full-report-view. [Google Scholar]
- 35.Centers for Disease Control and Prevention (CDC) Testing for HCV infection: an update of guidance for clinicians and laboratorians. MMWR Morb Mortal Wkly Rep. 2013;62(18):362–365. [PMC free article] [PubMed] [Google Scholar]
- 36.Evans JL, Hahn JA, Lum PJ, et al. Predictors of injection drug use cessation and relapse in a prospective cohort of young injection drug users in San Francisco, CA (UFO Study) Drug and alcohol dependence. 2009;101(3):152–157. doi: 10.1016/j.drugalcdep.2008.12.007. [DOI] [PMC free article] [PubMed] [Google Scholar]
- 37.Dore GJ, Law M, MacDonald M, et al. Epidemiology of hepatitis C virus infection in Australia. Journal of Clinical Virology. 2003;26(2):171–184. doi: 10.1016/s1386-6532(02)00116-6. [DOI] [PubMed] [Google Scholar]
- 38.Backmund M, Schütz CG, Meyer K, et al. Alcohol consumption in heroin users, methadone-substituted and codeine-substituted participants–frequency and correlates of use. European Addiction Research. 2003;9(1):45–50. doi: 10.1159/000067733. [DOI] [PubMed] [Google Scholar]
- 39.Strader DB, Wright T, Thomas DL, et al. Diagnosis, management, and treatment of hepatitis C. Hepatology. 2004;39(4):1147–1171. doi: 10.1002/hep.20119. [DOI] [PubMed] [Google Scholar]
- 40.Piasecki BA, Lewis JD, Reddy KR, et al. Influence of alcohol use, race, and viral coinfections on spontaneous HCV clearance in a US veteran population. Hepatology. 2004;40(4):892–899. doi: 10.1002/hep.20384. [DOI] [PubMed] [Google Scholar]
- 41.World Health Organization. Guidelines for the screening, care and treatment of persons with hepatitis C infection. Published April 2014. [PubMed] [Google Scholar]
- 42.Page K, Morris MD, Hahn JA, et al. Injection drug use and hepatitis C virus infection in young adult injectors: using evidence to inform comprehensive prevention. Clinical infectious diseases. 2013;57(suppl 2):S32–S38. doi: 10.1093/cid/cit300. [DOI] [PMC free article] [PubMed] [Google Scholar]
- 43.Rolls DA, Daraganova G, Sacks-Davis R, et al. Modelling hepatitis C transmission over a social network of injecting drug users. Journal of Theoretical Biology. 2012;297:73–87. doi: 10.1016/j.jtbi.2011.12.008. [DOI] [PubMed] [Google Scholar]
- 44.Jones L, Atkinson A, Bates G, et al. Views and experiences of hepatitis C testing and diagnosis among people who inject drugs: Systematic review of qualitative research. International Journal of Drug Policy. 2014;25(2):204–11. doi: 10.1016/j.drugpo.2013.11.004. [DOI] [PubMed] [Google Scholar]
- 45.Barocas JA, Brennan MB, Hull SJ, et al. Barriers and facilitators of hepatitis C screening among people who inject drugs: a multi-city, mixed-methods study. Harm Reduction Journal. 2014;11(1):1. doi: 10.1186/1477-7517-11-1. [DOI] [PMC free article] [PubMed] [Google Scholar]
- 46.Johnson T, Fendrich M. Modeling sources of self-report bias in a survey of drug use epidemiology. Annals of Epidemiology. 2005;15(5):381–389. doi: 10.1016/j.annepidem.2004.09.004. [DOI] [PubMed] [Google Scholar]
- 47.Lavanchy D. The global burden of hepatitis C. Liver International. 2009;29(s1):74–81. doi: 10.1111/j.1478-3231.2008.01934.x. [DOI] [PubMed] [Google Scholar]
- 48.Siebert U, Sroczynski G, Rossol S, et al. Cost-effectiveness of peginterferon alpha-2b plus ribavirin versus interferon alpha-2b plus ribavirin for initial treatment of chronic hepatitis C. Gut. 2003;52:425–432. doi: 10.1136/gut.52.3.425. [DOI] [PMC free article] [PubMed] [Google Scholar]
- 49.Higgins DL, Galavotti C, O’Reilly KR, et al. Evidence for the effects of HIV antibody counseling and testing on risk behaviors. Jama. 1991;266(17):2419–2429. [PubMed] [Google Scholar]
- 50.Weinhardt LS, Carey MP, Johnson BT, et al. Effects of HIV counseling and testing on sexual risk behavior: a meta-analytic review of published research, 1985–1997. American journal of public health. 1999;89(9):1397–1405. doi: 10.2105/ajph.89.9.1397. [DOI] [PMC free article] [PubMed] [Google Scholar]
Associated Data
This section collects any data citations, data availability statements, or supplementary materials included in this article.
Supplementary Materials
a. Recent=past month or past 3-months depending on cohort
b. aOR = adjusted odds ratio for every 3-month increment post-baseline, adjusted for age, sex, site and baseline outcome value
a. Recent=past month or past 3-months depending on cohort
b. aOR = adjusted odds ratio for every 3-month increment post-baseline, adjusted for age, sex, site baseline outcome value, living arrangements, employment and education